INTRODUCTION
Protected area (PA) networks constitute the most important global strategy for biodiversity conservation, and the first line of action in efforts to decrease the degradation and habitat loss for species (Jenkins & Joppa Reference Jenkins and Joppa2009). Nowadays one of the main concerns in biological conservation is to make more efficient PA networks, for example, through selection of new PAs that maximize the increase in representativeness of biodiversity in an area. Representativeness is therefore a key concept (Margules & Pressey Reference Margules and Pressey2000; Margules & Sarkar Reference Margules and Sarkar2007) that evaluates how adequately a group of PAs captures the full biodiversity in a region through a surrogate, such as species and/or ecosystems (Kukkala & Moilanen Reference Kukkala and Moilanen2013).
Some measurable and spatially explicit biodiversity features have been proposed as surrogates of overall biodiversity elements (e.g. flagship species, key taxonomic groups, environmental units, habitat types). In the 1990s and 2000s most conservation planners moved toward a coarse filter/fine filter approach, following the idea that by conserving examples of ecological systems, threatened species and communities, the majority of native biodiversity could be preserved (Stoms et al. Reference Stoms, Comer, Crist and Grossman2005). However, there is no agreement about this assumption (Brooks et al. Reference Brooks, da Fonseca and Rodrigues2004; Cowling et al. Reference Cowling, Knight, Faith, Ferrier, Lombard, Driver, Rouget, Maze and Desmet2004). Taxon-based methods may be better surrogates than environmental methods (Rodrigues & Brooks Reference Rodrigues and Brooks2007); however, ecologically, none of the three most commonly used types of taxon-based surrogacy (focal species, taxon richness and complementarity) were completely supported by niche or neutral community models (Saetersdal & Gjerde Reference Saetersdal and Gjerde2011). Only complementarity can be consistent with niche theory under strong species composition gradients (Saetersdal & Gjerde Reference Saetersdal and Gjerde2011). Ultimately, the effectiveness of taxon and environmental approaches has shown varied and conflicting results (Grantham et al. Reference Grantham, Pressey, Wells and Beattie2010; Lewandowski et al. Reference Lewandowski, Noss and Parsons2010). The suitability of different surrogates therefore needs further assessment. In this study we evaluate the ability of environmental units as surrogates to represent plant species diversity in the PA system in Chile.
The state-managed PA system (SNASPE is the acronym in Spanish) in Chile is a good model to evaluate the surrogacy of environmental units within a PA network because in recent decades, these areas have largely been established to meet criteria of environmental representativeness (Ormazabal Reference Ormazabal1993; Pauchard & Villarroel Reference Pauchard and Villarroel2002). As a result, since the establishment of the SNASPE in the 1980s, the PA within Chile has increased proportionally to the representativeness of vegetation units (F. Luebert, P. Pliscoff & T. Fuentes-Castillo, unpublished data). Currently, almost 20% of the land territory of Chile is covered by the SNASPE (Rovira et al. Reference Rovira, Ortega, Álvarez and Molt2008). There have been several evaluations of the representativeness of vegetation units in the SNASPE (Luebert & Becerra Reference Luebert and Becerra1998; Mardones Reference Mardones1998; Luebert & Pliscoff Reference Luebert and Pliscoff2006; Pliscoff & Fuentes-Castillo Reference Pliscoff and Fuentes-Castillo2011). However, neither floristic representativeness nor the ability of environmental units to act as surrogates of plant species diversity has been evaluated at a national level. This kind of analysis is a pending challenge to reformulate the PA network in the country (Elbers Reference Elbers2011). Because the Chilean flora is relatively well-known (Zuloaga et al. Reference Zuloaga, Morrone and Belgrano2008) and floristic information is currently available for several SNASPE areas, this study set out to address the following specific questions: (1) How much floristic information is currently available for Chilean PAs? (2) How is the Chilean native flora represented in the PAs? (3) Is there a relationship between environmental and floristic representativeness that supports the use of vegetation types as surrogates for floristic elements in the Chilean PAs?
METHODS
Study area
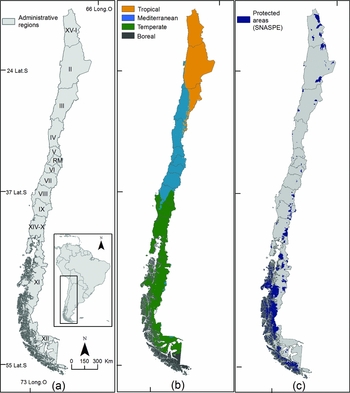
The study comprised all 96 continental PAs of the National System of PAs in Chile (SNASPE; Rovira et al. Reference Rovira, Ortega, Álvarez and Molt2008), including two National Parks created in 2010 and 2014 (Morro Moreno and Yendegaia National Parks; Fig. 1 c).
Map of study area showing (a) administrative regions of Chile and their corresponding codes (I = Tarapacá; II = Antofagasta; III = Atacama; IV = Coquimbo; IX = Araucanía; RM = Metropolitana de Santiago; V = Valparaíso; VI = O'Higgins; VII = Maule; VIII = Bío-Bío; X = Los Lagos; XI = Aysén; XII = Magallanes; XIV = Los Ríos; XV = Arica y Parinacota); (b) bioclimatic units; and (c) protected areas of the National System of Protected Areas.

Database construction and information availability
In order to evaluate environmental units as surrogates of plant species, we used the classification system of Chilean vegetation of Luebert & Pliscoff (Reference Luebert and Pliscoff2006), which is now the Chilean standard for evaluation of representativeness of PAs. This system has a total of 127 vegetation types grouped into 17 vegetation formations, which are mapped for the whole Chilean territory.
A database of the vascular flora of Chile was built based on Zuloaga et al. (Reference Zuloaga, Morrone and Belgrano2008), compiled at the species level, including taxonomic classifications at genus, family and division levels, synonymies, biogeographic status (non-endemic natives or endemics) and species distributions based on presence in Chile's administrative regions. We focused on native plant species and excluded exotic species from the analyses. The division category was updated according to APG III (2009) and Christenhusz et al. (Reference Christenhusz, Zhang and Schneider2011) using the following groups for the analysis: lycophytes, monilophytes, gymnosperms, magnoliids, monocots and eudicots. According to this, the native flora of Chile comprises around 4372 species, 54.8% of which are non-endemic natives and 45.2% are Chilean endemics (Zuloaga et al. Reference Zuloaga, Morrone and Belgrano2008).
Since the floristic catalogue (Zuloaga et al. Reference Zuloaga, Morrone and Belgrano2008) was constructed before the creation of two new administrative regions of Chile, we kept the old administrative divisions. Therefore, the Los Ríos Region (XIV) and Arica y Parinacota (XV) were treated together within Los Lagos (X) and Tarapacá (I), respectively. Administrative regions in Chile reflect a latitudinal pattern from Arica y Parinacota/Tarapacá Regions (I–XV) in the northern part of the country, to the Magallanes Region (XII) in the southern part (Fig. 1 a).
The flora present in the SNASPE was incorporated into the database based on all published floristic checklists of PAs. Only those studies with the goal of establishing the flora of a PA were considered. This excludes studies aimed at describing vegetation and/or ecological parameters indirectly related to the flora of a place (Table S1).
Synonymy followed Zuloaga et al. (Reference Zuloaga, Morrone and Belgrano2008) with updates from the Instituto de Botánica Darwinion (2013), The Plant List (2010) and Tropicos (Missouri Botanical Garden 2013). On the few occasions where species names could not be allocated, expert opinion was sought on a case-by-case basis (see acknowledgements).
Floristic representativeness
Floristic representativeness based on current data
Floristic representativeness of the SNASPE was evaluated as percentage of protected flora with respect to the total for main taxonomic divisions and administrative regions. For those PAs crossing the boundary between two administrative regions, species were recorded as present in the PAs of both regions according to the regional flora (Zuloaga et al. Reference Zuloaga, Morrone and Belgrano2008).
To evaluate if the regional pattern of observed representativeness was strongly influenced by the availability of information, a Spearman correlation test was carried out between regional representativeness and the proportion of PAs with information per region.
In addition, to test the relationship between endemism and representativeness proposed by Rodrigues et al. (Reference Rodrigues, Andelman, Bakarr, Boitani, Brooks, Cowling, Fishpool, da Fonseca, Gaston, Hoffmann, Long, Marquet, Pilgrim, Pressey, Schipper, Sechrest, Stuart, Underhill, Waller, Watts and Yan2004), a Spearman correlation test was carried out between regional proportion of endemism and regional total representativeness.
Further correlation analyses were conducted to test the species–area relationship inside the SNASPE. Spearman's test was used to correlate both PA size and percentage of regional area protected with species richness within the SNASPE.
Predicted floristic representativeness
A sample-based species accumulation (rarefaction) curve of richness was built using the software EstimateS 9.1 (Colwell Reference Colwell2013). Known PA floras were treated as samples, accumulated without replacement. To estimate the representativeness of the entire SNASPE, the species accumulation curve was projected by non-parametric extrapolation (Colwell et al. Reference Colwell, Chao, Gotelli, Lin, Mao, Chazdon and Longino2012). For this analysis, the PAs Huerquehue and Nahuelbuta were excluded because reported species lists were only partial and they could thus bias the estimation. Total representativeness was then estimated for all 96 continental PAs of the SNASPE.
At least 20 samples are needed for construction of the accumulation curves (Gotelli & Colwell Reference Gotelli, Colwell, Magurran and McGill2011); this number was almost doubled in our study. Previous studies warn against extrapolating more than three times the empirical sample size (Colwell et al. Reference Colwell, Chao, Gotelli, Lin, Mao, Chazdon and Longino2012), a suggestion that was also respected in this study.
Surrogacy effectiveness
Correlation and rarefaction curve analyses were carried out to test the relationship between vegetation types and species representativeness inside the SNASPE. Four comparisons were conducted for these analyses: (i) number of vegetation types vs. species richness, (ii) diversity of vegetation types vs. species richness, (iii) complementarity of vegetation types vs. species complementarity, and (iv) behaviour of cumulative curves for vegetation types vs. species.
To account for vegetation and floristic variability, the country was divided into three areas for comparisons (i) and (ii). Areas were based on the main bioclimatic units of the country (Luebert & Pliscoff Reference Luebert and Pliscoff2006). The northern part of the country encompasses three administrative regions (XV–I to III) and corresponds to the tropical bioclimate, the central part encompasses six regions (IV to VIII) and corresponds to the Mediterranean bioclimate, and the southern part encompasses the last four regions (IX to XII) corresponding to temperate and antiboreal bioclimates (Fig. 1 b).
Diversity of vegetation types in comparison (ii) was calculated using the Shannon index (Maurer & McGill Reference Maurer, McGill, Magurran and McGill2011). Complementarity in comparison (iii) was calculated as the complement of the Jaccard dissimilarity index (Jost et al. Reference Jost, Chao, Chazdon, Magurran and McGill2011). Rarefaction curve for vegetation types in comparison (iv) was based on Pliscoff & Fuentes-Castillo (Reference Pliscoff and Fuentes-Castillo2011), conducted with no extrapolation (since the information is available for the whole territory), and compared with the rarefaction curve previously obtained for species. To make this comparison, both curves were formulated considering percentages of representativeness of species and vegetation types with respect to their national total.
RESULTS
Floristic database
We found 54 publications containing over 8000 plant species presence records in 40 PAs (42%; Table S1). No information was found for the remaining 58% of PAs (Table S2). Among the PAs that had information, 72.5% had only one floristic publication available, whereas only two (5.0%) had four publications each (Fig. S1). No latitudinal bias was observed in the percentage of available information, averaging 45% of information available (SD=17%) for the PAs per region, reflecting the spatial homogeneity in the sampling of the PAs (Fig. S2).
Floristic representativeness of the SNASPE
Based on the available floristic information of 40 PAs, at least 2091 native plant species are currently represented in the SNASPE (Table S3), equivalent to 47.8% of the native flora of the country. Correlation between regional representativeness and the proportion of PAs with information per region is weak (rho=0.5249, p = 0.0655), suggesting that there is no effect of the information availability on the latitudinal representativeness pattern.
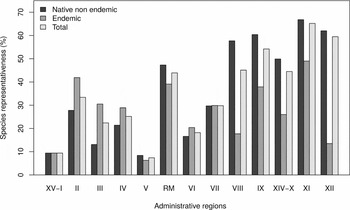
Protected species, mainly non-endemic natives, are concentrated in the southern area of the country from Biobío Region (VIII, 36–38°S) to the south. The largest number of endemic species is represented in the north-central area of the country. Regional representativeness of endemic species is generally lower than it is for non-endemic native species, although in Antofagasta, Atacama and Coquimbo regions (II, III and IV, respectively, ~21–32°S) and O'Higgins region (VI, ~34–35°S) endemic species are better represented (Fig. 2).
Chart of regional representativeness of the National System of Protected Areas (%), distinguishing non-endemic native and endemic species. Administrative region codes are listed from north to south.

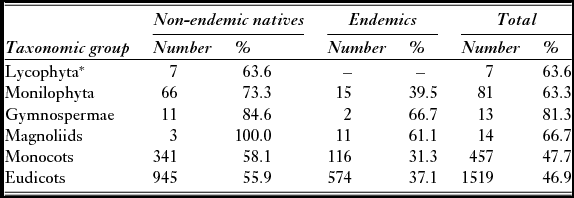
Representativeness by taxonomic group varies between 81.3% (gymnosperms) and 46.9% (eudicots). Representativeness of endemic species follows the same pattern, and these endemic species are less well represented than non-endemic natives in all groups (Table 1 and Fig. S3). The size of the species gap between these groups varies widely, from 1229 (64%) endemic species of monocots and eudicots not represented in the PAs, to just 31 (53%) endemic monilophytes, gymnosperms and magnoliids without representation in the system.
Numbers and percentages of representativeness according to taxonomic group. *Lycophyta is the only group with no endemic species in Chile.

The proportion of endemic species in an administrative region was positively correlated with the proportion of gap species present (rho=0.6264, p = 0.01263).
Projected floristic representativeness of the SNASPE
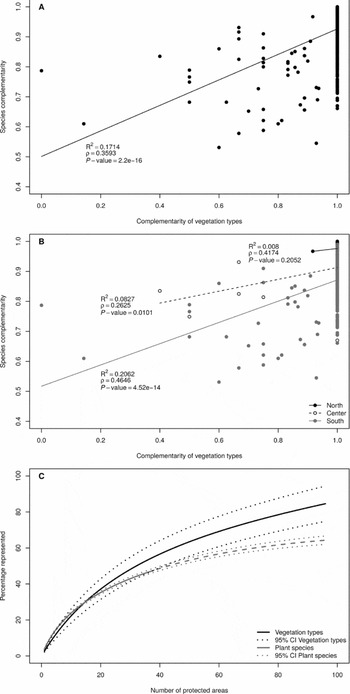
Projected representativeness of the SNASPE for the 96 PAs in continental Chile was 2794 species, equivalent to 64% of the vascular native flora of Chile (95% confidence intervals 62–66%; Fig. 3 c).
(a) and (b) Complementarity of species represented against complementarity of vegetation types. (a) National level analysis and (b) bioclimatic zone level analysis. (c) Rarefaction curve of the increment in representativeness of species and vegetation types with respect to the number of protected areas in the National System of Protected Areas. Dashed line is the extrapolation of plant species representativeness.

Surrogacy effectiveness
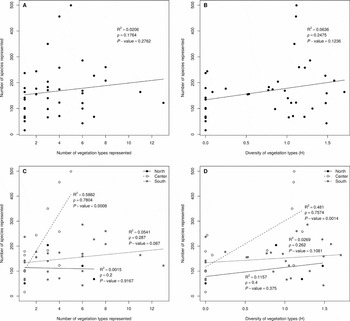
There was no correlation between species richness and vegetation types in terms of numbers (Fig. 4 a) or diversity (Fig. 4 b) at a national level. When the country was divided into three bioclimatic units, a positive correlation was only observed in the central zone of the country (Figs 4 c and 4 d).
Numbers of species represented against number or diversity of vegetation types. (a) and (b) are national level analyses, and (c) and (d) are analyses at the level of bioclimatic zones.

Complementarity of species and vegetation types between PAs were positively but weakly correlated (Spearman rho=0.3593, p<2.2e-16; Mantel test r=0.4141, p = 9.999e-05; Fig. 3 a). When the country was divided into three bioclimatic units, a positive but weak correlation was observed in the south and central zones of the country (Fig. 3 b).
Rarefaction showed a gap between vegetation types and species representativeness. While vegetation type representativeness was about 85% at national level, species representativeness was about 64% of national native flora (Fig. 3 c).
Size of PAs was correlated positively with number of vegetation types protected in each PA (rho=0.7986, p = 6.634e-10; Fig. S4). However, no correlation was found between PA size and the number of species protected in each PA (rho=0.077, p = 0.6367; Fig. S5).
Percentage of regional area protected was positively correlated with the percentage of regional protected species (rho=0.7363, p = 0.005789) and vegetation types (rho=0.8516, p = 0.0002; Fig. S6); however, the species correlation analysis is significantly positive for native non-endemics (rho=0.6978, p = 0.01033) and no correlation was found for endemic species (rho=0.0769, p = 0.8065), suggesting that endemic species are more difficult to represent, probably because of their narrow distributions.
DISCUSSION
Available floristic studies and observed representativeness patterns
Given that the true richness of an area is unknown, it is impossible to be certain if all species have been collected from it (Magurran Reference Magurran2004; Gotelli & Colwell Reference Gotelli, Colwell, Magurran and McGill2011). Rare species that had not been previously collected may be found. Their numbers can vary depending on the characteristics of each area as well as the previous sampling effort; the increment in richness decreases as the sampling effort increases. In the PAs of Llullaillaco, Fray Jorge and Torres del Paine for example, richness of native species increased an average of 37% between the first and the most recent sampling, showing differences in the magnitude of these changes according to the floristic region for each area (Fig. S7). This increase in richness is predictable for any of the areas in the study with lower sampling effort; current observed species richness in the PAs is underestimated. Nevertheless, the influence of an increase in PA richness over global representativeness is neither direct nor proportional.
Another factor that influences representativeness is the number of floristic studies of PAs. The correlation between regional representativeness and the availability of floristic studies suggested that the national pattern of representativeness is not an artifact of regional variation in the amount of information available. However, the analysis does not rule out an underestimation of representativeness, as could be the case for the regions of Arica y Parinacota/Tarapacá (XV–I), Valparaíso (V) and O'Higgins (VI) that have a single sampled PA. The increase in regional richness should be much higher in such situations, and smaller with a larger sample. All other regions have at least two PAs sampled that generally represent about 50% of the regional number of PAs.
Geographic richness inside the SNASPE of both native and endemic flora is consistent with the patterns described by Bannister et al. (Reference Bannister, Vidal, Teneb and Sandoval2011) and Zuloaga et al. (Reference Zuloaga, Morrone and Belgrano2008) for the vascular flora of Chile, suggesting the SNASPE protects the diversity of the country in a relatively uniform fashion. However, the area between Biobío (VIII) and Magallanes (XII) has a greater representativeness of the flora compared to the rest of the country, with the exception of the Metropolitan region (RM) in central Chile, which shows a level of representativeness similar to some regions in the south. Even if accounting for the above mentioned undersampled regions, we would not expect a change in this trend with increased sampling, given the smaller number of PAs compared to the south.
Particularly relevant from a conservation standpoint is the lower representation of the endemic component compared to the native non-endemic component. It is likely that this is due to the narrower distributions of the endemic species of the country, compared to native non-endemic species, which are easier to capture than the endemics, both when sampling by area as well as in the SNASPE itself. In the worldwide distribution of vertebrates, the national proportion of endemic species is strongly related to the proportion of gap species in the network of PAs, even more so than to the proportion of the territory covered by those PAs (Rodrigues et al. Reference Rodrigues, Andelman, Bakarr, Boitani, Brooks, Cowling, Fishpool, da Fonseca, Gaston, Hoffmann, Long, Marquet, Pilgrim, Pressey, Schipper, Sechrest, Stuart, Underhill, Waller, Watts and Yan2004). Our analysis shows a similar pattern in Chile.
Projected representativeness
According to the projected representativeness, the SNASPE would protect 62–66% of the vascular flora of Chile; however, there is no reference parameter to evaluate the efficiency of the system of PAs with respect to expected representativeness. Representativeness of vertebrates in the global network of PAs is 87.8%; for plants a lower representativeness is expected, given their higher levels of endemism and/or higher frequency of species with reduced distributions (Rodrigues et al. Reference Rodrigues, Andelman, Bakarr, Boitani, Brooks, Cowling, Fishpool, da Fonseca, Gaston, Hoffmann, Long, Marquet, Pilgrim, Pressey, Schipper, Sechrest, Stuart, Underhill, Waller, Watts and Yan2004). This also holds for Chile. In Chilean vertebrates the representativeness in PAs is 86.5% (Tognelli et al. Reference Tognelli, Ramirez de Arellano and Marquet2008).
Considering that both the size of the PAs with available information (µ=230 896 ha, SD=658 059 ha, range=86–3 906 130 ha) as well as their richness (µ=171, SD=102, range=16–618) were variable, an additional consideration when interpreting these analyses is the difference in area of the sampling units. Although species richness depends on the size of the study area (Rosenzweig Reference Rosenzweig1995), in our approach all PAs were treated in a uniform manner regardless of their area. Previous studies do not recommend a direct correction of richness data by sampling area or any other measure of effort because it erroneously assumes a linear relationship (Gotelli & Colwell Reference Gotelli, Colwell, Magurran and McGill2011). Sample-based species accumulation curves and their extrapolation require no assumptions about homogeneity among samples in the known dataset (Colwell et al. Reference Colwell, Mao and Chang2004; Reference Colwell, Chao, Gotelli, Lin, Mao, Chazdon and Longino2012). Samples (PAs in this case) are accumulated, mathematically, in random order, averaging differences among them in area or richness. However, extrapolation beyond the known dataset (the 40 PAs with sufficient data in this study) assumes that these PAs are representative, in terms of richness, of the 54 PAs that were not included for lack of data. We consider this to be a good assumption, since sampling size is extensive, geographically distributed and homogeneous across regions.
Surrogacy effectiveness
Many studies have investigated the effectiveness of different types of surrogates (Araújo et al. Reference Araújo, Humphries, Densham, Lampinen, Hagemeijer, Mitchell-Jones and Gasc2001; Lombard et al. Reference Lombard, Cowling, Pressey and Rebelo2003; Lawler & White Reference Lawler and White2008), but there is no consensus in favour of any specific surrogate. Some meta analyses show that effectiveness is site and taxon specific, and varies widely depending on the methods chosen (Rodrigues & Brooks Reference Rodrigues and Brooks2007; Grantham et al. Reference Grantham, Pressey, Wells and Beattie2010; Lewandowski et al. Reference Lewandowski, Noss and Parsons2010). One important issue to consider is that surrogates are not tested with respect to overall biodiversity, so the evaluation is only with respect to a specific target. Therefore, the resulting effectiveness is a specific relationship between the variables (Rodrigues & Brooks Reference Rodrigues and Brooks2007).
Our analyses did not find a correlation between representativeness of vegetation types and the number of species represented, suggesting that richness of vegetation types is not a good surrogate for species richness at a national level. Even though there was a positive correlation between PA size and number of vegetation types protected, we did not see a correlation between PA size and species richness protected. A possible bias is the fact that the larger PAs in Chile are located in areas with lower overall plant diversity (i.e. the southern portion of the country; Bannister et al. Reference Bannister, Vidal, Teneb and Sandoval2011; Pliscoff & Fuentes-Castillo Reference Pliscoff and Fuentes-Castillo2011). When analyzing the patterns observed for the country divided into three bioclimatic units, we did see a positive correlation between number of vegetation types and species protected (Fig. 4), as well as for the size of PAs vs. species richness (rho=0.5549, p = 0.02627) in central Chile, whereas no correlation was seen in the northern or southern parts of the country. Because the area protected in central Chile is smaller than in the northern and southern parts of the country (Pliscoff & Fuentes-Castillo Reference Pliscoff and Fuentes-Castillo2011), but species richness is higher (Bannister et al. Reference Bannister, Vidal, Teneb and Sandoval2011), one explanation for the observed pattern is that adding protection in terms of area or vegetation types to a richer and less protected zone will have a higher marginal contribution to species protection than if the same is done in a zone with lower richness, where the slope of the species–area relationship for vascular plants is smaller (Qian et al. Reference Qian, Fridley and Palmer2007).
The complementarity analyses showing a positive but weak correlation between complementarity of vegetation types and of species means that in Chile, areas with more diversity of vegetation types are not necessarily more species-rich, but areas that complement each other in terms of vegetation types, could also be complementary in terms of the species they contain.
Accumulation curves seem to perform better when evaluating the effectiveness of a surrogate compared to correlation analyses (Ferrier & Watson Reference Ferrier and Watson1997; Rodrigues & Brooks Reference Rodrigues and Brooks2007). Our comparison species vs. vegetation accumulation curves shows a gap between the representativeness of both and a difference in the shape of the curves. At the end of the curves, the slope of the species curve is smaller than for vegetation types, indicating that ecosystem representativeness would increase more than species representativeness with each additional PA (Fig. 3 b). Therefore, if Chile does not change its criteria in terms of planning for new PAs, it is highly likely that representativeness of vegetation types will keep increasing without a significant increase in floral species representativeness. Species with restricted distributions and special environmental needs are more likely missed than other species when surrogates are based on ecological classifications (Grantham et al. Reference Grantham, Pressey, Wells and Beattie2010), stressing the importance of narrow endemics when considering the gap of vegetation types vs. species curves.
Correlations among richness patterns have been widely used as a surrogacy approach (French Reference French1999; Moritz et al. Reference Moritz, Richardson, Ferrier, Monteith, Stanisic, Williams and Whiffin2001; Lewandowski et al. Reference Lewandowski, Noss and Parsons2010). The richest site selection method requires a strong correlation between the surrogate and the target, and our study found no correlation between the number of vegetation types and the number of species protected. However, it has been suggested that a complementarity approach may be more effective than a correlation of richness patterns (Lewandowski et al. Reference Lewandowski, Noss and Parsons2010); correlations do not consider the identity of the units evaluated, while complementarity methods do. In addition, approaches based on complementarity are more consistent with ecological theory, in particular when the species composition gradient is strong, generally associated with large scale analyses (Saetersdal & Gjerde Reference Saetersdal and Gjerde2011), and are more efficient in identifying PA networks representing biodiversity features (Rodrigues & Brooks Reference Rodrigues and Brooks2007).
Vegetation units may be a better surrogate for flora than they are for other taxonomic groups (Ferrier & Watson Reference Ferrier and Watson1997), however, such studies depend on the study area and the target taxon (Ferrier & Watson Reference Ferrier and Watson1997; Grantham et al. Reference Grantham, Pressey, Wells and Beattie2010); specific analyses on the efficiency of vegetation types as surrogates for a more ample range of target taxa are needed. This would be the only way to obtain a complete overview of the target taxa that needs to be considered independently. It has been suggested that cross-taxon surrogates perform better than environmental surrogates (Rodrigues & Brooks Reference Rodrigues and Brooks2007; but also see Grantham et al. Reference Grantham, Pressey, Wells and Beattie2010). We cannot thus discard the idea of planning according to these kinds of surrogates, which need to be evaluated and could yield better results.
Recent studies suggest the importance of the geographic regions considered. In fact, differences in the effectiveness of surrogates were observed within New South Wales (Australia) when dividing the region between upper and lower northeast areas (Grantham et al. Reference Grantham, Pressey, Wells and Beattie2010). Another study points to the importance of the biome for the effectiveness of cross-taxon surrogates (Lewandowski et al. Reference Lewandowski, Noss and Parsons2010). When dividing the country into three bioclimatic units, a pattern emerged in one unit that was not observed at a national scale, which is contrary to the idea that surrogate effectiveness is better on a larger scale (Lewandowski et al. Reference Lewandowski, Noss and Parsons2010).
In conclusion, considering the results of this and previous studies, we suggest evaluating the local effectiveness of any biodiversity feature that might be used as a surrogate for conservation planning. When effectiveness cannot be corroborated, we recommend incorporating species representativeness as an additional criterion for creating new protected areas.
ACKNOWLEDGEMENTS
The authors thank Robert K. Colwell and three anonymous reviewers for their useful suggestions. The authors are also grateful to Diego Parra, Bryan Casanova, José Miguel Valdés and Víctor Flores for help in building the database; María Teresa Serra, Luis Faúndez and Nicolás García for help in species name allocation; Álvaro Promis for help in finding financing for part of the study; and Andrés Moreira-Muñoz and Vanezza Morales for making available the current information on localities for Asteraceae.
Supplementary Material
To view supplementary material for this article, please visit http://dx.doi.org/10.1017/S0376892916000060