


Introduction
Global diversity is assembled from local diversity plus beta (or turnover) diversity that arises at a wide range of scales (Lande Reference Lande1996; Holland Reference Holland2010). For example, local variation contributes to within-habitat diversity, variation among habitats contributes to landscape-scale diversity, and so on. Several lines of evidence suggest that provincial-scale turnover is the principal cause of changes in global marine diversity through the Phanerozoic (Valentine et al. Reference Valentine, Foin and Peart1978; Holland Reference Holland2010). Although provinces tend to be treated as discrete, well-bounded units, in part because they are named entities, the definition of provinces and their boundaries has frequently been elusive (Adey and Steneck Reference Adey and Steneck2001), suggesting that provincial-scale variation may be more akin to gradients with locally elevated rates of turnover. There are modern ecological studies that show variation along gradients at multiple scales (Whittaker and Niering Reference Whittaker and Niering1965; Whittaker Reference Whittaker1967; Gosz Reference Gosz1992). This is similar to ecological communities, which also have been named and treated as discrete entities, despite numerous studies showing continuous change along environmental gradients (Whittaker Reference Whittaker1967; Patzkowsky and Holland Reference Patzkowsky and Holland2012). This similarity raises the question of whether continental-scale and larger biogeographic variations are likewise better understood as gradients rather than discrete, well-circumscribed entities. Because provinces are used to guide biotic conservation efforts (Spalding et al. Reference Spalding, Fox, Allen, Davidson, Ferdaña, Finlayson, Halpern, Jorge, Lombana, Lourie, Martin, McManus, Molnar, Recchia and Robertson2007) and as tools in paleobiogeographic studies (Sclafani and Holland Reference Sclafani and Holland2013), understanding whether the spatial organization of ecology better fits provinces or gradients is important.
Four provinces have been recognized in previous studies of Middle to Upper Ordovician rocks of Laurentia (Fig. 1), based on multiple taxonomic groups (Elias Reference Elias1982; Sweet and Bergström Reference Sweet and Bergström1984; Anstey Reference Anstey1986; Carrera and Rigby Reference Carrera and Rigby1999; Jin et al. Reference Jin, Harper, Rasmussen and Sheehan2012; Mohibullah et al. Reference Mohibullah, Williams, Vandenbroucke, Sabbe and Zalasiewicz2012). In addition, these provinces correspond to geochemical variations that suggest limited exchange of water masses between these provinces (Holmden et al. Reference Holmden, Creaser and Muehlenbachs1998; Panchuk et al. Reference Panchuk, Holmden and Leslie2006). Here, we test whether these Middle to Upper Ordovician provinces of Laurentia are distinct from one another or whether they are better described by one or more gradients.
Recognized provinces in the Late Ordovician of Laurentia, based primarily on the geochemically defined aquafacies of Holmden et al. (Reference Holmden, Creaser and Muehlenbachs1998) and the ichnofacies classification of Jin et al. (Reference Jin, Harper, Rasmussen and Sheehan2012).

Background
Ordovician Provinces of Laurentia
The geographic distribution of Early to Middle Ordovician conodonts suggests that Laurentia was characterized by a single continent-wide province (Zhen and Percival Reference Zhen and Percival2003). By the Middle to Late Ordovician, four provinces were present, based on studies of conodonts (Sweet and Bergström Reference Sweet and Bergström1984), ostracods (Mohibullah et al. Reference Mohibullah, Williams, Vandenbroucke, Sabbe and Zalasiewicz2012), bryozoans (Anstey Reference Anstey1986), corals (Elias Reference Elias1982), sponges (Carrera and Rigby Reference Carrera and Rigby1999), and trace fossils (Jin et al. Reference Jin, Harper, Rasmussen and Sheehan2012). The largest of these provinces is the Red River–Stony Mountain Province, which spans most of Canada and the western United States; for consistency with the naming of the other provinces, we will refer to this as the “Western Province” (Fig. 1). The upper midwestern United States is represented by the Midcontinent Province, with the Southern Province to the south of it. A narrow Appalachian Province includes the easternmost United States. These studies suggest slightly different placement of the boundaries of these provinces, and not all of these studies recognized all four provinces. These differences may partly reflect variation in sample coverage and resolution, but they also suggest that the boundaries of the provinces are not sharp.
The Western Province is considered a relatively homogenous carbonate platform environment, dominated by shallow-subtidal deposits characterized by bioclastic wackestone (Jin et al. Reference Jin, Harper, Rasmussen and Sheehan2012). In the Midcontinent and Southern provinces, shallow-subtidal deposits are characterized by carbonates containing significant amounts of siliciclastic mud, predominantly wavy-bedded skeletal grainstone, packstone, and shelly mudstone (Holland and Patzkowsky Reference Holland and Patzkowsky2007). In the Appalachian province, shallow-subtidal deposits range from thin-bedded to medium-bedded limestone, siltstone, and shale in the south to thickly bedded sandstone in the north (Bretsky Reference Bretsky1970).
The presence of these regional differences is also supported by geochemical evidence that indicates little mixing of water masses among these regions (Holmden et al. Reference Holmden, Creaser and Muehlenbachs1998; Panchuk et al. Reference Panchuk, Holmden and Leslie2006). Specifically, values of ε Nd from conodont apatite and of δ 13C of micrite from across eastern North America display relatively well-defined regions of little variation that correspond to the Midcontinent, Southern, and Appalachian provinces. Because ε Nd and δ 13C reflect the isotopic composition of marine waters, this spatial distribution supports the idea of well-bounded Late Ordovician provinces in Laurentia.
Environmental Change during the Late Ordovician on Laurentia
Throughout the Ordovician, Laurentia was situated in the tropics, with the northern portion of the continent straddling the equator (Scotese and McKerrow Reference Scotese and McKerrow1991). Despite this position, eastern Laurentia experienced cooler water temperatures, increased nutrient input, and increased siliciclastic input in the early part of the Late Ordovician (Holland and Patzkowsky Reference Holland and Patzkowsky1996, Reference Holland and Patzkowsky1997; Pope and Read Reference Pope and Read1997, Reference Pope and Read1998; Finnegan et al. Reference Finnegan, Bergmann, Eiler, Jones, Fike, Eiseman, Hughes, Tripati and Fischer2011). By the latter part of the Late Ordovician, but still prior to glaciation in the latest Ordovician, warm-water and nutrient-poor conditions returned to eastern Laurentia, although siliciclastic input remained high, owing to the Taconic orogeny on the southeast margin of Laurentia.
With the early Late Ordovician onset of cooler, nutrient-rich waters, many characteristic eastern Laurentian taxa disappeared from the Appalachian area, including the brachiopods Oepikina, Glyptorthis, and Leptaena, and solitary rugosan corals (Holland and Patzkowsky Reference Holland and Patzkowsky1996; Patzkowsky and Holland Reference Patzkowsky and Holland1996). Although some of this fauna became extinct, many elements contracted their ranges to what is now Canada and the western United States. This regional extinction and range contraction coincides with the division of Laurentia into four provinces. Some elements of this western fauna returned to eastern Laurentia as waters warmed and became more nutrient rich (Holland Reference Holland1997; Holland and Patzkowsky Reference Holland and Patzkowsky2007). This return, known as the Richmondian Invasion, encompasses many elements of the fauna including corals, brachiopods, mollusks, and trilobites (Holland Reference Holland1997).
The causes of cooling and warming are still debated. Cooler temperatures were originally attributed to regional cooling in response to upwelling triggered by basin deepening in the earliest part of the Taconic orogeny (Railsback et al. Reference Railsback, Ackerly, Anderson and Cisne1990; Holland and Patzkowsky Reference Holland and Patzkowsky1997). Cooling has also been ascribed to a drop in global ocean temperature at the onset of the Gondwanan glaciation (Pope and Read Reference Pope and Read1998), upwelling of cool water in the midcontinental Sebree Trough (Kolata et al. Reference Kolata, Huff and Bergström2001), and a combination of tectonic and climatic forcing (Ettensohn Reference Ettensohn2010).
The cause of increased siliciclastic input is more clearly attributable to the two phases of the Taconic orogeny (Holland and Patzkowsky Reference Holland and Patzkowsky1996) caused by the collision of a terrane on the southeastern margin of Laurentia. The first and lesser phase of siliciclastic input occurred during the Whiterockian phase (463 Ma), with the second and greater phase starting in the mid-Mohawkian (454 Ma) and continuing into the Silurian as the Queenston Delta prograded northwestward across the southeastern margin of Laurentia.
Methods
The overall goal of this study is to compare the similarity of Laurentian faunal assemblages to test whether these Late Ordovician provinces are distinct or if they are better described as one or more gradients. We do this by comparing provinces at the continental scale, across all of Laurentia (Fig. 1) and by comparing smaller-scale sampling regions (see “Regional Scale”) within the eastern United States (Fig. 2), where we have collected data at a finer spatial scale and with consistent methods. We measure similarity by comparing the most abundant taxa in each province or region and through quantified similarity using a Jaccard coefficient. At the regional scale, we also use ordination to characterize patterns of similarity among collections and regions.
Sample localities in the Southern Province (filled triangles: Cincinnati Arch; unfilled triangles: Nashville Dome) and the Appalachian Province (black circles). Appalachian collections are divided into subregions numbered 1–5 from south to north. Inset shows this map area (thick black box) of the eastern portion of Figure 1. Province boundaries are dashed lines. A: Appalachian Province; S: Southern Province; M: Midcontinent Province.

Continental Scale
Occurrence data for shallow-subtidal (i.e., above normal wave base) collections from the Ordovician of North America were downloaded from the Paleobiology Database, along with age and geographic information (Paleobiology Database 2013; Supplementary Appendix 1). Occurrence data were also downloaded for shallow-subtidal collections from the Upper Ordovician of the United Kingdom (Avalonia) as a reference for intercontinental levels of faunal similarity. Collections of occurrences were sorted into Early, Middle, and Late Ordovician based on epoch, stage, or million-year bin where given. The Early Ordovician includes the Stairsian, Tremadocian, Tulean, and Blackhillsian stages and Paleobiology Database 10 Myr bins Ordovician 1 and some of Ordovician 2. The Middle Ordovician includes the Rangerian, Chazyan, Darwillian, and Whiterockian stages and bins Ordovician 2 and 3. The Late Ordovician includes the Blackriveran, Turinian, Chatfieldian, Maysvillian, Ashgill, Richmondian, Gamachian, and Hirnantian stages plus bins Ordovician 4 and 5. Where age fields were empty, incorrect, or ambiguous, member and formation information was used to resolve the age of the collection with reference to correlation charts (Ross et al. Reference Ross and Bergström1982), and the U.S. Geologic Names Lexicon (Geolex, U.S. Geological Survey 2012). Collections that could not be assigned to one of the three time intervals were excluded from analysis. Data from Bretsky (Reference Bretsky1970) were used to supplement the Paleobiology Database data for the Late Ordovician of the Appalachian Province (Table 3).
Based on their geographic coordinates, collections were assigned to one of the four Late Ordovician provinces in ArcGIS by digitizing the province boundaries of Holmden et al. (Reference Holmden, Creaser and Muehlenbachs1998) and Jin et al. (Reference Jin, Harper, Rasmussen and Sheehan2012).
Occurrence data were corrected in several ways before analysis. Collections with no environmental information or contradictory environmental information were removed. Collections associated with the Dalvé (Reference Dalvé1948) compendium of fossils from the Cincinnati Arch were removed, because these were considered uniquely comprehensive and therefore incomparable with collections from every other region. Occurrences of “Lingula” were replaced with “lingulid” to standardize the treatment of linguliform brachiopods during this interval. Occurrences of Schizambon (a Devonian genus), camerates (poorly resolved), and Skolithos (a trace fossil) were removed. Spelling errors of genera were corrected.
Similarity among provinces across Laurentia was measured with the Jaccard (Reference Jaccard1912) coefficient of similarity. Within each time interval, occurrence data from all collections within each province were combined to create a single presence–absence compilation for each province. These aggregated province-scale collections were compared with one another within the same time interval using Jaccard’s coefficient of similarity, computed with vegdist() in the vegan package of R (R Core Team 2012). Vegdist gives the Jaccard dissimilarity between collections, so this result was subtracted from 1 to express faunal similarity from 0 (no common genera) to 1 (identical). In the Late Ordovician, each province was also compared with the data from the United Kingdom to establish the level of similarity typical of provinces developed across deep ocean basins. If these regions are distinct, unrelated provinces, then Jaccard similarity values between regions should be low, possibly as low as the similarity values between these regions and the outgroup. If there is an underlying gradient driving community composition, there should be a systematic trend in similarity (e.g., a spatial trend with the lowest Jaccard similarity for opposite ends of the gradient, with moderate similarity values over shorter distances).
Regional Scale
Faunal count data were obtained to compare similarity patterns at the regional scale, specifically across the shared border of the Southern and Appalachian provinces in the eastern United States during the Late Ordovician. Collections from the shallow-subtidal deposits of the C1 and C2 sequences (Holland and Patzkowsky Reference Holland and Patzkowsky1996) of the Southern Province in the Cincinnati Arch and Nashville Dome were obtained from previous studies (Patzkowsky and Holland Reference Patzkowsky and Holland1999; Holland and Patzkowsky Reference Holland and Patzkowsky2007; Supplementary Appendix 2). New faunal samples were collected from the shallow-subtidal of the C1 and C2 sequences from five regions in the Appalachian Province (Fig. 2; Supplementary Appendices 3 and 4), following the same protocol used in the data sets from the Cincinnati Arch and Nashville Dome.
Within each region of the Appalachian Province, localities were chosen on multiple thrust sheets in the Valley and Ridge to provide broad geographic coverage. At each locality, samples were collected from the Reedsville and Martinsburg formations (Fig. 3). The shallow-subtidal facies was identified in the field based on massively bedded or highly bioturbated sandstones, or bioturbated interbedded fossiliferous packstone and mudstone. To minimize facies variation, sampling targeted the stratigraphically highest shallow-subtidal packages below the transition to peritidal or terrestrial facies, particularly the overlying Juniata Formation (Bretsky Reference Bretsky1970). Sampling was restricted to the shallow-subtidal facies to remove water depth as a confounding variable in the study and because the shallow-subtidal environment is the most consistently available facies preserved in each of the regions in this study. Offshore facies are absent in the Western Province and rarely available in the Southern Province, and the deep subtidal is rarely available in the Western Province (Holland and Patzkowsky Reference Holland and Patzkowsky1996, Reference Holland and Patzkowsky1997, Reference Holland and Patzkowsky2012).
Stratigraphic distribution of samples. All samples were collected from the shallow-subtidal facies (see Patzkowsky and Holland Reference Patzkowsky and Holland1999; Holland and Patzkowsky Reference Holland and Patzkowsky2007).

Each bulk rock sample was roughly the size of one or two gallon-sized bags, with larger samples taken from beds where fossil material was scarce to ensure sufficient sample size for statistical analysis (at least two dozen identifiable individuals). Each sample was constrained to a bedding plane as much as possible, and 2–4 replicate samples were taken, one each from a different bed of the same facies at each locality. In the lab, every visible fossil in these samples was identified to the genus level when possible, such that whole-fauna abundance counts were made for each sample. Unless obvious diagnostic features were readily visible, bryozoans were identified by morphological groups: thin ramose, thick ramose, thin bifoliate, thick bifoliate, encrusting, and massive trepostome following Holland and Patzkowsky (Reference Holland and Patzkowsky2007).
Samples containing only a single taxon or fewer than two dozen individuals were excluded from the study. In total, 36 samples were collected from 13 localities in the Appalachians. These were compared with 49 samples obtained from 11 localities on the Cincinnati Arch and 13 samples obtained from 8 localities on the Nashville Dome.
Analyses for the regional-scale study of similarity in the eastern United States were conducted with both presence–absence and relative-abundance data, allowing comparison of the two approaches. Collections from every combination of two regions from the two Southern Province (Nashville Dome and Cincinnati Arch) and the five Appalachian Province regions were compared using both presence–absence and relative abundance (Supplementary Appendix 5). Every pairwise comparison of collections from two regions was compared to make a distance matrix. The Jaccard coefficient was used for presence–absence data, and the quantified Jaccard coefficient (Chao et al. Reference Chao, Chazdon, Colwell and Shenn2005) was used for relative-abundance data. These dissimilarities were subtracted from 1 to make similarity coefficients, and a logit transformation (Ashton Reference Ashton1972) was applied to the matrices to account for these values being bounded by 0 and 1. Values of 0 and 1 were incremented by 0.0001 to avoid values of infinity in the logit transformation and to prevent overlap with values close to 0 or 1.
Student’s t-tests were used to determine the mean Jaccard coefficient and its 95% confidence interval. These values were back-transformed from the logit scale using the inverse-logit function (boot package of R). To quantify the relationship between similarity and geographic distance, the similarity of each pairwise comparison of regions was plotted against the great-circle distance (shortest distance along surface of Earth) between the geographic centroids of the two regions, that is, the mean geographic coordinates of all sample localities from a region. Geographically closer collections would be expected to have greater similarity than more distant collections, based on spatial autocorrelation. If distance is the primary driving factor of similarity between collections, then distance should account for a large proportion of the variability in similarity between collections (large R 2).
A nonmetric multidimensional scaling (NMDS) ordination was applied to the data to assess spatial trends in the faunal composition of samples. This ordination is based on the relative-abundance data from all of the collections, and results are shown later coded by region. This NMDS was calculated using metaMDS() in the vegan package in R, which provides taxon scores as well as collection scores. A scree plot was generated to determine that three axes should be used in the ordination to maximize simplicity and reduction in stress of the ordination (R code available in Dryad Digital Repository doi:10.5061/dryad.3bs4j). If distinct provinces are present, ordination scores of regions should not overlap with scores from other regions. If provinces are internally homogeneous, ordination scores within a region should not change systematically across the region (e.g., Appalachian scores should not decrease from north to south). If regional faunal variations are better described by gradients than distinct provinces, ordination scores should show overlap among regions and systematic changes within regions (e.g., Appalachian sample scores might decrease from north to south).
Multivariate tests of difference were not used to detect whether the assemblages in various regions were different or not for two reasons. First, even if there is a gradient, opposite ends of this gradient may be statistically distinct. Second, these types of significance tests address the narrow question of “Is the difference statistically nonzero?” rather than conveying the magnitude and description of the difference. Rejecting a “zero-difference” null hypothesis is largely a matter of sample size. In other words, no two areas are identical (there is some nonzero effect size), so determining significance is only a matter of having a sample size large enough to detect the effect size that is present. Rather than perform these tests, the emphasis in this study is on effect size and a characterization of the pattern.
Results
Continental Scale
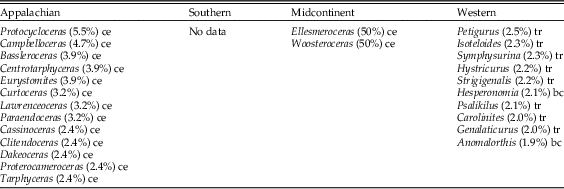
Magnitude and spatial patterns of similarity support provinces and gradients that change through the Ordovician (Fig. 4; Supplementary Appendix 5). A few abundant taxa characterize each province (Tables 1–3), and differences in these taxa lead to low values of similarity (0.051–0.25) among the provinces through the entire Ordovician. Jaccard similarity displays a spatial pattern among the provinces, with decreasing similarity coefficients between the Appalachian Province and the rest of Laurentia by the Late Ordovician, while similarity coefficients between the other regions remain intermediate (0.14–0.228).
Jaccard similarity values for each combination of provinces in the Early, Middle, and Late Ordovician. Letters designate the pair of provinces each data point represents. Open circles indicate comparisons of a Laurentian province with the outgroup, the United Kingdom. Black line segments show the progression of each comparison through time; positive slopes correspond to increased similarity and a negative slopes correspond to decreased similarity. Gray line segments are 95% confidence intervals determined using jackknife resampling.

Most abundant taxa in each province on Laurentia from the Lower Ordovician, with percent occurrence, based on data from the Paleobiology Database. bc: brachiopod; ce: cephalopod; tr: trilobite.
Most abundant taxa in each province on Laurentia from the Middle Ordovician, with percent occurrence, based on data from the Paleobiology Database. a: alga; bc: brachiopod; bz: bryozoan; co: coral; g: gastropod; o: ostracod; st: stromatoporoid; tr: trilobite.

Most abundant taxa in each province on Laurentia from the Upper Ordovician, with percent occurrence, based on data from the Paleobiology Database. a: alga; bc: brachiopod; bz: bryozoan; bv: bivalve; ce: cephalopod; co: coral; g: gastropod; li: lingulid; tr: trilobite.

Data are sparse in the Early Ordovician, making spatial comparisons difficult to assess. Where data exist, the patterns fit what is typical of the rest of the Ordovician (Fig. 4, Table 1). For example, taxonomic compositions of the Appalachian and Western provinces are dissimilar (0.055) (Fig. 4), with cephalopods dominating the Appalachian Province and trilobites dominating the Western Province (Table 1). This difference may be a monographic effect in that Early Ordovician data for the Midcontinent Province are absent, and only one collection exists in the Southern Province, and it is dominated by cephalopods.
In the Middle Ordovician, Laurentian provinces begin to show spatial patterns suggestive of a gradient, while remaining compositionally distinct (Fig. 4, Table 2). The Appalachian Province is represented overwhelmingly by bryozoans, and the Southern Province is characterized primarily by brachiopods, but bryozoans, gastropods, and trilobites are also common (Table 2). The Midcontinent Province has a similar makeup to the Southern Province at a higher taxonomic level, but without common bryozoans. The Western Province in the Middle Ordovician is dominated by trilobites, with less abundant brachiopods and ostracods. The Western Province is the least similar to other Laurentian provinces (0.089–0.107). The Southern and Midcontinent provinces are the most similar, and they are also the most similar of any pair of provinces in any time interval (0.25). Similarity values between the Appalachian and Midcontinent provinces (0.157), and between the Appalachian and Southern provinces (0.144) are intermediate.
Spatial patterns in similarity are well established by the Late Ordovician (Fig. 4, Table 3). The Appalachian Province becomes the most distinctive, with the lowest Jaccard similarity of all the provinces, while Jaccard similarity values between the Western and Midcontinent provinces remain intermediate, as do the Jaccard similarity values between the Western and Southern provinces. The Appalachian Province is characterized primarily by its bivalves and brachiopods (Table 3). Brachiopod genera are the most represented genera in the Southern Province, while bryozoans dominate the Midcontinent Province. The Western Province is dominated by coral genera, while trilobite genera no longer rank among the 10 most reported genera in the Western Province. In the Late Ordovician, the Appalachian and Western provinces have the lowest Jaccard similarity (0.051), which is the lowest value seen throughout this study. This Jaccard similarity value is comparable to those between the United Kingdom outgroup and all of the Laurentian provinces (0.036–0.056). The Southern and Midcontinent provinces retain the highest Jaccard similarity (0.228). In the Late Ordovician, the Appalachian Province has its highest Jaccard similarity with the Southern Province, which has its highest Jaccard similarity with the Midcontinent Province, which in turn has its the highest similarity with the Western Province (Fig. 4).
Regional Scale
Regional-scale results also indicate a gradational pattern in Jaccard similarity coefficients (Fig. 5). This pattern is evident in the taxa that characterize each region (Table 4), the Jaccard similarity scores between regions (Fig. 5; Supplementary Appendix 5), and in ordination (Fig. 6). Similarity between regions is related to distance, but distance alone does not account for all of the variation in Jaccard similarity (Fig. 8).
Jaccard similarity values for pairwise comparisons among collections in subregions. Within-Appalachian comparisons are shown with black circles. Appalachian vs. Cincinnati comparisons are filled triangles, Appalachian vs. Nashville comparisons are unfilled triangles. Numbers correspond to comparisons with Appalachian subregions. Bars represent the 95% confidence intervals. A decrease in similarity from north to south among comparisons between Appalachian Province and Southern Province collections is apparent for both types of data.

Ordination of collections in the regional-scale study. Southern Province collections (C, N) exhibit lower NMDS axis 1 scores than Appalachian (numbered) collections. NMDS axis 1 scores become more positive to the north within the Appalachian regions. Collections from Nashville (N) have lower NMDS axis 2 scores than Cincinnati collections (C).

Most abundant Laurentian taxa from the Cincinnati Arch, Nashville Dome, and five regions in the Appalachian Basin, based on field counts. a: alga; bc: brachiopod; bz: bryozoan; bv: bivalve; ce: cephalopod; co: coral; g: gastropod; li: lingulid; tr: trilobite.

Abundances among genera and higher taxa show systematic spatial trends at the regional scale (Table 4). Bryozoans, especially ramose bryozoans, tend to be well represented among all regions except the northernmost Appalachian Province. Articulate brachiopods are more abundant and diverse in the Cincinnati Arch and Nashville Dome collections and become less abundant and less diverse northward in the Appalachian regions. For example, Appalachian region 1 contains five genera of articulate brachiopods, while Appalachian region 5 contains only two brachiopod genera. Gastropods are present in the Southern Province but are not among the most abundant genera. Gastropods are more abundant and more diverse in the Appalachian collections, particularly in the northernmost Appalachian region 5, where there are four genera of gastropods, and two of these are the most abundant genera. Bivalves are present in the Nashville and Cincinnati collections but are also not among the most abundant taxa. Bivalves are increasingly well represented from south to north in the Appalachian regions.
Among Appalachian collections, the northernmost and southernmost collections have the lowest Jaccard similarity coefficient. Southern Province collections have their greatest Jaccard similarity with the southernmost Appalachian collections, and these similarity values with the Southern Province decrease northward through the Appalachian Province. Appalachian collections have higher Jaccard similarity with collections from the Cincinnati Arch than with collections from the Nashville Dome.
Jaccard similarity of presence–absence data and quantified Jaccard similarity of relative-abundance data show similar patterns (Fig. 5). Both measures indicate a south-to-north decline in similarity between the Appalachians and both Southern Province regions. Both measures show that Nashville collections have lower similarity with Appalachian collections than with Cincinnati collections, and Nashville collections have lower similarity to Appalachian collections than Cincinnati collections do to Appalachian collections. Among the Appalachian collections, both measures show the same trend of adjacent regions having higher similarity, while regions that are farther apart have lower similarity.
Jaccard similarities are generally larger than quantified Jaccard similarities (0.021–0.336 vs. 0.010–0.256; Fig. 5). In addition, Jaccard similarities have a greater range than the quantified Jaccard similarities (0.315 vs. 0.246). Furthermore, the 95% confidence interval on Jaccard similarity is 1.08–2.52 times greater than that of the quantified Jaccard, except for Appalachian region 1 versus the Cincinnati collections, for which the confidence intervals are nearly the same (Fig. 5).
Ordination of the collections in the regional study indicates a gradational spatial pattern in faunal composition among Southern and Appalachian collections. This is manifested along NMDS axis 1 (Fig. 6) and is therefore the most important source of variation in the taxonomic composition of collections in this data set. NMDS axis 1 scores increase from Nashville and Cincinnati collections to southern Appalachian collections to northern Appalachian collections. Overlap among Appalachian collections and Southern Province collections suggest that the boundary between these regions is gradational.
Appalachian collections are closer in NMDS axis 1 and NMDS axis 2 scores to Cincinnati collections than Nashville collections, except for two Nashville collections with anomalously high NMDS axis 1 scores (Fig. 6). These two collections are unusually rich in the rhynchonellid brachiopod Orthorhynchula, which is more characteristic of northern Appalachian collections (Bretsky Reference Bretsky1970). NMDS scores of taxa (Fig. 7) show that taxa that typically prefer siliciclastic substrates, such as bivalves and gastropods (Bretsky Reference Bretsky1970), score higher on NMDS axis 1 than taxa that are generally associated with carbonate substrates, such as most bryozoans and the brachiopods Vinlandostrophia and Hebertella.
Taxon scores from the regional-scale ordination. The rhynchonellid brachiopod Orthorhynchula, gastropods, and bivalves typical of sandier substrates and the northern Appalachian collections (Bretsky Reference Bretsky1970) have the most positive NMDS axis 1 scores.

Cincinnati collections have larger NMDS axis 2 scores than Nashville collections, but Cincinnati collections and Appalachian collections overlap considerably in their NMDS axis 2 scores (Fig. 6). There is little overlap on NMDS axis 2 between the Cincinnati collections and the Nashville collections, or between the Appalachian collections and the Nashville collections. The separation on NMDS axis 2 appears to be driven by crinoids and bryozoans, which tend to have higher NMDS axis 2 scores, and the brachiopods Sowerbyella and Orthorhynchula, which tend to have lower NMDS axis 2 scores
Distance
Overall similarity decreases with geographic distance, but distance does not explain the majority of the trend in similarity (R 2=0.242, Fig. 8A). Variability in measured similarity decreases markedly with distance, particularly at distances exceeding 600 km.
Jaccard similarity (RA) versus geographic distance between the centroid of sets of collections, showing that similarity decreases with geographic distance. Bars represent 95% confidence intervals. A, Entire data set; dashed line is the fitted model. B, Appalachian/Cincinnati comparisons. Gray dashed line shows fit for the whole data set from (A), with black solid line showing regression of Appalachian/Cincinnati collections only. Numbers correspond to Appalachian subregions. C, As in (B), but for Appalachian and Nashville regions. D, As in (B), but comparing subregions with the Appalachian area.

The lines of best fit differ among each set of comparisons, indicating that similarity relates to distance differently for each set. Distance explains more variation in similarity for Cincinnati to Appalachian collections (R 2=0.593, Fig. 8B) than for Nashville to Appalachian comparisons (R 2=0.148, Fig. 8C) or within-Appalachian comparisons (R 2=0.121, Fig. 8D). Cincinnati to Appalachian comparisons consistently plot above the line of best fit for the entire data set, that is, they are more similar than expected given their geographic distance from one another. Nashville to Appalachian comparisons consistently plot below the line of best fit for the entire data set, and they are less similar than would be expected for collections separated by that distance. Comparisons between regions in the Appalachian Province are better approximated by the line of best fit for the entire data set; this is expected, as there are more within-Appalachian comparisons in the data set, so the fit line should tend to lie close to these points. Collections in Appalachian regions 1 and 2 are anomalously similar relative to all other combinations and to what could be expected given the distance between the two collections.
Discussion
Water Depth
Ordinations of modern and ancient marine communities commonly show that the taxonomic composition of marine communities varies primarily with water depth and factors correlated with it (see review in Patzkowsky and Holland Reference Patzkowsky and Holland2012). Data in this study are restricted to the shallow-subtidal environment in both the continental-scale study derived from the Paleobiology Database and the regional-scale study based on field counts of single bedding planes. This sampling design limits the variation in composition that could result from water depth, and as a result, faunal gradients in this study are more likely to reflect factors other than water depth.
Continental-Scale Gradient
Results suggest the presence of a continental-scale gradient in the Ordovician of Laurentia rather than discrete provinces. The Appalachian and Western provinces are the farthest and most dissimilar of the regions (Fig. 4) and represent the ends of this gradient. The Southern and Midcontinent regions are in the middle of the continent and in the middle of the faunal gradient. The Appalachian and Western provinces are more similar to both the Southern and Midcontinent than they are to each other, and the Southern and Midcontinent regions are most similar to each other. These relationships are consistent with these regions being divisions along a gradient. Although the Appalachian and Western regions are sufficiently distinct to classify these two as provinces, given that they have comparable similarity values to the comparisons with the United Kingdom, high similarity in the Southern and Midcontinent regions makes delineating well-defined provincial boundaries difficult. Observed spatial patterns in the faunal similarity of Late Ordovician communities of Laurentia are better described as a gradient.
The results from the field study and, to a lesser extent, the results from the Paleobiology Database primarily reflect spatial patterns in the occurrence of the most abundant taxa, those likely to be encountered in relatively small samples. Although it is possible that provincial differences may exist among rare taxa, the Late Ordovician provinces of Laurentia were defined on common invertebrates and conodonts (Elias Reference Elias1982; Sweet and Bergström Reference Sweet and Bergström1984; Anstey Reference Anstey1986; Carrera and Rigby Reference Carrera and Rigby1999; Jin et al. Reference Jin, Harper, Rasmussen and Sheehan2012; Mohibullah et al. Reference Mohibullah, Williams, Vandenbroucke, Sabbe and Zalasiewicz2012). As such, the analyses here are a reasonable test of the existence and nature of Late Ordovician Laurentian provinces. Furthermore, although differences exist in the historical sampling of the four study regions (e.g., the Cincinnati region is likely far better known than the other three regions), both the field data and the Paleobiology Database data are likely to capture the common taxa on which the provinces were recognized.
Support from Regional Study
Support for a gradient also comes from the regional study. Brachiopods dominate the Cincinnati, Nashville, and southernmost Appalachian collections and become less abundant to the north (Table 4). Bivalves are not among the most abundant taxa in the Southern region, but become increasingly abundant to the north in the Appalachian collections. Similarity to the Southern region increases southward among the Appalachian regions (Fig. 5). Collections in the Appalachian region are more similar to collections from the Cincinnati Arch than to collections from the Nashville Dome, suggesting there may be additional support for a gradient within the Southern region as well as in the Appalachian.
Evidence for the gradient expressed at this scale is most apparent in ordination space (Fig. 7). Collections from both the Southern regions have similar NMDS axis 1 scores, and Appalachian collections span NMDS axis 1 with more positive scores to the north. Collections from adjacent regions often overlap, and there is considerable overlap between southern Appalachian collections and Cincinnati collections along NMDS axis 1. Collectively, these overlapping NMDS scores suggest a gradient rather than discrete provinces. Cincinnati collections separate from Nashville collections on NMDS axis 2, which reflects the differences in their Jaccard similarities and adds additional support for a gradient within the Southern region.
Trends in the distribution of abundant taxa previously thought to have affinities for particular substrates (e.g., Bretsky Reference Bretsky1970) suggest that the primary gradient in faunal composition reflects differences in substrate. Both region-by-region abundance patterns (Table 4) and the taxon scores in NMDS space (Fig. 7) show that more articulate brachiopods are associated with Southern Province and southern Appalachian collections. Orthorhynchula tends to be more characteristic of northern Appalachian collections and is often associated with siliciclastic substrates (Bretsky Reference Bretsky1970). Gastropods and bivalves are more diverse and abundant in the northern Appalachian regions, and many of these are also associated with siliciclastic substrates. These relationships agree with previous interpretations of a substrate-driven gradient in the Appalachians (Springer and Bambach Reference Springer and Bambach1985) and suggest that the south-to-north gradient along NMDS axis 1 is largely substrate driven. It is unclear what environmental factors are responsible for the faunal variation along NMDS axis 2.
Given the clockwise rotation of Laurentia in the Late Ordovician relative to today, it is estimated that collections in the regional study spanned at most a 5° latitude range around 20–25°S during the Late Ordovician (Blakey Reference Blakey2013). Latitudinal differences are therefore likely not the primary cause of the faunal variations along the NMDS axis 1. For example, although the Cincinnati region was at roughly the same paleolatitude as the northernmost areas studied here within the Appalachians, collections from the Cincinnati region are most similar to collections from the southern Appalachians. Furthermore, depth is an unlikely cause of the faunal variations along the NMDS axis 1, given that all samples in this study are derived from the shallow subtidal. Geographic distance also accounts for less than 25% of the variation in axis 1 scores. Given all of this, it is most likely that NMDS axis 1 primarily reflects the effects of substrate type.
Gradient Changes through Time
The presence of a continental-scale gradient is supported during the Middle Ordovician and Late Ordovician, but the magnitude and pattern of this gradient changes over time. In the Middle Ordovician, the Western region is the most dissimilar, compared with the rest of Laurentia, but by the Late Ordovician, the Western region becomes more similar to the Southern and Midcontinent provinces. In contrast, the Appalachian Province was more similar to the rest of Laurentia during the Middle Ordovician, but it became more distinct from the rest of the continent by the Late Ordovician. In the Appalachian region during the Late Ordovician, many characteristic taxa of the eastern United States became extinct or contracted their ranges westward and northward, out of the Appalachian region (Patzkowsky and Holland Reference Patzkowsky and Holland1996), as nutrient-rich, cool-water, and siliciclastic conditions spread northwestward from the Taconic orogeny. These environmental changes resulted in the increasing faunal distinctiveness of the Appalachians into the Late Ordovician. In the latest Ordovician (C5 of Holland and Patzkowsky Reference Holland and Patzkowsky1996), a return of relatively nutrient-poor warm-water conditions to the Southern and Midcontinent regions brought the return of many Western taxa in the Richmondian Invasion (Holland and Patzkowsky Reference Holland and Patzkowsky1996, Reference Holland and Patzkowsky1997, Reference Holland and Patzkowsky2007; Patzkowsky and Holland Reference Patzkowsky and Holland1996, Reference Patzkowsky and Holland1999). Although the C5 was not sampled as part of this study, these observations would predict a weakening of the cross-continent faunal gradient in the latest Ordovician.
The Merits of Relative-Abundance Data versus Presence–Absence Data
Presence–absence and relative-abundance data reveal comparable patterns in similarity between the Appalachian and Southern areas, but the use of presence–absence data leads to higher values of similarity (Jaccard), as well as larger uncertainties. Presence–absence data are expected to produce greater values of similarity, because common taxa in one province merely have to be present in the second province to increase Jaccard similarity. If a taxon common in the first province is rare in the second province, the similarity gained from that taxon will be less for relative-abundance comparisons (Jaccard) than in presence–absence comparisons (quantified Jaccard). Considering that mean similarity when using presence–absence data must therefore be larger than estimates of similarity based on relative abundance, it is unsurprising that error is typically larger for the Jaccard coefficient than for the quantified Jaccard coefficient. As the relative abundances of taxa in the two communities become more similar, the two similarity coefficients will begin to converge, and the differences in error will decrease. Because presence–absence and relative-abundance data produce comparable results, presence–absence data may be sufficient for many studies, but relative-abundance data will provide greater discriminatory power and decreased uncertainties.
The Relationship between Distance and Similarity
Geographic distance between communities does not directly control community composition, but like water depth, distance is often used as a proxy for other factors that gradually vary between locations, and it may therefore control taxonomic composition. Similarity and geographic distance display an inverse relationship in this study, but distance alone explains a small proportion of similarity.
Observed variability in similarity measured at shorter distances is likely driven by variable environmental conditions (e.g., substrate) that would make regions vary in their similarity regardless of proximity. Variability in similarity decreases at greater distances, and this is unsurprising, as many factors that control faunal distributions could be expected to change over larger distances.
Each set of comparisons (Cincinnati collections vs. Appalachian collections, etc.) displays a different relationship between similarity and distance, suggesting some degree of separation or differentiation among these regions. If these areas were well connected or mixed, a single relationship would be expected to describe all of the data adequately. This suggests the complexity of the relationship between distance and similarity varies among the regions of Laurentia. Similarity values for comparisons involving Cincinnati collections and Appalachian collections are higher than average for the data set (Fig. 8). These collections are more similar to each other given the distance between them than would be predicted considering the observed relationship between distance and similarity for the data set as a whole. Conversely, similarity between Nashville collections and Appalachian collections are lower than would be predicted, and these are less similar than would be predicted given the distance between them. These variations may reflect environmental conditions that control faunal distribution being more similar between Cincinnati and the Appalachians than between Nashville and the Appalachians. Distance accounts for the least amount of variation in similarity for comparisons between collections within the Appalachian Province. This suggests there could be environmental factors that are more important than distance, such as substrate composition.
Conclusions
(1) Analysis of continental-wide literature data and regional field data supports the presence of a continental-scale gradient rather than discrete provinces in the Ordovician of Laurentia, particularly in the Late Ordovician. This continental-scale gradient is also evident at the regional scale in the eastern United States. Although distance is partly the source of this gradient, the transition from carbonate sediment to siliciclastic sediment from the west and south to the north and east appears to be the dominant cause of this faunal variation.
(2) Increased dissimilarity of faunal compositions over time of the Appalachian region relative to the rest of Laurentia suggests that the continental-scale carbonate–siliciclastic gradient was intensified by the Taconic orogeny. Increased siliciclastic input along the southeastern margin of Laurentia as a result of the orogeny is the likely cause of the intensified continental-scale faunal gradient.
(3) Both presence–absence and relative-abundance data support the presence of a continental-scale gradient. Relative-abundance data are preferred over presence–absence data, because their similarity values can reflect changes in abundance and they decrease the uncertainty in similarity estimates. Nonetheless, the continental faunal gradient is robust enough that it is apparent with either type of data.
Acknowledgments
We thank Arnie Miller and Susan Goldstein for comments on an early draft of this manuscript. We thank Paleobiology reviewers Frank Forcino, Matt Powell, and an anonymous reviewer for their helpful comments. We thank Megan Flansburg, Judith Sclafani, and Allison Platsky for assistance in fieldwork. S.M.H. acknowledges the collaboration with M. Patzkowsky in collecting the faunal data from the Cincinnati Arch and Nashville Dome. R code used in these analyses are deposited in the Dryad Repository: doi:10.5061/dryad.3bs4j. This study is supported by National Science Foundation grant EAR-0948895 to S.M.H. C.E.J. acknowledges the support of the Geological Society of America and the Miriam Watts-Wheeler Fund in funding this research.
Supplementary Material
Supplemental materials deposited at Dryad: doi:10.5061/dryad.3bs4j



