Statistics are usually valuable in proportion to their accuracy. Sometimes, however, the very flaws and distortions in a dataset allow us to reconstruct phenomena that it was not designed to capture. So it is with the stillbirth statistics of Imperial Japan (1868–1945). Peaking at 9.7 percent of all births in 1906, Japan's stillbirth rate (SBR) was among the highest ever reported by any country. Locally, the proportion of stillborn children could reach 60 percent.Footnote 1 In this article, I examine possible biological explanations but conclude that many ostensible stillbirths were in fact infanticides and late-term abortions.
Infanticide has long been considered an important part of Tokugawa Japan's (1600–1868) demography (Takahashi Reference Bonsen1936; Eng and Smith Reference Eng and Smith1976, among many others). By contrast, infanticide in the modern Imperial period (1868–1945) has received little attention. In part this may stem from the silence of the written record. While infanticide was a major topic of public debate from 1790 to 1875, it was no longer a pressing policy concern thereafter (Drixler Reference Drixler2013). In addition, some of the best demographic evidence for infanticides in Tokugawa Japan comes from the abundant individual-level data of its population registers. Although the modern household registers (koseki), introduced in 1872, may one day permit similar analyses, privacy protections have placed them beyond the reach of researchers, making it impossible today to extend the analytical strategies of Tokugawa-period historical demography into the modern age.
That infanticides and late-term abortions should have remained common in Imperial Japan is not a matter of course. Its law codes designated abortion as a crime and made no juridical distinction between infanticides and other homicides. In general, the Imperial Japanese state appears to have been highly effective. In a single lifetime, it transformed Japan from a vulnerable archipelago into a nation capable of defeating the Qing Empire and Russia. By 1919, Japan had gained membership in the world's most exclusive club, as one of the five major victorious powers of WWI. Domestically, officials saw themselves engaged in an effort to persuade “the masses to internalize appropriate values” (Garon Reference Garon1997, p. 7). In the words of another eminent historian, “it was not enough that the polity be centralized, the economy developed, international recognition striven for – the people must also be ‘influenced,’ their hearts and minds made one” (Gluck Reference Gluck1985, p. 1).
The formidable reputation of the Imperial Japanese state may explain why its statistics have generally been taken as a reflection of reality, or at least as a serviceable approximation. Over the decades, there has been repeated conjecture that some proportion of reported stillbirths were the result of what the demographer Irene Taeuber delicately called “direct action” (Kure Reference Ayatoshi1905, Reference Ayatoshi and Ichikawa1907; Maruoka Reference Maruoka1952, pp. 98–99; Taeuber Reference Taeuber1958, pp. 270–72; Honda Reference Honda, Steckel and Floud1997, pp. 278–79; Ōta Reference Motoko and Motoko1997, pp. 573, 579; Mogi and Fujikawa Reference Yōichi and Mai2002; Suzuki Reference Yuriko2006a, Reference Yuriko, Motoko and Kenji2006b; Iwata Reference Shigenori2009, p. 124).Footnote 2 However, many historians, economists, and demographers still take Japan's SBR to be substantively based on actual stillbirths, and have typically looked to physical explanations for why they were so frequent: poor health, overwork, or industrial poisoning (for example, Morooka and Motai Reference Taeko and Kimiyo1955; Tomobe Reference Tomobe1998, Reference Tomobe, Osamu and Ken'ichi2008, pp. 44–47; Iwata Reference Shigenori and Masakatsu2003; Murakoshi Reference Kazunori2004; Saitō Reference Osamu2008; Hayami Reference Akira2013; Murakoshi Reference Kazunori2013; Miyamoto Reference Kyoko2014).
The goal of this article is to estimate how many stillbirth reports were falsified between 1886 and 1940, and thus to compute a minimum number of infanticides and late-term abortions for those same years. I begin with a reconstruction of the geography of reported SBRs and their trends over time. A comparison with the global record of stillbirth statistics across several centuries reveals just how exceptional the figures from Japan are. After testing alternative explanations and examining what contribution biological factors could have made, I define the plausible range of actual SBRs in Imperial Japan. A final section calculates three scenarios for the number of false stillbirths.
DATA SOURCES
Beginning in 1884, Japanese law required that stillborn children could only be buried or cremated with an official permit, which the kochō or kuchō (roughly, mayors or subdistrict chiefs) would only issue when the parents filed a stillbirth report (shizan-todoke) with him (Murakoshi Reference Kazunori2004, pp. 1–3).Footnote 3 The stillbirth reports had to be accompanied by a stillbirth certificate. The national law provided that both midwives and physicians could issue these documents, but Osaka prefecture, for example, restricted this authority to physicians until 1899 (Murakoshi Reference Kazunori2013, pp. 2–4). The reports specified the sex of the fetus, whether its parents were married, and how long the pregnancy had lasted. The mayors collected the figures and forwarded them to the district. The district then submitted a summary to the prefecture.Footnote 4 My analysis draws on prefecture-level data, published as part of the national vital statistics for 1886–1942 (Naimushō et al. Reference Naimushō and Akira1992–Reference Naimushō and Akira1993), and district-level data drawn from 591 prefectural statistical yearbooks for 1886–1912.Footnote 5
There is some direct evidence for the falsification of stillbirths. When in the 1930s, ethnographers compiled a national survey of birth and childrearing customs, the entry for a village in Aomori stated that women would commit infanticide and then “dispose of the matter as a stillbirth” (Onshi Zaidan Boshi Aiikukai Reference Zaidan and Aiikukai1975, p. 159). Falsified stillbirth reports also feature in oral histories taken after 1980. A midwife in Yamagata prefecture remembered that before the 1940s, there were “an awful lot” of abortions and infanticides, and that she would often be called in to “fill out the form after having examined the ‘stillborn’” (Ochiai Reference Ochiai and Wakita1999, p. 274). Other elderly midwives recalled that as late as the 1950s, they would be expected to do away with babies born with physical abnormalities. In the paperwork they filed with the police, they would state a natural cause of death, or that the child had been stillborn (Steger Reference Steger1994, p. 184; Suzuki Reference Yuriko2002, pp. 12–13, Reference Yuriko2006a, p. 84).Footnote 6
By the mid-twentieth century, false stillbirth reports had a long history in Japan. During the late Tokugawa period, many domains required women to report their pregnancies and submit an explanation whenever these did not result in a healthy infant (Drixler Reference Drixler2013, pp. 158–82, 287–88). Some people at least found ways to continue their family planning practices in the face of such state intrusion; already in the years around 1800, officials in a number of areas noted that stillbirths had come to serve as a cover for infanticides and abortions.Footnote 7
After the 1870s, Imperial Japan never required women to report their pregnancies, and only created a (formally voluntary) registration system in 1942. Why then did parents in Imperial Japan not simply leave their infanticides and abortions unreported altogether? Some may have done so. But in the tight-knit communities in which most Japanese lived at this time, individual pregnancies must have been common knowledge. Parents who terminated a pregnancy or killed a baby without submitting a stillbirth report left themselves open to suspicion. Parents who filed a stillbirth report, on the other hand, could generally rest assured that the state would make no further inquiries.
GEOGRAPHICAL DISTRIBUTION AND TRENDS OVER TIME
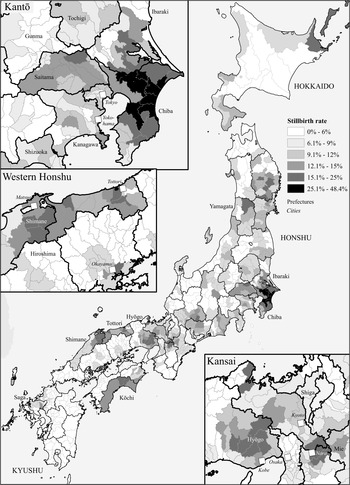
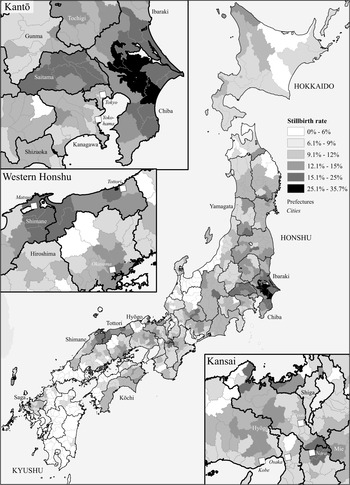
Until 1930, Japan's SBRs showed an extraordinary degree of regional diversity. In the 1890s, one district due east of Tokyo reported about 50 percent of its children stillborn,Footnote 8 while at the southern tip of Kyushu, the rate for Kagoshima prefecture rarely exceeded 1 percent. Districts with high SBRs often formed clusters (Figures 1 and 2). The largest of these had its core in the eastern Kantō plain and covered most of Chiba, southern Ibaraki, and northern Saitama. On the Japan Sea coast of Western Honshu, another large cluster straddled the border between Shimane and Tottori prefectures, fading gradually to lower rates along the coast but coming to an abrupt halt at the mountains. Smaller stillbirth clusters dotted the mountainous spine of the Northeast, but also less remote areas such as the environs of the prefectural capitals of Saga, Okayama, and Nara, as well as the hinterland of Kobe, a major international port.Footnote 9
STILLBIRTH RATES BY DISTRICT, 1886–1895

STILLBIRTH RATES BY DISTRICT, 1896–1905

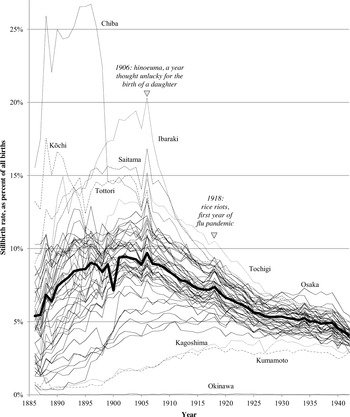
While a district's SBR in one year is a strong predictor for the next, there were marked changes over time.Footnote 10 In most prefectures, SBRs rose from 1886, peaked in the first decade of the twentieth century, and declined in the 1920s and 1930s to converge around the national average (Figure 3). This was probably the result of two overlapping trends. Parents gradually became more likely to report stillbirths, genuine as well as feigned, to the authorities. At the same time, the steady retreat of infanticide and late-term abortion (Drixler 2013, pp. 208–31) diminished the number of parents who had occasion to falsify a stillbirth report. In most prefectures, SBRs subsided after a last sharp peak in 1906, a year considered unlucky for childbirth for astrological reasons.Footnote 11
STILLBIRTH RATES BY PREFECTURE, 1886–1940

There were some exceptions to these general trends. Even in 1912, the last year of the Meiji period, there remained districts at the southwestern edges of Japan where almost no fetal deaths were reported. The prefectures of Kumamoto and Kagoshima only reached plausible levels in the 1920s, and in Okinawa, the figures remained impossibly low even on the eve of the Pacific War. That Japan's far south should have been so slow to implement the reporting requirement raises questions about the penetration of the state into its local societies.Footnote 12
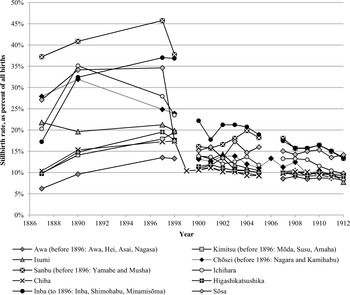
Chiba prefecture, just east of Tokyo, was exceptional not for the direction of change but for its speed. Its case is especially instructive for what it suggests about the causes of high SBRs. In 1898, Chiba attempted to protect newborns by requiring that (in addition to the mayor) the police had to be informed before stillborn children or those who had died in their first three days could be buried; violators would face fines and short prison terms.Footnote 13 Between 1897 and 1899, the SBR plunged from 25 percent to 15 percent. This drop occurred in all of Chiba's nine districts (see Figure 4). Just across its northern border, in southern Ibaraki, where no new policing rules were introduced, stillbirths remained at around 25 percent for another decade.
STILLBIRTH RATES IN THE DISTRICTS OF CHIBA PREFECTURE, 1887–1912

THE GLOBAL PATTERN OF STILLBIRTHS
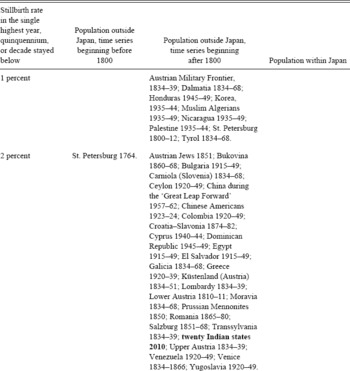
The variability of stillbirth rates across space and time within Japan highlights the anomalous situation in some parts of the country; just how exceptional the regions with the highest rates were is fully revealed in an international comparison. Even before the medical advances of the mid-twentieth century, stillbirths outside Japan rarely exceeded 6 percent of all births. Appendix 1 documents this fact in a survey of hundreds of populations across five centuries.
Published stillbirths statistics go back to 1581 for parts of Saxony, to 1751 for Sweden, 1758 for parts of Prussia, to 1777 for Mecklenburg, and to 1801 for Denmark, Norway, and Iceland. By the Napoleonic period, many German states were beginning to collect such figures, and by the mid-nineteenth century, most of continental Europe and a few U.S. states had followed suit. By the 1920s, stillbirth statistics were published for Taiwan, Egypt, parts of Latin America, some British colonies (Ceylon, Mauritius, British Guiana, India, South Africa) and Puerto Rico, as well as for England, Wales, most U.S. states, and Canada (Neefe Reference Neefe1874, pp. 204–13; Woods Reference Woods2009, pp. 56–57; sources for Appendix 1).
Since definitions and procedures for reporting stillbirths differed between countries, these statistics are not strictly comparable.Footnote 14 The precise number of weeks of gestation or the birth weight that distinguish a miscarriage from a stillbirth has long varied between different statistical systems.Footnote 15 There has also been disagreement on the line between fetal and neonatal deaths. In many Catholic populations, stillbirths were routinely underreported to permit the baptism of the dead child (Pfister Reference Pfister1986). In France, conversely, live-born children who died during the first three days after birth were registered as mort-nés if their parents had not already reported their births; similar rules were in place in the Netherlands, Belgium, Denmark, and some German states (Westergaard Reference Westergaard1901, pp. 328–29). This practice may have overstated SBRs by about 1 percentage point (Woods Reference Woods2009, pp. 77–79). Wherever abortion was illegal, stillbirth statistics may also have included varying proportions of deliberate terminations.
Despite the diversity of statistical practice, SBRs outside Imperial Japan fall into a relatively narrow range. Before the medical progress of the twentieth century, about 1 to 5 percent of babies were reported stillborn in most societies. The only rates in excess of 8 percent that I have found in my search through statistical compilations from all parts of the world come from Strasbourg (1809–1810), where some neonatal deaths may have been classified as stillbirths; a maternity ward in Paris (1776–1786), whose patients were likely selected for obstetric complications; a number of tropical populations in the Caribbean, Mauritius, and Rio de Janeiro; and African Americans in the 1920s.Footnote 16 SBRs that adhere to the modern definition overwhelmingly remained below 6 percent. This is even true for the maximum rate reported in each national or local time series (see Appendix 1).
The same range generally obtains in the records of individual midwives, parishes, and hospitals that antecede the introduction of modern statistical systems. SBRs averaged 4.2 percent for six hospitals in the British Isles (Woods Reference Woods2009, pp. 89–95), 2.6 percent for the patients of three midwives and two doctors in nineteenth-century New England (Ulrich Reference Ulrich1989, pp. 27–48); and no more than 5.4 percent for the voluminous case record of Catharina Schrader, a Frisian midwife who began her practice in the 1690s.Footnote 17 In a sample of baptismal records from parishes in seventeenth and eighteenth-century Saxony, decadal SBRs peaked at 4.2 percent.Footnote 18 Among seventeen seventeenth-century English parishes (Galley Reference Galley2008, p. 81), the highest average was 5.5 percent.Footnote 19
Today, SBRs have declined to a few births per thousand in developed countries, but among poor populations with high disease burdens, the range is similar to that for nineteenth-century Europe. For countries that do not collect stillbirth statistics, the World Health Organization bases its SBR estimates on their pattern of neonatal mortality; for 2000, the highest national rate derived from this (questionable) approach was 6.3 percent, for Mauretania. Among the 112 countries that collect stillbirth figures directly, the highest national rate for the same year was 3.2 percent (Iraq and Azerbaijan). At the turn of the twentieth century, therefore, many Japanese prefectures reported stillbirth rates far higher than any of the historical and contemporary populations listed in Appendix 1, many of which probably suffered worse health conditions and more dangerous medical practices.
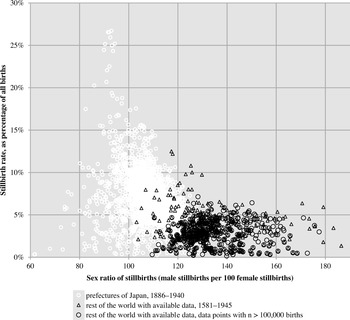
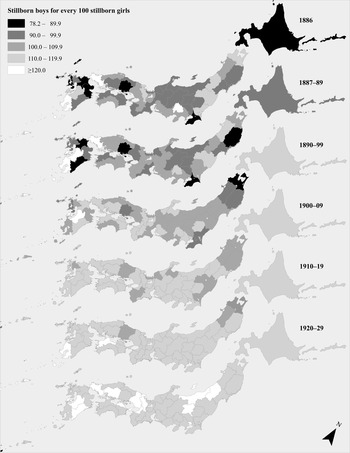
Japan's stillbirth statistics stand apart from the international record in another dimension. Around the world, far more male than female fetuses die in utero. Outside Japan, the sex ratio of stillbirths fell below 115 in just 3.5 percent of the 854 populations sampled here (Figure 5). But when Japan began to publish stillbirth statistics in 1886, stillborn girls outnumbered stillborn boys in more than half of its prefectures (Figure 6), as well as in the nation overall. Although sex ratios generally rose thereafter, it was only in 1909 that all prefectures reported more male than female fetal deaths.
STILLBIRTH SEX RATIOS IN JAPAN AND THE WORLD, 1581–1945

SEX RATIO OF STILLBIRTHS IN THE PREFECTURES OF JAPAN

CORRELATION BETWEEN STILLBIRTHS AND BIOLOGICAL FACTORS
Analysts of Japan's elevated SBRs have often favored physical explanations. From the geographical variation within Japan as well as Japan's anomalous position in an international comparison, it is clear that any argument that takes Japan's SBRs at face value runs into two formidable challenges. First, it has to demonstrate that in 1900, Japanese women were in a worse physical condition than any of the populations listed in Appendix 1. Second, any hypothesis that treats all reported stillbirths as real has to explain the extraordinary degree of variation within Japan.
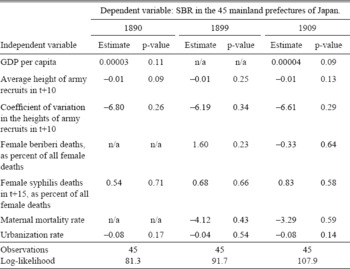
To determine to what extent the second challenge can be met, I examine the correlation between biological and environmental factors and prefectural stillbirth rates in three separate years, 1890, 1899, and 1909.Footnote 20 To approximate the proportion of the population living in absolute poverty, I use: prefectural gross domestic product (GDP) per capita,Footnote 21 the average height of army recruits lagged by ten years,Footnote 22 and the coefficient of variation of these heights.Footnote 23 To control for qualitative malnutrition among pregnant women, I take the proportion of women's deaths ascribed to beriberi (vitamin B1 deficiency). To account for the effects of syphilis on fetal survival, I include the proportion of female deaths caused by this disease, lagged by 15 years to reflect the typically slow progression from infection to death (Naikaku Tōkeikyoku Reference Tōkeikyoku1910–Reference Tōkeikyoku1912). The maternal mortality rate serves as a measure for the quality of obstetric care.Footnote 24 Pregnant women in cities were probably less likely than those on farms or in mines to work in professions that required heavy lifting; the regression therefore uses the urbanization rate as a proxy for this supposed risk factor.Footnote 25 The estimating equation is as follows:

where subscript i = 1, …, N indicates the prefecture, yi * is the frequency of stillbirths, xi ' is a time-dependent vector of control variables.
The results of the regression are presented in Table 1.Footnote 26 None of the seven proxies for physical wellbeing showed statistically significant correlations with the SBR in any of the three years. With up to seven independent variables for just 45 data points in each year of the regression, the model is arguably overfitted. However, since overfitting heightens the risk of false positives, this model configuration only makes the absence of significant correlations more notable.Footnote 27
THE CORRELATION BETWEEN THE STILLBIRTH RATE AND PROXIES FOR THE PHYSICAL CONDITION OF PREGNANT WOMEN

Note:
Okinawa was excluded because its vital statistics are obviously unreliable with not a single stillbirth reported in 1890.
Sources:
See text.
THE CONTRIBUTION OF BIOLOGICAL FACTORS AND ACCOUNTING PRACTICES
That none of these economic and biological factors correlates significantly with SBRs does not mean that none of them made fetal deaths more frequent. This section therefore explores the extent to which each biological factor might have raised the SBR.
Malnutrition
Diets for many inhabitants of Japan continued to be meager well into the twentieth century. Around 1900, average daily calorie intake has been estimated at just over 2,000 kcal (Mosk Reference Mosk1978; Honda Reference Honda, Steckel and Floud1997, pp. 267–73). In addition, beriberi was a common ailment among those wealthy enough to center their diets on polished rice (Bay Reference Bay2012). But how far can malnutrition raise the SBR? The Finnish famine of 1866–1868 caused excess deaths of about 7 percent of the population, yet only lifted SBRs from 3.0 percent in 1865 to a peak of 4.3 percent in 1868 (Rothenbacher Reference Rothenbacher2002). In 1899–1900, although a famine in Berar (India) reduced period life expectancies at birth to nine years (Dyson Reference Dyson, Dyson and Ó Gráda2002, p. 107), SBRs increased to just 5.1 percent in 1900 (Chinoy Reference Chinoy1902, p. 44). In a sample of retrospective interviews in China, the SBR remained below 2 percent during the Great Leap Forward Famine of 1959–1961 (Yong and Wang Reference Cai and Feng2005, p. 308).
Although hunger was not unknown in Imperial Japan, its people were spared famines on anything like this scale. Before we consider other risk factors, an assumed actual SBR of 4 percent can therefore accommodate even a very pessimistic assessment of Imperial Japan's nutritional situation.
Heavy Workloads
On Japan's farms and even in its coal mines, many pregnant women worked to the day of their delivery (Yoshimura Reference Noriko1985, pp. 120–21; Mathias Reference Mathias and Hunter1993, p. 111; Tomobe Reference Tomobe1998, p. 54, Reference Tomobe2007; Ochiai Reference Ochiai and Wakita1999, p. 259; Terazawa Reference Terazawa2001, pp. 255–56). Yet heavy physical labor in the final stages of pregnancy need not have contributed to higher SBRs. A large Danish study reported significantly lower stillbirth rates for women who lifted heavy weights more than four times a day, and found no significant association between frequent lighter lifts and stillbirth risks (Juhl et al. Reference Juhl, Strandberg-Larsen and Stemann Larsen2013).
Trends in time and space within Japan, too, support the impression that physical exertion in the late stages of pregnancy was not a major contributor to fetal deaths. It is uncertain whether the workloads of pregnant women diminished between 1904 and 1924, when the range of prefectural SBRs narrowed from 2–19 percent to 3–8 percent. In addition, pregnant women must have been more likely to lift heavy weights in the countryside than in the cities, as the majority of women's occupations in cities, including work in textile factories, did not involve the same degree of backbreaking physical exertion. Nevertheless, SBRs were not consistently lower in cities. On average, urban SBRs were 1.15 times as high as in their prefectures overall.Footnote 28
Industrial Pollution
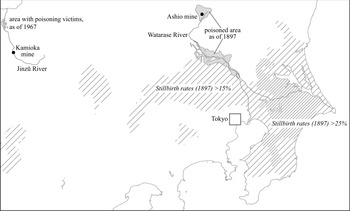
Hayami Akira (Reference Akira2013) has recently attempted to explain the high SBRs of five Kantō prefectures (Tochigi, Saitama, Gunma, Ibaraki, and Chiba) as the result of toxic run-off from modern Japan's richest copper mine, Ashio (Tochigi prefecture). When we map SBRs by district, however, it becomes clear that the areas with the most frequent fetal deaths lay well beyond the reach of Ashio's toxic effluents (Figure 7).
AREAS POISONED BY EFFLUENTS FROM THE KAMIOKA AND ASHIO MINES

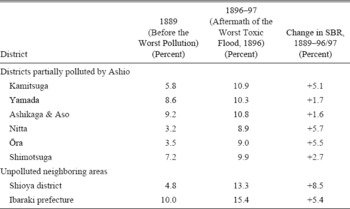
A closer look at the worst-affected districts reveals that even locally, the effect of industrial poisoning on SBRs cannot have been large. Major floods spread great quantities of arsenic, cadmium, and sulfuric acids on fields along the Watarase river on three occasions in the 1890s (Shoji and Sugai Reference Shoji, Sugai and Ui1992; Walker Reference Walker2010; Stolz Reference Stolz2014). Over that decade, SBRs in the affected districts increased by up to 4.8 percent. However, in some neighboring areas untainted by Ashio's waste, SBRs rose even faster (see Table 2).
STILLBIRTH RATES IN AREAS POISONED BY THE ASHIO COPPER MINE AND IN UNPOLLUTED NEIGHBORING AREAS

Sources:
See text.
In another infamous pollution case from this period, the Kamioka zinc mine discharged cadmium into the Jinzū river, whence irrigation canals carried it to many rice fields in Toyama prefecture (Walker Reference Walker2010). In 1912, the year cadmium poisoning was first diagnosed in the region, the two affected districts (Nei and Kaminiikawa) had SBRs of 3.0 and 3.8 percent. By 1930, after hundreds more tons of cadmium had been discharged, the rates were 4.2 and 4.0 percent, still well below the national average. If stillbirth rates did not rise conspicuously even in the areas suffering the worst industrial poisoning, the overall contribution of such pollution to Japan's high SBRs must have been exiguous.
Anemia
Anemia may have been a common condition among pregnant women in Imperial Japan. One cause, hookworm infections, was known to afflict the inhabitants of certain regions with particular frequency. For example, in several of Saitama's high-stillbirth districts, farmers who fertilized their fields with the feces of Tokyo suffered so conspicuously that the condition was known as Saitama-byō, or “Saitama disease.”
Anemia has raised the risk of stillbirths in some small studies and lowered it in others. Two meta-analyses conclude that iron supplements have no effect on stillbirths (Barros et al. Reference Barros, Ahmed Bhutta and Batra2010, p. 5; Yaqoob et al. 2009, p. 24). Even in a study that views anemia as a major risk factor for stillbirths, a Sudanese population of pregnant women with an estimated anemia prevalence of 48 percent had an SBR of just 3.3 percent (Ali and Adam Reference Ali and Adam2011). It is therefore prudent to assume that anemia made no noticeable contribution to Japan's SBRs.
Syphilis and Other Diseases
At first glance, contagious diseases appear to be a strong candidate for explaining Japan's high SBRs. In Figure 1 and Figure 2, SBRs often cluster in space, as we might expect of an infection. In addition, a number of diseases are known to increase the risk of stillbirth, including malaria, measles, smallpox, scarlet fever, and syphilis.Footnote 29 By 1900, smallpox was on the verge of eradication in Japan, measles had become a disease of childhood, and malaria and scarlet fever were relatively rare. Together they accounted for only about one in a thousand female deaths in Japan in 1910 (Suzuki Reference Suzuki2009, pp. 831–38; Naikaku Tōkeikyoku Reference Tōkeikyoku1910–Reference Tōkeikyoku1912). Syphilis, however, was a common infection in Imperial Japan and requires careful consideration.
To determine by how much syphilis could have raised SBRs, we first need to estimate its prevalence and then establish what the stillbirth risk for syphilis-infected women was. Between 1912 and 1923, a series of health inspections produced figures for syphilis infections among recruits, soldiers, and three classes of prostitutes (Takagi Reference Otsuyū1925; Tomobe Reference Tomobe, Osamu and Ken'ichi2008). Within each group, the rate of syphilis was below 0.8 percent. Since the technology at the time could only detect acute syphilis with its obvious sores, but not latent syphilis, these surveys greatly underestimate the prevalence of the infection. For a less direct, but more realistic, estimate, I have therefore turned to Japan's causes-of-death statistics.Footnote 30
Syphilis progresses in three stages, only the third of which is fatal. About one in three untreated primary infections develop into tertiary syphilis (Fauci et al. Reference Fauci, Braunwald and Kasper2008, pp. 1038–40). Even tertiary syphilis typically takes many years to kill, so that many patients die from other causes. The best study of the course of untreated syphilis that included female subjects is a retrospective analysis of nearly 2,000 patients in Oslo between 1891 and 1951. Syphilis was the primary cause of death in 8 percent of these infected women (Gjestland Reference Gjestland1955). If we assume that the Norwegian study population and the Japanese women infected with syphilis were comparable in a number of relevant dimensions, it follows that for every female death ascribed to syphilis in Japan, 12.5 women were infected with the disease over the preceding decades.Footnote 31
To estimate the number of pregnancies affected by syphilis, I make assumptions about the age-pattern of infections and pregnancies. For the former, I draw on the Oslo study, where two thirds of patients had acquired the infection by the age of 25. In Japan, age-specific fertility rates were not collected nationally before 1925, but Kanagawa prefecture did so already in 1901. If seropositive women in Japan were infected at the same ages as the participants in the Oslo study, and if their pregnancies followed the same age-pattern as those in Kanagawa, 73 percent of pregnancies for those women who had syphilis by the end of their lives occurred while they were seropositive.
Syphilis infections have been shown to greatly raise the risk of fetal death. In a Tanzanian study, fully a quarter of the pregnancies of women with high-titer active syphilis ended in stillbirths compared to less than 1 percent for uninfected women (Watson-Jones et al. Reference Watson-Jones, Changalucha and Gumodoka2002). In a Bolivian study, the rates were 15 percent and 2.3 percent, respectively (Southwick et al. Reference Southwick, Blanco and Santander2001). While it is not clear whether the same strain of syphilis afflicted Japanese women, I assume a 20 percent SBR for seropositive women in Japan for the purposes of this estimate.
Based on this information, it is now possible to calculate back-of-the-envelope estimates for the contribution of syphilis to Japan's stillbirths. 1910 will serve as an example. In that year, 0.87 percent of female deaths in Japan were ascribed to syphilis. At 12.5 infections for every death, about 11 percent of adult women in the preceding decades would have been seropositive. If 73 percent of the pregnancies of women who would eventually become infected occurred after the spirochete had invaded their bodies, about 8 percent of pregnancies in Japan would have been carried by seropositive women in the decades prior to 1910. If seropositive women lost 20 percent of their fetuses and seronegative women lost 4 percent, syphilis would have raised the overall SBR to 5.3 percent. The prefecture in which syphilis comes closest to explaining the recorded SBR is Saga, where syphilis may have raised the incidence of fetal deaths by about 2.8 percent of all births during the 1890s and 1900s, at a time when between 7 and 10.2 percent of children were reported stillborn. Even in Saga, however, contemporary accounts of infanticides (Ono Reference Takeo1932, p. 101) suggest that this was not the whole story.
Syphilis, therefore, probably increased Japan's SBRs noticeably in the years around 1900, by about 1.3 percent nationally and by between 0.2 percent (Toyama) and 2.8 percent (Saga) in the individual prefectures.
Accounting Practices: Invented Numbers, Neonatal Deaths, and Late Reporting
Japan's modern statistical system was still young at the turn of the twentieth century; is it possible that a desire for efficiency on the part of local officials or grieving parents lies behind anomalous SBRs, as Murakoshi Kazunori (Reference Kazunori2004, Reference Kazunori2013) and Saitō Osamu (Reference Osamu2014) have suggested? I know of no qualitative evidence from Meiji Japan that bureaucrats routinely invented numbers. If individual officials did falsify statistics, this could not explain the clusters of high stillbirths, with their typically smooth gradients that crossed prefectural boundaries (see Figures 1 and 2). Finally, the numbers themselves conform to Benford's Law, and thus pass a basic test for detecting accounting fraud.Footnote 32
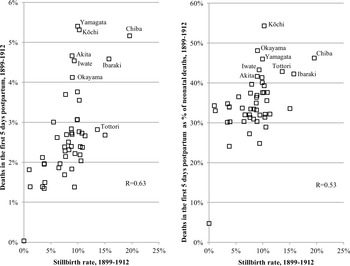
Murakoshi (Reference Kazunori2013) argues that stillbirths were elevated before the 1920s because many parents reported natural deaths in the first five days postpartum as stillbirths, rather than filing separate notices for birth and death. Murakoshi rests his analysis on the assumption that the frequency of stillbirths and neonatal deaths should move in tandem. When the SBR falls even as neonatal deaths (deaths in the first 30 days) rise, he concludes that some deaths were previously miscategorized. In fact, however, those prefectures with the highest frequency of stillbirths also had unusually many deaths in the first five days postpartum (Figure 8). In prefectures with high SBRs, neonatal deaths were in addition unusually concentrated in the first days postpartum, as also shown in Figure 8. This suggests that infanticides were concealed not just as stillbirths, but also as neonatal deaths, and on a scale that easily offset any misreporting of natural deaths as stillbirths.
REPORTED STILLBIRTHS AND THE TIMING OF NEONATAL MORTALITY IN THE PREFECTURES OF JAPAN, 1899–1912

There was one area in which accounting practices may have overstated the stillbirth rate somewhat. A proportion of live births was reported only years late. According to calculations by Takahashi Shin'ichi (Reference Shin'ichi, Shin'ichi and Satoshi2010, pp. 21–23), that proportion was usually less than 5 percent of all births after 1887. If all stillbirths but only 95 percent of live births were reported immediately, an actual SBR of 5.3 percent may therefore have been overstated as 5.6 percent.
Summary
Based on international comparisons and assuming that some pregnant women in Japan were malnourished, a base-line stillbirth rate of 4 percent seems reasonable for 1900. Most other considerations (anemia, overwork, pollution) do not raise this estimate substantively, but after adding the effects of syphilis and the late reporting of live births, a national SBR of 5.6 percent (and up to ca. 7 percent in areas with the worst syphilis prevalence) can be explained in the absence of infanticides and abortions falsely reported as stillbirths.
ESTIMATING THE NUMBER OF INFANTICIDES AND ABORTIONS CONCEALED IN OFFICIAL STATISTICS
False Stillbirths
There are two grounds on which a portion of stillbirths can be identified as false: either because of an implausibly high SBR or because of an abnormal sex ratio of stillbirths. As just discussed, the highest local SBRs that can be reconciled with known physical conditions in Japan are about 5–7 percent. In some cases, however, stillbirth statistics that translate into an innocuously low SBR also conceal infanticides or abortions. Throughout the world, the sex ratio of stillbirths is much higher (typically 115 to 145) than the sex ratio of live births (typically 104 to 107) or that of fetuses (typically 105 to 109). Thus, a sex ratio of stillbirths significantly below 115 implies deliberate interventions.
Since sex-selective abortion was beyond the technological capabilities of Imperial Japan, the sex ratio of abortions equaled that of fetuses of the same gestational age. With infanticides, any sex ratio is theoretically possible. However, there are many indications that the sex of the child, while important, was only one of several considerations that influenced the parents' decision to raise or reject it.Footnote 33 The sex ratio of infanticides may often have been as low as 80 girls for every hundred boys; however, to establish a minimum number of infanticides, I err on the side of caution and assume that it was either 50 (when there are suspiciously many female stillbirths), or 200 (in the rarer cases when male stillbirths are too frequent). For each sex ratio (SR) of reported stillbirths (SB), I determine the minimum rate of unequivocal infanticides (x) and the corresponding rate of terminations that could have happened on either side of birthFootnote 34 (y) by solving the following equation for the minimum value of x:

where

and

When  drops below a minimum plausible SBR, I assume that (1) not all actual stillbirths were reported and (2) that all false stillbirths are infanticides. Assumption (2) is arbitrary. However, it serves to minimize the total number of interventions (infanticides or abortions) estimated by this procedure, since it always takes more abortions than infanticides to explain a sex ratio distorted in favor of boys' survival. In such cases, I therefore use equation 3:

where SRnatural SB is the end of the plausible range closest to SRreported SB
I repeated this procedure for every prefecture and year for early stillbirths (gestational months 4 to 7, as reported in the statistical yearbooks) and late stillbirths (months 8 to 11).Footnote 35 I treat early-gestation stillbirths as potential infanticides because with feigned stillbirths, the reported month is not always reliable; the distorted sex ratios suggest that some parents and midwives thought it safer to hide an infanticide behind an early rather than a full-term stillbirth.
Births Out-of-Wedlock
Illegitimate children were reported stillborn far more frequently than children whose fathers recognized them. A number of scholars have taken this as evidence that unwed mothers were particularly likely to resort to abortion or infanticide (Maruoka Reference Maruoka1952 pp. 98–99; Honda Reference Honda, Steckel and Floud1997, pp. 278–77; Mogi and Fujikawa, Reference Yōichi and Mai2002; Suzuki Reference Yuriko2006a, pp. 75–83, Reference Yuriko, Motoko and Kenji2006b, p. 149). However, it is also possible that the presence of a living child would prompt the father to marry its mother, thereby reducing the denominator of the illegitimate SBR but not its numerator. The sex ratio of all births is often extremely low for illegitimate children, a phenomenon difficult to explain unless fathers were more likely to marry women who had borne them a boy than those who had given birth to a girl. If the sex of the child could influence whether its parents would marry each other, it is likely that its living presence had a large effect as well. Estimating fictitious stillbirths from the discrepancy between legitimate and illegitimate children is therefore difficult and perhaps impossible; while it is plausible that illegitimate children were at higher risk of infanticide, this article makes no use of these categories in its calculations.
Infanticides Reported as Neonatal Deaths
While most infanticides were concealed as stillbirths, some seem to have been reported as neonatal deaths. As with stillbirths, newborn boys are usually at greater risk of unintended neonatal death than their sisters. As with stillbirths, the reverse pattern obtained in many parts of Japan during the early twentieth century. For example, according to the 1914 statistics for the northeastern prefectures of Iwate, Miyagi, and Akita, 1,582 boys and 1,803 girls died in the first five days of their extrauterine lives.
I use an abbreviated version of equation 3 to determine the minimum proportion of infanticides (x) necessary to explain the sex ratio of reported neonatal deaths:

where SRnatural neonatal deaths is the end of the plausible range closest to SRreported neonatal deaths.
To this number of hidden infanticides, I added the following proportion, if it was larger than zero:

This procedure was repeated for deaths at two different ages, those occurring in the first five days after birth, and those on days 6 to 30.
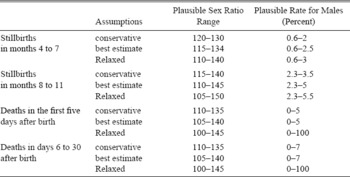
For the natural range of sex ratios and the highest possible rate of fetal or infant deaths in the different age groups, I use the assumptions in Table 3.
THE PLAUSIBLE RANGE OF NATURAL STILLBIRTHS AND NEONATAL DEATHS

Sources:
Based on an analysis of the Sources for Appendix 1.
RESULTS
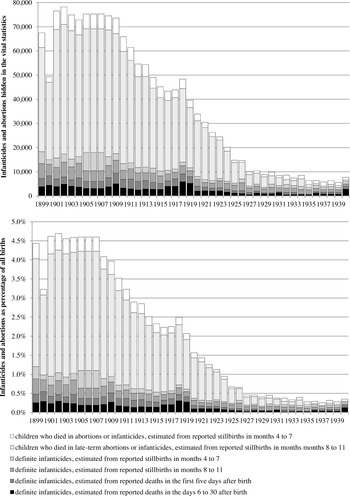
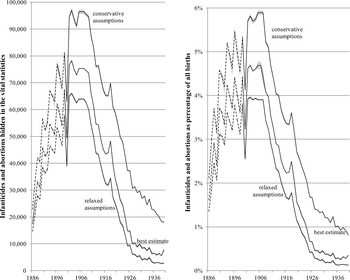
For every year before the 1920s, this methodology detects tens of thousands of false stillbirths and suspicious neonatal deaths, as plotted in Figure 9. Between 1901 and 1909, their annual number exceeded 70,000, or more than 4 percent of all births. From 1910, a steady decline set in, until the proportion of false stillbirths subsided below 1 percent of all births in 1923. Nonetheless, the fates of several thousand children per year continued to be wrongly classified as stillbirths even in the 1930s, along with, at minimum, many hundreds of infanticides that were simply filed away as neonatal deaths.
INFANTICIDES AND ABORTIONS ESTIMATED FROM STILLBIRTH AND NEONATAL DEATH STATISTICS, 1899–1940, BY REPORTED AND ACTUAL AGE OF THE CHILD

While the thresholds and ranges that underlie Figure 9 reflect my best estimates, there is room for disagreement about the plausible range of stillbirth rates, stillbirth sex ratios, and sex ratios of neonatal deaths. Table 3 lists a more conservative and a more relaxed set of assumptions, which can accommodate a wide range of views about the physical condition of pregnant women in Japan as well as the outer limits of plausible sex ratios. Following the same procedure as above, the separate sets of assumptions result in the estimates plotted in Figure 10. To take account of the random fluctuation in the sex of stillborn children in each prefecture, I give the 95-percent confidence interval for each curve. Even with the most relaxed assumptions about plausible rates and sex ratios, feigned stillbirths and unnatural neonatal deaths reached 60,000 cases per year or 4 percent of all births in the first decade of the twentieth century. Under more restrictive assumptions, they exceeded 90,000 cases a year and approached 6 percent of all births.
THREE DIFFERENT ESTIMATES FOR INFANTICIDES AND ABORTIONS FROM REPORTED STILLBIRTHS AND NEONATAL DEATHS

These annual estimates add up to very large numbers. Between 1899 and 1940, Japanese individuals filed 1.2 to 2.2 million false stillbirth reports, and classified at least 36,000 to 270,000 infanticides as natural neonatal deaths. Before 1899, stillbirths were not published by gestational age. But if we assume that the same ratio of late to early stillbirths prevailed in 1899–1898 as in 1899–1909,Footnote 36 the total number of false stillbirth filings in 1886–1940 was between 1.7 and 2.8 million. If we include neonatal deaths wrongly ascribed to natural causes, the overall number of rejected children hidden in the statistics rises to between 1.7 and 3.1 million.
These figures should be understood as a lower bound. Some infanticides and late-term abortions remained entirely outside the vital registration system. The custom of hiding them in the stillbirth statistics was clearly well entrenched in some areas, but in others (such as many parts of Kyushu), it may never have been common. One trace of these otherwise unrecorded infanticides is a distorted sex ratios of all births.Footnote 37 Between 1886 and 1940, 73,000 female embryos are unaccounted for.Footnote 38 Another trace is the unusual timing of infant deaths in some areas (see Figure 8). In Kōchi, a prefecture long infamous for infanticide, the proportion of children dying in their first five days postpartum was between 2.1 and 2.7 times higher (1899–1912) than in the neighboring three Shikoku prefectures, which had no such reputation. If the entire difference was due to infanticides, they would have claimed an additional 3 percent of newborns in Kōchi over these years just based on the timing of deaths reported for the first five days.
For most of the missing children, my methodology does not establish on which side of birth they died. There are reasons to believe that a large fraction of these indeterminate cases were in fact infanticides. Abortions in the final months of pregnancy were probably not particularly common. Among a sample of abortions brought to trial between 1899 and 1918 and collected by the forensic pathologist, Okamoto Harimatsu, just 2 percent fell into the ninth and tenth month of pregnancy, months that accounted for fully 57 percent of Japan's reported stillbirths over the same years (Iwata Reference Shigenori2009, pp. 49–52, 119). There is also some direct evidence that people considered abortions more perilous and therefore preferred to first give birth and then kill the child (Ono Reference Takeo1932, p. 102). Ethically, people did not necessarily draw clear lines between the two interventions. Those ready to abort a late-term fetus were likely to deny the full humanity of newborn children as well (Drixler Reference Drixler2013, pp. 47–60).
There is only so much the published stillbirth statistics can tell us about the motives of parents. Sex selection played a role, but among my best estimate of 2.1 million infanticides and abortions hidden in plain sight, there were only 210,000 more dead girls than one would expect if parents took no account of the child's sex. What of the relative importance of economic and cultural factors? In earlier centuries, infanticide was practiced by both rich and poor (see Drixler Reference Drixler2013, pp. 73–89). While this could in theory have changed by the 1890s, some local stillbirth rates are simply too high to be the work of the poor alone. Areas where false stillbirths exceeded a sixth of all births formed clusters, typically fading out from a center with very high rates (see Figures 1 and 2). This is the pattern we would expect to see if attitudes to infanticide were socially determined, challenged or perpetuated in predominantly local conversations.Footnote 39
By 1900, areas with high and low frequencies of infanticide may have had a different social consensus on what conditions justified killing a baby. Within the high-intensity clusters, the well-documented eighteenth-century culture of raising only three children may have persisted into the twentieth century, in varying degrees. In the low-intensity areas, it is possible that the social consensus only tolerated infanticides in particularly pressing circumstances: a family in serious economic difficulties; a fourth daughter born into a family without sons; or a child with an especially bad horoscope. Validation of this hypothesis would require an analysis of individual stillbirth reports in their household context. Based on aggregate data as it is, this article can do no more than outline this possibility as a question for future research.
CONCLUSIONS
SBRs outside Japan have rarely exceeded 6 percent. That in some Japanese districts more than a third of babies were reported stillborn has therefore required an explanation. SBRs within Japan are not correlated with the known geography of physical wellbeing. Correlations aside, none of the factors considered here can account for Japanese SBRs higher than about 7 percent even in the areas worst afflicted with syphilis. There is on the other hand conclusive evidence that many ostensible stillbirths were in fact infanticides and abortions.
The methodology employed here to estimate how many infanticides and late-term abortions found their way into the statistical yearbooks has two important limitations. First, it can only establish a minimum rate of post-conception family planning; many infanticides and abortions may have remained unreported altogether. Second, within the overall estimate, my approach cannot settle what the exact balance of infanticides and abortions was, beyond computing a minimum number of infanticides and noting that there are good reasons to think that they far outnumbered late-term abortions.
Nationally, the rate of infanticide and abortion captured in the statistical yearbooks peaked at between 4 and 6 percent, depending on our assumptions. This estimate represents an average of regions like southern Kyushu, where very few false stillbirths were filed; and others like the East Kantō, where depending on the district, 10 to 40 percent of children were aborted or killed at birth in the 1890s and then reported as stillborn. False stillbirths in Japan were highly concentrated geographically. For example, in 1897, one third of the national total was filed in just 4 percent of Japan's districts with just 4 percent of the country's live births.Footnote 40 In such areas, infanticide remained a mainstream form of family planning into the 1910s.
Because this finding diverges so sharply from the views of some of the most influential historical demographers and economic historians of Japan, the focus of this article has been on testing alternative hypotheses and on quantifying how many infanticides and abortions have left a trace in Japan's stillbirth statistics. That their number was so large and so unevenly distributed has, however, implications for several fields of inquiry.
In the longstanding debate about the relative role of ideas and material circumstances in demographic change, the most fruitful approach is to examine their interplay in specific settings. In Imperial Japan, I have been unable to explain the variation in stillbirth rates by variation in biological and economic factors. This alone does not prove that ideas were the determining factor, but my findings are consistent with the view that attitudes—about the ethics of infanticide and abortion, about the ideal family composition, and about the relationship between state and subjects—determined how many children parents would do away with, and how many of these children would enter Japan's vital statistics as a stillbirth.
While infanticides have been a normal part of many reproductive cultures, reporting them as stillbirths may have been a peculiar Japanese phenomenon. The political culture of Tokugawa Japan often gave subordinate units de facto autonomy as long as they ceremonially acknowledged the authority of their superiors (Roberts Reference Roberts2012). It is likely that in some areas of life, this peculiar balancing of hierarchy and self-determination persisted into the twentieth century. By filing a stillbirth report, a father who had just killed a newborn child may have formally acknowledged the state's right to monitor the reproductive lives of its subjects, in the confident expectation that the authorities would reciprocate by not interferring in the affairs of his household. The function of statistics in such a society was not just to render the population legible to the state; they also served as a stage on which subjects could assert their own spaces of autonomy. A century later, this arrangement allows us to reconstruct a demographic phenomenon that would have remained invisible in the absence of falsified statistics.
Stillbirths Rates in Japan and the World, 1578–2010


* Includes some neonatal deaths
† figures for the entire period given, not single years, quinquennia, or decades.
m Year range includes missing years
Surveys of multiple territories or in bold type.
Note:
The table shows the recorded stillbirth rate in the highest year, quinquennium, or decade for 470 states and regions before 1950, as well as global surveys in 2000 and 2009 and a sampling of non-state pre-modern sources. Most figures on which this table is based are annual, so that the average stillbirth rate frequently falls far below the highest rate indicated here.
Sources:
Ackermann (Reference Ackermann1850, p. 167); Academia Sinica (n.d., accessed 2015); Anonymous (1790, pp. 608–11); von Attenhoffer (Reference von Attenhoffer1817, pp. 91–92); Becher (Reference Becher1841, pp. 207–08, 1846, pp. 206–07); Bodio (Reference Bodio1884, pp. 220, 223, 231, 235); Chinoy (Reference Chinoy1902, p. 44); Costa (Reference Costa2004, p. 1066); von Czoernig (Reference von Czoernig1873, p. 52); Engeltrum (Reference Engeltrum1830, pp. 9–50); Ferreira da Silva (Reference Ferreira da Silva1893, p. 118); Fickelscherer (Reference Fickelscherer1783); Figuerola (Reference Figuerola1849); Fosalba (Reference Fosalba1914, p. 105); France 1861, 1863, 1870, and 1872; Frantz (Reference Frantz1864, p. 48); Fujisawa Chōshi Hensan Iinkai (Reference Chōshi and Iinkai1979, pp. 514–18); Galley (Reference Galley2008, p. 81); Gottstein (Reference Gottstein1906, pp. 7–13); Götzinger (Reference Götzinger1786, pp. 330–42); Hügel (Reference Hügel1863, pp. 240, 311, 379); Hupel (Reference Hupel1777, pp. 25–28); Jordan (Reference Jordan1889, p. 30); Kaiserliches Statistisches Amt (1892, pp. 176–77, 1898, p. 12); Kisskalt (Reference Kisskalt1921, p. 448); Kitō (Reference Kitō1972); Knapp (Reference Knapp1872); Kolb (Reference Kolb1883, p. 88); Kopp (Reference Kopp1812, pp. 296–305); von Kőrösy (Reference von Kőrösy1898, p. 43); van Lieburg and Kloosterman (1987); Locher-Balber (Reference Locher-Balber1826, p. 54); Mallet (Reference Mallet1836, pp. 323–28); Manderson (Reference Manderson2002, p. 57); Martinez (Reference Martinez1888, p. 67); Memminger (Reference Memminger1824, p. 137); Municipalidad de la Capital (1892, pp. 45, 159, 1894, pp. 22, 79); Neefe (Reference Neefe1874, pp. 217–21); Ohara (Reference Shin1960, pp. 106–17); Pfeiffer (Reference Pfeiffer1902, p. 29); Quetelet (Reference Quetelet1835, pp. 122–26); Rose (Reference Rose1902, p. 82); Rothenbacher (Reference Rothenbacher2002); Sawayama (Reference Mikako1998, p. 135, Reference Mikako2010, p. 64); Schlözer (Reference Schlözer1779, p. 124); Schmidl and Warhanek (Reference Schmidl and Warhanek1857, p. 206); Secção de Estatistica Demographo-Sanitaria (1908, pp. 12, 15); Statistische Zentralkommission (Reference Zentralkommission1853, p. 44); Statistisches Bureau zu Berlin (1855, pp. 146–47); Stein (Reference Stein1819, pp. 189, 239, 276); Streit und Zimmermann (1790, p. 190); Süßmilch and Baumann (Reference Süßmilch and Jacob Baumann1798, pp. 5, 8, 19–20, 52–53); Tenon (Reference Tenon1816, pp. 260–68); Titius (Reference Titius1782, p. 292); Ulrich (Reference Ulrich1989); United Nations (Reference Nations1954); Uttley (Reference Uttley1961, p. 73); Wappäus (Reference Wappäus1861, pp. 187–94); Westergaard (Reference Westergaard1901, p. 329); Woods (Reference Woods2009, p. 92); Yong and Wang (Reference Cai and Feng2005); Yūshōdō Firumu Shuppan (1963–79); Zeller von Zellenberg (Reference Zeller von Zellenberg1803); Zupan, AÅhman, and World Health Organization (Reference Zupan and AÅhman2006).