Introduction
The detection of remnant prey DNA in the digestive system or feces of predators has proved an excellent means to elucidate trophic relationships in taxa where traditional diet analysis methods, such as visual examination of stomach contents or feces, are impossible. For example, most terrestrial invertebrate predators are fluid feeders, thus there are rarely visually identifiable features in their digestive tracts (Symondson, Reference Symondson2002). For these taxa, there has been a sharp increase in studies utilizing DNA-based prey identification methods in recent years (see Harper et al., Reference Harper, King, Dodd, Harwood, Glen, Bruford and Symondson2005 and references therein). Additionally, in vertebrate taxa where traditional methods are largely applicable in many instances, DNA-based methods have been used to augment traditional analyses (e.g. Purcell et al., Reference Purcell, Mackey, LaHood, Huber and Park2004; Poulakakis et al., Reference Poulakakis, Lymberakis, Paragamian and Mylonas2005; Casper et al., Reference Casper, Jarman, Gales and Hindell2007). They have also been promoted as useful where traditional methods are not possible, as they are not bound by some of the methodological (Jarman et al., Reference Jarman, Deagle and Gales2004) or, in the case of molecular examination of feces, ethical constraints of traditional methods.
There is certainly scope to use a variety of molecular methodologies for detecting prey DNA in diet samples (e.g. hybridization array methods, pyro sequencing and others); however, at present, polymerase chain reaction (PCR) approaches are favored because of their sensitivity and accessibility. Since prey DNA in diet samples is generally present in low quantities and is usually of poor quality (Deagle et al., Reference Deagle, Eveson and Jarman2006), small fragments of multi-copy genes are the preferred target for PCR (Symondson, Reference Symondson2002). Mitochondrial DNA (mtDNA) is often used as a target to design, more or less, specific primers for prey detection because of its high copy number per cell and the relative ease of acquiring sequences either from databases or by generating and sequencing of PCR products utilizing reliable ‘universal’ primers.
Although multi-copy genes are useful in that they increase the likelihood of prey detection, the presence of multiple templates can also cause problems with downstream analysis. PCR of degraded DNA, in general, may produce chimeric sequences, and analysis of mtDNA may be complicated by mtDNA heteroplasmy (Rubinoff et al., Reference Rubinoff, Cameron and Will2006). This study focuses on the potential confounding effects in dietary studies of amplification of copies of mtDNA integrated into the nuclear genome, otherwise known as nuclear mitochondrial pseudogenes (NUMTs) (Lopez et al., Reference Lopez, Yuhki, Masuda, Modi and O'brien1994). In instances where primers are designed for a single species and tested widely for lack of cross reactivity, it is possible to be confident that primers are avoiding NUMTs of non-target taxa. However, some recent methods, intended for generalist predators and those where little a priori knowledge of diet is known, advocate excluding predator DNA from less specific ‘universal’ primers (e.g. Blankenship & Yayanos, Reference Blankenship and Yayanos2005; Dunshea,in review) or use of ‘group specific’ (i.e. familial, ordinal, etc.) primers (e.g. Jarman et al., Reference Jarman, Deagle and Gales2004) that avoid predator DNA. While these techniques may be powerful and potentially less biased than more targeted assays for general diet descriptions, they also have scope to amplify NUMTs either from predator or prey genomic DNA. This may lead to false positives in the case where positive results are scored by amplification signal or fragment size, or lead to confounded interpretation of DNA sequence data, as NUMT sequences are divergent (sometimes markedly so) from their mtDNA paralogues (Bensasson et al., Reference Bensasson, Zhang, Hartl and Hewitt2001). If protein coding genes are targeted, there is some scope to recognize NUMTs in sequence data relatively easily by examining codons for frameshift mutations and/or stop codons (Collura & Stewart, Reference Collura and Stewart1995). However, where mitochondrial ribosomal genes are targeted, it may be more difficult to identify sequences as having NUMT origin (Perna & Kocher, Reference Perna and Kocher1996). This is particularly true in taxa where there may be limited comparative data to include in subsequent sequence analyses.
Here, we report NUMTs recovered from predator exclusion/universal primer assays of fecal samples from free-ranging bottlenose dolphins (Tursiops truncatus). It should, initially, be pointed out that these analyses have identified 19 different prey species from these predators (data not shown) and are, as far as we know, the first to allow species level insight of prey of a live free-ranging odontocete cetacean, excluding direct observation. Thus, although some analytical problems have arisen from the amplification of NUMTs, these assay techniques are, nonetheless, powerful for a generalist predator where few other options for the specific study of live animal diet are available. As the NUMTs amplified (and not the prey detected) are the focus of this study, we will refer mainly to these sequences. Our aim in presenting these results was to present evidence of NUMT origin of these sequences, examine the characteristics of NUMTs and prey DNA amplified in relation to PCR cycling, determine NUMT sequence characteristics compared to their mtDNA paralogues and their closest BLAST matches, and to suggest ways to recognize and avoid NUMTs in dietary analyses. Although this study focuses on vertebrate prey from a vertebrate predator, the ramifications of these results are relevant to any DNA-based diet study targeting mtDNA with primers intended for taxonomic groups above the species level.
Materials and methods
Sample collection and analysis
Fecal samples were collected from live T. truncatus (n=15) from Sarasota Bay, Florida, when they were captured as part of the long-term monitoring of the Sarasota Dolphin Research Program (Wells et al., Reference Wells, Rhinehart, Hansen, Sweeny, Townsend, Stone, Casper, Scott, Hohn and Rowles2004). Samples were stored for the day at 4°C, until they were able to be fixed by addition of 100% molecular grade ethanol in the evening. Samples were then stored at −20°C until DNA was extracted with the QIAamp DNA Stool Mini Kit (QIAGEN) according to manufacturer's instructions. Prior to the selection of roughly 200 mg of fecal slurry for DNA extraction, samples were vigorously shaken for 5 min to homogenate the fecal matter. DNA extractions were performed in a single batch with a blank (no starting material) extraction to monitor for cross-over contamination.
Samples were analyzed as per Dunshea (submitted). Briefly, conserved primers for taxa from arthropods through to chordates were designed and empirically trialed across different animal phyla for a small section (190–250 bp) of 16S mtDNA. A mixture of equal concentrations of the following forward and reverse primers were used (5′–3′): forward: 16SPLSUFwdmix: AAGACCCTGTGGAGCTT, AAGACCCTATAAAGCTT, AAGACCCTATGGAGCTT, AAGACCCTGCGGAGCTT, AAGACCCTAATGAGCTT, AAGACCCTATAGAGCTT, AAGACCCTRHDRAGCTT; reverse: 16SPLSURvmix: RRATTRCGCTGTTATCCCT, RRATCRYGCTGTTATCCCT. In predator DNA within the 16SPLSU amplicon region, there is a recognition site for the eight-base pair-cutter restriction endonuclease Pac I; this same restriction site is predominately absent within the amplicon of most other higher taxa and, thus, digesting scat derived DNA from these predators with Pac I excludes predator DNA from forming mtDNA amplicons and leaves prey DNA intact for amplification and further analysis (Dunshea, in review). Scat derived DNA was subjected to Pac I (NEB) digestion according to manufacturers instructions in 45 μl using 34 μl of template DNA and 5 units of enzyme for 16 h. The enzyme was heat inactivated and 2.5 μl of digested product was directly amplified with the above 16S mtDNA primers in reaction and thermocycling conditions as follows: 0.4 μM each of 16 SPLSUFwdmix and 16 SPLSURvmix, 1X AmpliTaq® Gold Buffer (Applied Biosystems), 2 mM Mg2+, 1X BSA (New England Biolabs), 100 μM dNTPs, 0.75 units AmpliTaq® Gold DNA polymerase (Applied Biosystems) and 0.05X SYBR® green (Invitrogen) in a 25 μl total volume. PCR thermocycling conditions were an initial denaturation at 95°C for 7.5 min followed by repeated cycles of 95°C for 15 s, 52°C for 45 s and 72°C for 45 s. Scat PCR amplifications were conducted on a Real Time PCR thermocycler and associated software (Chromo4™ detection system; MJ research) and stopped within the exponential phase (usually between 15 and 25 cycles) in order to minimise PCR drift (Huber et al., Reference Huber, Butterfield and Baross2002). PCR of the blank DNA extraction yielded no amplification signal over 35 PCR cycles as did PCR negative controls. After thermocycling all PCRs were incubated at 72°C for 20 min to ensure generation of a single deoxyadenosine on the 3′ ends of PCR products to facilitate cloning. PCR products were cleaned up using minelute spin columns (QIAGEN), as per manufacturers' instructions and subjected to a further restriction digestion using Pac I as above before cloning. Cloning was performed direct from the post-PCR Pac I digestion (after heat inactivation) using the TOPO® TA cloning system (Invitrogen) with vector pCR® 2.1 using half reactions of manufacturers' instructions. Positive transformants were picked into 50 μl of ultra-pure water and heat-lyzed at 95°C for 5 min before freezing.
To identify and avoid sequencing identical clones, screening of 19–20 clones from each library was performed using single strand conformational polymorphism (SSCP) analysis on directly amplified 16S mtDNA clones, with identical reaction/thermocycling conditions as above and 5 ul of clone lysate for template. This also gave a sample of proportions of different clones within each library. Here, SSCP nondenaturing polyacrylamide gels (12 cm×8 cm) were cast using 1X MDE® (BMA; Rockland, Maine), 0.5X TBE and 5 ul of 16S PCR product from each clone was subjected to electrophoresis according to manufacturers' instructions at a constant wattage (6W) for 12 h in 0.5X TBE at 15°C. Run gels were stained in 200 ml 0.5X TBE, 50% glycerol, 0.5X SYBR® gold for 20 min and photographed. Identical banding patterns were identified by analyzing photos visually and using Image J software. Representative sequences of variant clones from each sample library were sequenced by direct sequencing of PCR amplified vector inserts using pCR® 2.1 vector specific primers ((5′–3′) TOPO_F: GCC GCC AGT GTG ATG GAT A and TOPO_R: TCG GAT CCA CTA GTA ACG) and 5 μl of clone lysate for template DNA in identical reaction and thermocycling conditions to those for 16SPLSUFw/16SPLSURv primers, using 35 cycles. Appropriate controls were included in both SSCP 16S PCRS and TOPO sequencing PCRs. Sequencing of isopropanol cleaned up (Sambrook et al., Reference Sambrook, Fritsch and Maniatis1989) TOPO PCR products was carried out using a commercial service (Macrogen Inc.).
Sequence scoring and analysis
Sequences were trimmed to exclude primer sequence and edited by eye using Chromas Pro. If sequences were grouped together as contigs in Chromas Pro using default settings then chromatograms were examined concurrently during editing. Polymorphic sites were confirmed by examining their position in chromatograms. It was during this stage that similar spurious sequences (putative NUMTs now termed ‘pNUMTs’) between samples were noted. Subsequent BLAST searches with these pNUMTs indicated a cetacean origin (see below). Due to the possibility of obtaining chimeric sequences from PCR of degraded DNA, we examined each of the pNUMT sequences using software designed to detect chimeras (CCode; Gonzalez et al., Reference Gonzalez, Zimmermann and Saiz-Jimenez2004) and found no evidence to suggest they were of chimeric origin under a variety of scenarios comparing them with predator and recovered prey sequences (data not shown). We conservatively estimated that pNUMT sequences from the same library were identical if they had ⩽2 substitutions difference, since multiple clones of the same sequence may differ by single substitutions due to Taq polymerase error (Thalmann et al., Reference Thalmann, Hebler, Poinar, Paabo and Vigilant2004). A proportion of pNUMTs in each clone library was scored as the proportion of pNUMTs in sampled clones. To examine the effect of PCR cycling characteristics on prey and pNUMT diversity and abundance, the relationship between the threshold PCR cycle (set at 10× above the standard deviation of the average baseline in early PCR cycles) and prey diversity, pNUMT diversity and proportion of pNUMTs in libraries was tested by Kendall Tau correlation implemented in R (R Core Development Team, 2006).
To examine the phylogenetic affinities that the pNUMT haplotypes displayed, we aligned pNUMT sequences to the amplicon region from all the mammalian full mitochondrial genomes represented on genbank (89 genome sequences from 86 species in all major mammalian lineages). Visual inspection of the alignment in INDEL regions revealed no obvious mistakes. This alignment was then used to create consensus phylogenetic trees by bootstrapping (1000 replicates) under the Kimura 2 parameter substitution model and gap handling by pairwise deletion utilizing neighbor joining and minimum evolution tree building methods in MEGA 3.1 (Kumar et al., Reference Kumar, Tamura and Nei2004). In these analyses, the pNUMT sequences consistently grouped on the same branch as cetacean sequences and the pNUMT/cetacean branch nodes were well supported by bootstrapping (81–87%, data not shown). To further examine the relative relationship between the pNUMTs and cetaceans, we downloaded all available cetacean 16S sequences within the region of interest, as well as some other laurasiatherian mammal sequences to serve as outgroups, and aligned them along with the pNUMT sequences in MUSCLE (Edgar, Reference Edgar2004). We used sequences from completely sequenced mitochondria where available. MEGA 3.1 was also used to calculate nucleotide differences and Kimura 2 parameter distances. We examined positions of substitutions in pNUMTs in relation to regions conserved across mammals by aligning the amplicon region from the full mitochondrial genomes of mammals represented on genbank (as above) and scoring the conserved nucleotide positions at least 1 bp away from INDEL regions, with the implication that these conserved regions across all mammals are functionally constrained in true mtDNA (Burk et al., Reference Burk, Douzery and Springer2002). We then examined the homologous sites in pNUMTs for substitutions. This analysis was done by eye by viewing conserved and variable regions, firstly for mammals, then mammals and each pNUMT haplotype, in BioEdit.
Confirmation of NUMT origin of spurious sequences
We were able to confirm the pseudogene origin of most of the spurious sequences obtained in this study post hoc, from a separate study sequencing the genome of the Atlantic bottlenose dolphin (Tursiops truncatus). Draft sequences of the T. truncatus whole genome sequencing project became available after the above sequence analyses were complete. We used the BLAST algorithm to reference our spurious sequences against the available whole genome shotgun draft sequences for T. truncatus on the NCBI genome search website. The BLAST score, coverage and maximum identity score of each spurious sequence were noted.
Results
pNUMT frequencies, proportions and PCR characteristics
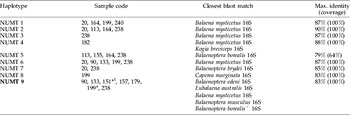
From 15 clone libraries (one per sample) 32 pNUMT sequences were identified consisting of nine different haplotypes, eight where a single identical sequence was detected and one where two other sequences differed by one base pair (table 1). Five pNUMT haplotypes were shared between at least four samples, one between two samples and three were unique to one sample (table 1). Despite the presence of markedly divergent haplotypes (see below), six of nine haplotypes scored the highest BLAST score with Balaena mysticetus. Other haplotypes scored highest with other mysticete cetaceans, except haplotype 4, which scored equally with Balaena mysticetus and an odontocete cetacean, Kogia breviceps (table 1). The number of pNUMT haplotypes per sample varied from 0 to 5; two samples contained no pNUMTs, nine contained ⩽2 haplotypes and the remaining four samples contained >2 haplotypes.
Summary of the occurrence between samples of all recovered putative NUMT haplotypes and their BLAST closest matches.

* Haplotypes from these samples varied by one substitution (transition) from the NUMT 9 haplotype matched by all others; 1This sample had one haplotype, the exact match as pNUMT 9 as well as one variant. + This match was the closest BLAST match to the variant (* &*1) NUMT 9 haplotypes.
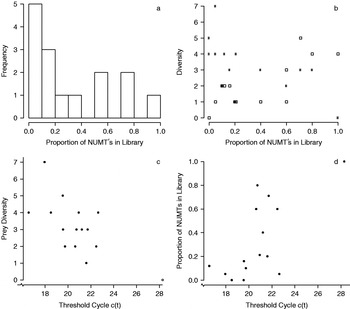
Proportions of pNUMTs within libraries varied from none in two samples to 100% pNUMTs in one library (fig. 1a). The latter library was created from a sample from a dolphin calf <3 years old. The majority of libraries (8 of 15) contained <20% pNUMTs (fig. 1a) and the number of pNUMT haplotypes detected per sample increased while the number of prey species detected per sample decreased as the proportion of pNUMTs in the library increased (fig. 1b). In terms of PCR cycling characteristics, there was a negative correlation between the number of prey species discovered and the PCR threshold cycle (tau=−0.45, Z=−2.24, P=0.03) (fig. 1c) and a positive correlation between the proportions of pNUMTs in libraries and PCR threshold cycle (tau=0.44, Z=2.29, P=0.02) (fig. 1d), but no correlation between the number of pNUMT haplotypes per sample and PCR threshold cycle (tau=0.2, Z=0.98, P=0.32). Thus, the later in PCR cycling an amplification signal was detected, the more likely a library was to contain fewer prey species and a higher proportion of pNUMTs.
Characteristics of putative NUMTs recovered from all samples. (a) Frequency histogram of the proportion of putative NUMTs in the clone library from each sample (n=15); first category from 0–0.1 includes libraries with no pNUMTs. (b) Relationship between the proportion of putative NUMTs in the library (x-axis) and (●) the diversity of prey species identifiable and (□) putative NUMT haplotypes (y-axis). These relationships were not statistically tested as the variables are not independent. (c) Relationship between the threshold PCR cycle of the 16S PCR used to amplify prey DNA (x-axis) and the diversity of the prey species identified (y-axis) (Kendell Tau correlation: tau=−0.45, Z=−2.24, P=0.03). (d) Relationship between the threshold PCR cycle of the 16S PCR used to amplify prey DNA (x-axis) and the proportion of putative NUMTs in libraries (y-axis) (Kendell Tau correlation: tau=0.44, Z=2.29, P=0.02).

NUMT sequence characteristics, phylogenetic analysis and substitution pattern
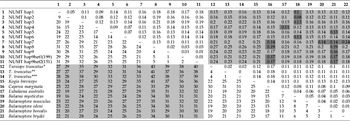
The number of pairwise nucleotide differences between the pNUMTs, T. truncatus and the closest GenBank matches to the pNUMTs was substantial, as were sequence divergences estimated by genetic distance (table 2). The pNUMTs differed by 27–43 substitutions compared to the true mtDNA of T. truncatus and by 16–41 substitutions to the true mtDNA of other closely matching cetaceans from BLAST searches. It is interesting to note that the closest matching sequences from BLAST searches of each pNUMT haplotype are not necessarily the least divergent sequences as shown by sequence alignment and calculation of sequence divergence metrics (tables 1 and 2). All pNUMT haplotypes except NUMT 4 and NUMT 9 show congruence between the closest BLAST match and the least divergent cetacean mtDNA as estimated in table 2. Haplotypes NUMT 4 and NUMT 9 show greater similarity to some cetacean mtDNA that is not indicated at all in BLAST searches of these haplotypes (e.g. NUMT 4 is less divergent from Eubalaena australis and all Balaenoptera spp. included in the analysis than Kogia breviceps; one of the closest BLAST matches as indicated in table 1), and these taxa did not feature in BLAST results.
Number of pairwise nucleotide differences (bottom diagonal) and pairwise genetic distances, as estimated by the Kimura 2 parameter substitution model (top diagonal) between suspected NUMT sequences, T. truncatus and the closest BLAST match of the suspected NUMTs.

Light grey shaded areas are the pairwise comparisons between suspected NUMTs and true cetacean mtDNA. Dark grey shaded areas are the lowest genetic distance estimate(s) of each suspected NUMT. *, **, *** These sequences from T. truncatus are all from different individuals represented on GenBank.
There were 40 homologous nucleotide positions at least 1 bp away from alignment gaps conserved across all mammals in the amplicon region and all but one pNUMT haplotype (NUMT 6; 0 substitutions) had 2–4 substitutions (2.5±1; mean±C.I.) within these positions. Haplotype NUMT 1 had a four base pair deletion in addition to three other substitutions within conserved regions. All pNUMT haplotypes were less divergent from at least one of the other pNUMT haplotypes than from the mtDNA of any closely matching cetacean and also less divergent from mysticete cetaceans as opposed to T. truncatus (table 2).
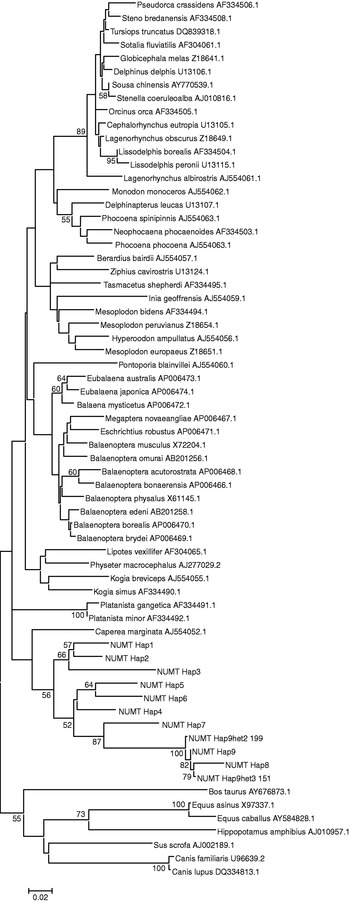
We attempted to address the relationship of the pNUMT haplotypes to cetacean mtDNA sequences by constructing phylogenies by relatively simple methods. The phylogeny produced using the minimum evolution method (fig. 2) had the same results as a neighbor joining phylogeny in relation to the position of the pNUMTs; that is, they grouped outside of the major cetacean clade (fig. 2), except that the minimum evolution method resulted in Caperea marginata being grouped in the pNUMT clade and a neighbor joining analysis did not. This analysis reveals that the amplicon region(s) of cetacean true mtDNA are more closely related to other cetacean mtDNA than to the pNUMT haplotypes and, similarly, that the NUMT haplotypes are more closely related to each other than to any true cetacean mtDNA.
Minimum evolution phylogenetic tree displaying the relationship between putative NUMT haplotypes and cetacean mtDNA. Other laurasiatherian mtDNA was used for an outgroup (bottom seven branches). Topology was tested by bootstrapping with 1000 replications, and the consensus tree is shown. Only values at nodes with a bootstrap score of >50% are shown. Note the grouping of all putative NUMT haplotypes within the major cetacean clade in relation to the outgroup but still distal to and highly diverged from the majority of cetaceans. GenBank accession numbers are displayed after species name.

Confirmation of NUMT origin of sequences
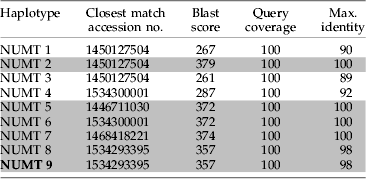
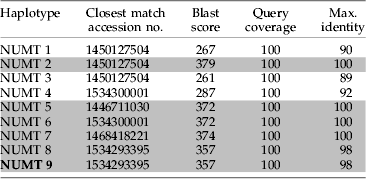
We found homologues in draft sequences from the recently initiated Tursiops truncatus whole genome sequencing project for six of nine of the pNUMT haplotypes recovered from fecal samples in this study (table 3). Four of the pNUMT haplotypes had an exact match in the draft genome sequences and two closely related haplotypes (NUMT 8 and NUMT 9) had matches of 98% to the same sequence from the draft whole genome shotgun sequence database (table 3). The remaining three pNUMT haplotypes had a closest match from the draft genome sequences of ⩽92% of homologous nucleotide positions. Two of the three pNUMT haplotypes with no close match from the draft genome sequence database were also haplotypes that only occurred in one fecal sample (tables 1 and 3).
Results of referencing spurious sequences obtained from fecal samples in this study against Tursiops truncatus draft whole genome shotgun sequences on GenBank by the BLAST algorithm. Grey shading denotes homologous matches of ≥98%.
Discussion
The prevalence of NUMTs is highly variable between taxa (Richly & Leister, Reference Richly and Leister2004), and they have been identified in at least 82 species thus far in all major eukaryotic lineages (Bensasson et al., Reference Bensasson, Zhang, Hartl and Hewitt2001). We present evidence that NUMTs have been recovered from fecal samples of Tursiops truncatus as an unintended consequence of using non-specific primers for dietary analyses. The most convincing evidence was the matches of multiple pNUMT haplotypes to draft sequences from the Tursiops truncatus whole genome sequencing project. Of course, this analysis was only available to us post hoc, and it is highly unlikely that such a resource would be available for the vast majority of projects undertaking DNA-based diet analyses. Four other lines of evidence, considered together, suggest the spurious mammalian sequences are of pseudogene origin, or at least given a NUMT origin, allow an alternate explanation for their presence. Firstly, all pNUMT sequences apart from haplotype pNUMT 6 have multiple substitutions (and a four base pair deletion: pNUMT 1) in sites conserved across true 16S mtDNA in all mammalian lineages that are in stem regions important for maintenance of predicted mammalian 16S rRNA secondary structure (as predicted by Burk et al., Reference Burk, Douzery and Springer2002). This strongly suggests these haplotypes are not functional ribosomal DNA. Secondly, the phylogenetic similarity of all pNUMT sequences was difficult to reconcile with any cetacean sub-group or the known prey of T. truncatus, despite their supported affinity to cetacean 16S mtDNA when comparing across Mammalia. Third, the same haplotypes were recovered from multiple samples for six of the nine pNUMT haplotypes which, apart from indicating common ancestry (Zischler, Reference Zischler2000), also indicates the reliability of the sequences being true NUMTs, as opposed to in vitro recombinants of native mtDNA and NUMTs or of two NUMTs (Thalmann et al., Reference Thalmann, Hebler, Poinar, Paabo and Vigilant2004). In their study of NUMTs in great apes, Thalmann et al. (Reference Thalmann, Hebler, Poinar, Paabo and Vigilant2004) discard any putative NUMT sequence that only occurs in one sample, as it may have been formed from recombinants. However, in this study, we are interested in the effect of NUMTs on dietary analyses regardless of their origin (i.e. recombinant or chromosomal), so these sequences are retained for further consideration. Lastly, there are very few substitution differences between pNUMT 8 and pNUMT 9 and these haplotypes are present in the same sample. There are also variants from the same sample (sample 151) in pNUMT 9 that are attributable to Taq polymerase. An alternate possibility for these haplotypes and variants in the same individual is that they are both alleles from a heterozygote at this NUMT locus, though we have chosen the more conservative explanation. Taken on their own, points three and four, regarding shared haplotypes between samples and similar haplotypes within samples, are not evidence of NUMT origin. However, if points one and two were considered on their own, without assessing shared haplotypes between samples (point three), there is the possibility that the spurious sequences could be PCR artefacts such as chimeras (that were unable to be detected from the chimera detection software) or some other PCR artefact from amplifying highly degraded DNA. Considering the fourth point of similar haplotypes within samples in terms of NUMTs gives another plausible explanation for these variants in the samples, but does not offer proof that the haplotypes are NUMTs in themselves. Thus, even without the benefit of having draft genome sequences available, the weight of evidence would suggest that the pNUMT haplotypes reported here are predominately real NUMTs.
Had we initially failed to identify our spurious sequences of mammal origin as real NUMTs in our study system, we could nonetheless be confident that bottlenose dolphins were not preying on other cetaceans, through both prior knowledge of diet and functional morphology and also because cetacean 16S mtDNA has been thoroughly sampled and is well represented on databases. Such prior knowledge and comprehensive databases will not always be available for many DNA-based diet studies. Indeed, in many study systems where these methods are advocated, there is a paucity of comparative data both for predator and potential prey taxa (e.g. deep sea ecology, Blankenship & Yayanos, Reference Blankenship and Yayanos2005; soil food webs, Juen & Traugott, Reference Juen and Traugott2005).
There are two ways in which amplification of NUMTs (either from the predator or prey items) may lead to erroneous conclusions in DNA-based diet studies: misidentification of a NUMT sequence to a higher taxon and accompanying overestimates of diet diversity, and also false positives where amplification signal or amplicon size is a measure. For an example of the former, without prior knowledge of diet, if cetaceans were not a well-sampled taxon and earlier checks had not raised suspicion of NUMTs, we may have attributed the NUMT sequences to some unresolved clade in the order Cetacea, in turn increasing our estimates of prey diversity. Though the use of conserved PCR primers designed to amplify diverse templates may exacerbate amplification of NUMTs (Mirol et al., Reference Mirol, Mascheretti and Searle2000 and references therein), using primers designed specifically for a species or group does not necessarily preclude amplification of NUMTs (Thalmann et al., Reference Thalmann, Hebler, Poinar, Paabo and Vigilant2004). An example of where more specifically designed primers may lead to erroneous conclusions is provided by Harper et al. (Reference Harper, King, Dodd, Harwood, Glen, Bruford and Symondson2005). Group-specific primers were used for detection of earthworms and Arion sp. and diversity was subsequently scored by amplicon size, as different species (Arion sp.) or even individuals (earthworms) produced different size amplicons. Situations such as this demonstrate potential for NUMTs to bias results as a NUMT from one prey species may present an amplicon identical to the diagnostic size of another (in the case of Arion sp.), or NUMTs may contribute to the amplicon size diversity seen in the earthworms. Neither of these possibilities could be definitively ruled out or accounted for without pre-screening multiple individuals from each prey species with these primers in combination with cloning, etc. This is not to say that both these techniques are not without merits if appropriate assumptions are acknowledged and controls established. It is likely the primer sets used for a particular study will be a trade-off between the questions examined, the prior knowledge of both predator and probable prey phylogenetics, and the availability of authentic mtDNA sequences from the higher taxa of the predator and probable prey.
How are NUMTs to be recognized as such when ribosomal mtDNA is used for DNA-based diet analysis? One method suggested is to look for ‘unexpected phylogenetic placements’ (Bensasson et al., Reference Bensasson, Zhang, Hartl and Hewitt2001) although this is clearly not much use when trying to assign an identity to a DNA sequence and little other information is available as is the case for most DNA-based diet work. In this study, due to the prior knowledge of diet, the other cetacean sequences available and the high divergence of NUMTs to true mtDNA, this method was of some use; however, there is not always a large divergence between NUMTs and true mtDNA (Pereira & Baker, Reference Pereira and Baker2004) as the degree of divergence will depend on the relative time of integration into the nuclear genome (Woischnick & Moraes, Reference Woischnick and Moraes2002). Another method suggested is by aligning sequences to authentic mtDNA and examining where substitutions occur in the suspect sequences in relation to predicted secondary structure models and phylogenetically conserved positions (Olsen & Yoder, Reference Olsen and Yoder2002 and references therein). Again, this method proved useful in this study, though there are a number of reasons as to why it would not necessarily recognize some NUMTs (see Olsen & Yoder, Reference Olsen and Yoder2002), particularly NUMTs that are relatively recent integrations and so have not accumulated any substitutions in these regions (Sorenson & Fleischer, Reference Sorenson and Fleischer1996). Clearly, the best approach is to integrate all information available for both predator and putative prey taxa; the sequence data available from phylogenetic affiliates indicated from preliminary analyses (e.g. BLAST, although this should only be used as a guide given the discrepancies we found), substitutions in aberrant positions in relation to secondary structure and phylogenetically conserved positions and, to a lesser extent, the prevalence of common haplotypes across samples, their observed variation and how this varies with PCR cycling, though it will be difficult to distinguish common NUMT haplotypes from common prey haplotypes in many instances.
Apart from ways to recognize NUMTs during DNA-based diet analysis, there are other ways to mitigate their effects on downstream analysis. The first and most obvious is to not use non-protein coding mtDNA. Use of coding mtDNA initially appears a better option for sequence identification-based studies; however, the need for a relatively large fragment to achieve sufficient taxonomic resolution precludes their use in many circumstances (particularly ‘molecular scatology’). In some circumstances, a small DNA sequence from protein coding regions may suffice for species identifications (Hajibabaei et al. Reference Hajibabaei, Smith, Janzen, Rodriguez, Whitfield and Hebert2006), though more generally this is probably not the case. Additionally, as above, relatively recent nuclear integrations of protein coding mtDNA may not have had sufficient time to accumulate frameshift and/or stop codon mutations, nullifying the appeal of using them for ease of NUMT identification. Our data indicate one possible diagnostic for immediate suspicion in a diet analysis approach, such as the one we employed, is that of amplification signals rising in the late rounds of PCR. Although samples that amplified in the relatively early cycles still contained some NUMTs, the one sample that did amplify relatively late had 100% NUMTs and so was not of use for diet analysis. This needs more investigation and is not likely a linear relationship; yet, it may be that these samples can be discarded from any further analysis immediately.
DNA-based diet analyses hold great promise in many situations where study of specific trophic interactions is simply not feasible by other means. As far as we are aware, we have shown for the first time that sequences that are most likely NUMTs can be recovered during DNA-based diet analysis. In some cases, they made up the majority of sequences recovered. In our situation, they were relatively straightforward to diagnose; however, this may not always be the case. We recommend that mtDNA assays designed to indicate prey items by PCR signal and amplicon size go through thorough testing with multiple individuals and separation of amplicons to preclude the possibility of confounding data by amplification of NUMTs. Additionally, if sequences recovered from diet samples are used to assign identity to prey, they should be scrutinized closely with all available information and not immediately assumed to have originated from true mtDNA.
Acknowledgements
This work was funded by the Australian Government Antarctic Division. We gratefully acknowledge and thank the staff and volunteers of the Sarasota Dolphin Research Program, without whom collection and storage of these samples would not have been possible. Special thanks go to Jason Allen, Aaron Barleycorn and Brian Balmer for logistic support and sample preparation. The Sarasota Dolphin Research Program and associated sample collection is conducted under the United States Government National Marine Fisheries Service Scientific Research Permit Numbers 522-1569 and 522-1785 and Glenn Dunshea's participation is conducted under the University of Tasmania Animal Ethics Permit A8315. Thanks to Bruce Deagle for insightful discussions on this topic. We also thank two anonymous reviewers for comments that improved the quality of the manuscript. Glenn Dunshea is the recipient of an Australian Postgraduate Award and is also funded through an ANZ Ian Holsworth Wildlife Research Endowment.