Introduction
Arytenoid dislocation was first reported in 1974. Since then, a small incidence has been reported, varying from 0.023 to 6.2 per cent of the patients who received direct laryngoscopy.Reference Niwa, Nakae, Ogawa, Takashina, Hagihira and Ueyama1, Reference Mikuni, Suzuki, Takahata, Fujita, Otomo and Iwasaki2 The condition may be under-reported due to misdiagnosis as vocal fold paralysis. There has only been one large series reported.Reference Rubin, Hawkshaw, Moyer, Dean and Sataloff3, Reference Sataloff, Bough and Spiegel4 Arytenoid dislocation is usually associated with laryngotracheal intubation, using various kinds of laryngotracheal tube.Reference Niwa, Nakae, Ogawa, Takashina, Hagihira and Ueyama1, Reference Mikuni, Suzuki, Takahata, Fujita, Otomo and Iwasaki2 Patients with arytenoid dislocation usually complain of hoarseness, dysphagia, aspiration, odynophagia and stridor. The condition can occur in both adults and children, and is usually unilateral, although bilateral involvement has been reported.Reference Sataloff, Hawkshaw and Spiegel5–Reference Roberts, McQuinn and Beckerman7
The most common approach to reduction of a dislocated arytenoid often results in unfavourable and unpredictable outcomes.Reference Sataloff, Bough and Spiegel4, Reference Rosenberg, Rontal, Rontal and Lebenbom-Mansour8–Reference Talmi, Wolf, Bar-Ziv, Nusem-Horowitz and Kronenberg10 However, a few cases of successful closed reduction have been reported.Reference Rubin, Hawkshaw, Moyer, Dean and Sataloff3, Reference Stack and Ridley11–Reference Faries and Martella14
Herein, we report a series of successful closed reduction procedures performed at our institution, using a new technique. We describe dislocation characteristics, as well as the advantages of, and potential problems with, the new reduction technique.
Materials and methods
This study was approved by the ethics committee of the Faculty of Medicine, Prince of Songkla University, Hat-Yai is a major city in Songkla Province, Songkla, Thailand.
Patients
From 2003 to 2009, we recruited to the study 29 patients attending the otolaryngological out-patient department of Songklanagarind Hospital with arytenoid dislocation.
The clinical diagnosis of arytenoid dislocation was made by video fibre-optic laryngoscopy, which showed a shorter and lower vocal fold in cases of anteromedial dislocation, and a higher and longer vocal fold in cases of posterolateral dislocation, together with absence of the jostle sign.
Laryngeal electromyography was performed in six patients whose onset of disease was less than two weeks prior to presentation, in order to exclude vocal fold paralysis.
An intra-operative diagnosis of arytenoid dislocation was made by direct laryngoscopy with intra-operative arytenoid palpation.
Surgical procedure
All cases of arytenoid dislocation were treated under general anaesthesia using jet ventilation and muscle relaxants. An enlarged proximal end laryngoscope with chest support, together with an operating microscope, was used to visualise the posterior half of the glottic area.
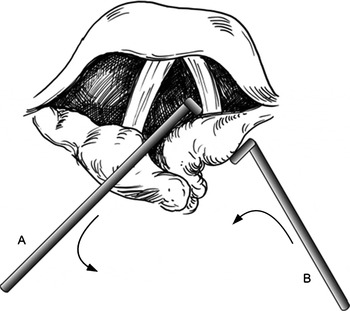
The new technique used two round, custom-made, stainless steel rods to achieve closed reduction. These were approximately 30 cm long, 1 cm in diameter at the handle, 0.3 cm in diameter along the shaft, and tapered to a dull point with a 90° bend at the end, forming a hook. The first metal rod was inserted through the glottic space and hooked under the vocal process, while the second rod was applied at the posterior aspect of the affected arytenoid (Figure 1).
Diagram showing closed reduction of an anteromedially dislocated right arytenoid. The left metal rod (A) is inserted through the glottic space to hook under the vocal process of the right arytenoid, while the right metal rod (B) is applied posteriorly. Lifting and anticlockwise rotation are performed simultaneously (arrows), until the right arytenoid and vocal fold are in their normal positions and are level, compared with the left side.

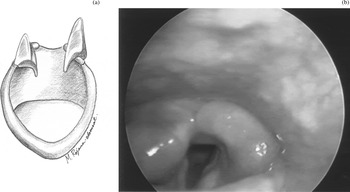
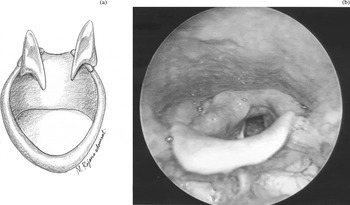
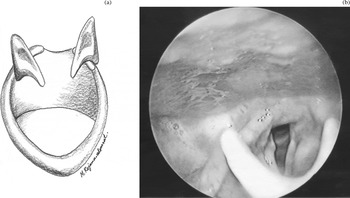
In cases of anteromedial dislocation, affected right arytenoids were lifted up and simultaneously rotated anticlockwise, while affected left arytenoids were rotated clockwise. The arytenoid tip position was then corrected by either pulling back or pushing forward, depending on whether the dislocation was subtype I or subtype III. Subtype I dislocation refers to anteromedial dislocation with the arytenoid tip in a forward position, subtype II to dislocation with the tip in a central position, and subtype III to dislocation with the tip in a backwards position (Figures 2–4).
(a) Diagram and (b) videolaryngoscopic appearance showing subtype I anteromedial dislocation of the right arytenoid. The right arytenoid is displaced anteriorly and tipped forward, and the right vocal fold is shorter and lower than that on the left side. Part (a) shows the relationship between the anteriorly displaced right arytenoid and the cricoid cartilage.

(a) Diagram and (b) videolaryngoscopic appearance showing subtype II anteromedial dislocation of the right arytenoid. The right arytenoid is displaced anteriorly, with its tip in a central position. Part (a) shows the relationship between the anteriorly displaced right arytenoid and the cricoid cartilage.

(a) Diagram and (b) videolaryngoscopic appearance showing subtype III anteromedial dislocation of the right arytenoid. The right arytenoid is displaced anteriorly and tipped backward. Part (a) shows the relationship between the anteriorly displaced right arytenoid and the cricoid cartilage.

In cases of posterolateral dislocation, the affected arytenoid was pushed forward and rotated medially.
The reduced arytenoid was then compared with the normal side as regards arytenoid contour, vocal fold length and level, and reflex movement (the latter tested by touching while the patient was under light general anaesthesia).
Systemic prednisolone was prescribed over the operative period and for one week post-operatively, together with absolute post-operative voice rest to prevent recurrent dislocation. Follow-up appointments were scheduled for one week, four weeks and nine to 12 months post-operatively.
During the first two post-operative follow-up appointments, evaluation was performed by either the authors or another otolaryngologist.
Post-operative voice assessment
Post-operatively, the patient's voice was labelled as normal if there was consensus that: (1) the affected vocal fold moved normally; (2) the patient's voice was normal (as judged by the authors or another otolaryngologist, the patient, and their relatives) compared with the pre-dislocation voice; (3) there were no voice complaints (e.g. roughness, breathiness or asthenia); and (4) there were no voice problems which affected the patient's quality of life (according to the Voice-Related Quality of Life Measure).Reference Hogikyan, Wodchis, Terrell, Bradford and Esclamado15 Patients’ global voice quality was also assessed.
The patient's voice was labelled as improved if there was consensus that the voice was better but still subnormal, and that the affected vocal fold showed sluggish movement.
The patient's voice was labelled as ‘failure’ if the reduced arytenoid showed recurrent dislocation, or if there was no improvement in the patient's voice and no appreciable vocal fold mobility.
In this study, no extra surgical intervention or voice therapy were given. We did not inject steroids or botulinum toxin into the displaced joint or adductor muscle.
Statistical analyses
Data were analysed statistically using the Statistical Package for the Social Sciences version 18.0 for Windows software program (SPSS (Thailand) Co Ltd, Bangkok, Thailand). Descriptive data are reported as mean ± standard deviation. Measures and tests of association between variables of interest were determined using the paired t-test for dependent parametric scale data, the chi-square test for independent nominal data, and the Wilcoxon signed rank test and Kruskal–Wallis test for non-parametric ordinal and scale data, respectively. Results were considered statistically significant if the p value was less than 0.05.
Results and analysis
The incidence of arytenoid dislocation in this study was 0.25 per cent of the overall otolaryngological in-patient population.
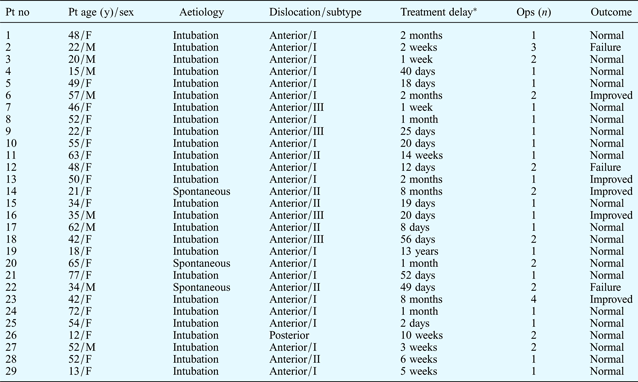
Patients and treatment profiles are shown in Table I. Twenty-one patients’ voices returned completely to normal post-operatively, including full vocal fold mobility. The reduced arytenoids showed a minimal to moderate degree of swelling at one week and one month post-operatively (Figures 5 and 6, respectively).
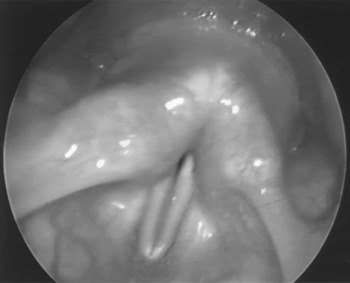
Videolaryngoscopic view of the same larynx shown in Figure 2, one week after closed reduction. The right arytenoid shows marked swelling. The mildly swollen right vocal fold is in the normal position and level, compared with the left vocal fold.

Videolaryngoscopic view of the same larynx shown in Figure 5, one month after closed reduction, in phonation. Minimal swelling of the right arytenoid can still be seen. The right vocal fold is in the normal position and is approximately level with the left vocal fold at the mid-line.

Patients and treatment profiles
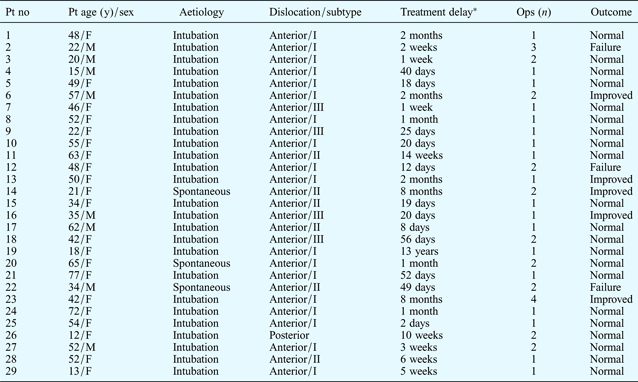
*Time from onset of symptoms to surgery. Pt = patient; no = number; y = years; ops = operations; F = female; M = male
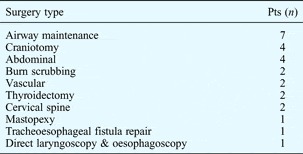
The number and types of surgical procedures performed in patients with arytenoid dislocation of endotracheal intubation origin are shown in Table II.
Surgery in patients with endotracheal intubation aetiology*

* Twenty-four cases were unrelated to recurrent laryngeal nerve paralysis. Pts = patients
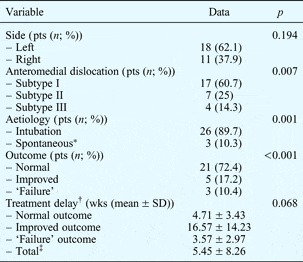
Table III shows statistical analyses for side, subtype, aetiology, outcome, and time delay from onset of the condition to surgery.
Variables of interest: data & strength of association

*No history of neck trauma or intubation (apart from severe coughing or vomiting) before onset of hoarseness. †Time interval from onset of symptoms to surgery. ‡Excluding case 19 (see Table I). Pts = patients; wks = weeks; SD = standard deviation
Patients’ post-operative scores for voice-related quality of life (both individual domain scores and overall score) and global voice quality are shown in Table IV. Long-term follow-up at 9–12 months post-operatively showed that patients were satisfied with their voice, and no speech rehabilitation or further surgical intervention was required.
Voice-related qol & global voice quality scores

Data represent means ± standard deviations unless otherwise indicated. *n = 21; †n = 21. Pre-op = pre-operative; post-op = post-operative; V-RQoL = Voice-Related Quality of Life; GVQ = global voice quality
There were no post-operative complications in any of the participating patients.
During the early part of the study, five patients had only ‘improved’ outcomes, and three closed reduction procedures failed, requiring subsequent thyroplasty to correct patients’ hoarseness and aspiration; these outcomes may have represented the effect of a ‘learning curve’.
Discussion
There is currently no ‘gold standard’ diagnostic technique for arytenoid dislocation. Rigid videolaryngoscopy, fibre-optic laryngoscopy, videostroboscopy, high resolution computed tomography (CT) and laryngeal electromyography have all been used in the clinical diagnosis of arytenoid dislocation.Reference Sataloff, Spiegel, Heuer and Hawkshaw6, Reference Dudley, Mancuso and Fonkalsrud13, Reference Hoffman, Brunberg, Winter, Sullivan and Kileny16–Reference Yin, Qiu and Stucker19
Some cases of vocal fold paresis and paralysis can mimic arytenoid dislocation, making diagnosis difficult. In our experience, with a background in radiological consultation, we have found that high resolution CT has limitations in visualising the uncalcified arytenoids of children and adults up to 40 years of age, particularly if the clinician is blinded to the clinical data and provisional diagnosis. Electromyography may show an abnormal interference pattern in cases of long-standing dislocation, as seen in 23 of our patients.
The diagnosis of arytenoid dislocation must be confirmed using direct laryngoscopy and intra-operative palpation. Diagnosis may be aided by the absence of a jostle sign and the presence of possible causes of recurrent nerve injury. During surgery, following successful closed reduction, immediate reflex movement of the arytenoid upon touching is considered a therapeutic diagnosis.
To date, reported treatments for arytenoid dislocation have included closed reduction, thyroplasty, arytenoid adduction–rotation and pin fixation; however, none has been widely accepted.Reference Sataloff, Bough and Spiegel4, Reference Sataloff, Spiegel, Heuer and Hawkshaw6, Reference Stack and Ridley11, Reference Hoffman, Brunberg, Winter, Sullivan and Kileny16 Arytenoid closed reduction is usually conducted using a laryngoscope, laryngeal forceps and laryngeal spatula.Reference Niwa, Nakae, Ogawa, Takashina, Hagihira and Ueyama1, Reference Sataloff, Bough and Spiegel4, Reference Stack and Ridley11, Reference Senoglu, Oksuz, Ugur, Dogan and Kahraman20
Our new technique has superior results to previously reported treatments, due to bimanual handling under an operating microscope and complete muscle relaxation under general anaesthesia. If reduction is not satisfactory, the surgical manoeuvre can be repeated.
Closed reduction of a posterolateral dislocation is more difficult to perform, as the posterior cricoarytenoid and interarytenoid muscles provide greater resistance to anterior arytenoid cartilage displacement, and over-reduction may occur.Reference Kasperbauer21
One pitfall of closed reduction relates to the misleading impression that the arytenoid is displaced anteriorly and rotated medially, when it is actually rotated laterally (off the midline) and must be rotated medially to achieve reduction.Reference Faries and Martella14, Reference Alexander, Lyons, Fazekas-May, Rigby, Nuss and David17, Reference Senoglu, Oksuz, Ugur, Dogan and Kahraman20, Reference Paulsen, Rudert and Tillmann22, Reference Hiong, Fung and Sudhaman23
• Arytenoid dislocation should be considered in patients with persistent hoarseness after endotracheal intubation
• A new closed reduction technique is presented: the arytenoid is lifted into a normal position using customised metal rods, under general anaesthesia
• This technique was used in 29 patients with arytenoid dislocation
• Twenty-one patients (72.4 per cent) obtained successful reduction, with normal voice and vocal fold mobility post-operatively
Closed reduction should be performed as soon as possible after arytenoid dislocation to achieve the best results. However, in our study Kruskal–Wallis analysis indicated no significant difference in outcome for procedures performed at varying times after dislocation.
Finally, it should be noted that five patients had only an ‘improved’ outcome, and three patients had a ‘failed’ outcome and required subsequent thyroplasty; these outcomes may have been influenced by a learning curve in mastering the new technique.
This study's main strength is that it represents the first report of a reliable and repeatable new technique for closed reduction of arytenoid dislocation, with a high success rate in restoring the dislocated arytenoid to its normal position.
The study's main weaknesses are the lack of post-operative evaluation by a speech therapist, and the small number of patients included.
A multi-centre study is required in order to produce sufficient data to enable widespread acceptance of this new technique.
Conclusion
Arytenoid dislocation should be excluded in every patient suffering from hoarseness following anaesthesia involving intubation or laryngeal instrumentation. Intra-operative arytenoid palpation is needed to confirm diagnosis. Closed reduction is the definitive treatment for arytenoid dislocation. A new, original and reliable surgical technique is presented and described. Most patients in this study benefitted from this new treatment, and regained normal voice and vocal fold mobility post-operatively.
Acknowledgement
We thank Mr David Patterson for assistance with English language editing.