Introduction
Genotype by environment interactions (G × E) form a potential source of inefficiency in animal breeding. This holds both in terms of worldwide genetic resource management (e.g. Anderson, 2004) and in terms of transnational programs of breeding companies. G × E is commonly experienced as a nuisance factor but it would be desirable, instead, to develop a methodology that allows for the exploitation of G × E in animal breeding. This would require detailed quantification of G × E on the individual animal level, in terms of environmental sensitivity.
Figure 1 gives a summary of data reported by Schinckel et al. (1999). In this experiment, pigs were grown to a live end weight of 115 kg, and their average daily gain is shown here. These pigs were of two genotypes (crosses between different breeds), and were raised in four environments, which differed in terms of infectiousness due to various combinations of housing and medication regimes.
Subclass means for average daily gain of pigs of two genotypes (● and ▴), raised at four levels of infectiousness. Left: the classical qualitative representation of the environmental variable on the horizontal axis. Right: quantitative representation by the overall phenotypic mean at each environmental level, with linear regression lines for each genotype. Data from Schinckel et al. (1999).

On the left-hand side of Figure 1, the subclass means are arranged in a classical G × E plot, the design of which goes back to Haldane (Reference Haldane1946). The environment (horizontal axis) is described qualitatively here, from ‘very low’ to ‘very high’ infectiousness. On the right-hand side of Figure 1, the environment is described in terms of the phenotype of all the pigs at each environmental level, averaged across the genotypes. This approach turns the horizontal axis into a quantitative one, which allows for a regression analysis (viz. the linear regression equations for each cross, in the graph) and therefore provides a concise description of each genotype in terms of the estimates of (i) its intercept (related to its growth potential) and (ii) its slope (which quantifies environmental sensitivity: the solid regression line in Figure 1 indicates a higher environmental sensitivity than the broken line). This is the ‘reaction norm’ approach described in more detail by Lynch and Walsh (Reference Lynch and Walsh1998); it provides a powerful way to quantify G × E in great detail.
For practical animal breeding purposes, an approach like this would require four adaptations. First, instead of crosses or pure breeds it would be useful to analyze families, e.g. progeny groups of individual sires. Second, the environmental classes would be defined in terms of routine herd–year–season (HYS) effects rather than experimental treatments. Third, the horizontal axis should be set up in terms of a true environmental variable rather than as a phenotypic one. Fourth, to avoid confounding, minimize bias and maximize accuracy all the parameters involved in such a system should be estimated simultaneously, taking pedigree information into account. This would produce BLUP estimated breeding values (EBV) for the performance potential (intercept) and its environmental sensitivity (slope) of each animal involved. Strandberg (2006) discusses the third and fourth issues in more detail.
In this paper, we report on such an approach, for litter size in pigs. Because this involves demanding statistics, our main focus is on the effect of data size structure and volume on the accuracy of the estimates. Second, we try to quantify the consequences of ignoring environmental sensitivity in routine breeding value estimation.
Material and methods
Data
The trait analyzed here is litter size (born dead plus alive) as recorded on sows of two breeds (PIC lines A and B) and their cross (line AB). The dataset comprises 297 518 records of 121 104 daughters of 2040 sires, recorded on 144 farms in North and Latin America, Europe, Asia and Australia, from 1993 to 2006 (with on average 4.4 years of recording per farm). This provides for a wide range of environmental effects of a climatic, nutritious, management-related and infectious nature.
These data were analyzed in three subsets, comprising (i) parity 1 records of line B sows (33 641 records of 33 641 daughters of 792 sires, recorded on 66 farms), (ii) all parity records of line B sows (113 961 records of 52 120 daughters of 1091 sires, recorded on 93 farms) and (iii) all parity records of lines A, B and AB sows (volumes as above).
This dataset was obtained after pruning a larger one to meet the criteria of at least 30 records per HYS class, 50 records per sire of the sows, five records per sire × farm × month class and two farm × month classes per sire. These criteria exclude more records in small than in large datasets.
Methods
Data analyses were carried out with the DMU program (Madsen and Jensen, Reference Madsen and Jensen2004) as extended by Su et al. (Reference Su, Madsen, Lund, Sorensen, Korsgaard and Jensen2006). This approach performs a Markov Chain Monte Carlo analysis that allows for inferring the environmental covariate and the other parameters in the model simultaneously, and for accommodating heterogeneous residual variances.
The largest dataset (all parities of lines A, B and AB sows) was analyzed with the model:

where y is litter size; Line, Parity, NI and MT are the fixed effects of line (A, B and AB), parity (1 to 8), number of inseminations preceding the litter (1, 2 and ⩾3) and mating type (AI, natural); HYS is the random effect of herd-year-season (a ‘season’ being defined as January to March or April to June); PE and bPE are the random permanent environmental effects of the intercept and slope of the reaction norms (the permanent environmental effect captures the animal-intrinsic but non-additive-genetic influence of the individual sow, which leads to repeatability of observations across parities from the same individual); and Add and b Add are the additive genetic effects of the intercept (corresponding to the classical EBV for performance potential) and slope (equivalent to the EBV for environmental sensitivity) of the reaction norms.
For the subset with records of all parities of line B sows, the Line effect was omitted from the model. For the subset with only parity 1 records of line B sows, the PE and b PE effects were also omitted.
To deal with heterogeneous residual variances, farms were classified into nine groups, using cluster analysis of the means and variances of predicted residuals, which were obtained from the routine genetic evaluation of these lines. Groups with low numbers of records were combined with one of their adjacent groups. This led to six, seven and eight groups for the smallest to largest subsets.
Results
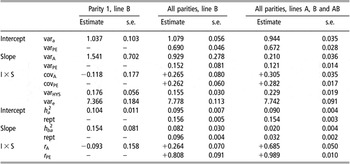
The estimated (co-)variance components and their resulting heritabilities, repeatabilities and correlations are in Table 1. As expected, larger datasets have smaller standard errors (s.e.) of variance estimates. The heritabilities are close to 0.10 for the intercept throughout, which is in line with values commonly reported for litter size in pigs (e.g. Rothschild and Bidanel, Reference Rothschild and Bidanel1998). However, the heritability of the slopes decreases from 0.15 to 0.02, accompanied by a considerable decline of the s.e.; the 0.02 ± 0.004 heritability was estimated much more precisely than the 0.15 ± 0.081 one. Consequently, the heritability estimates of the slopes do not differ significantly between the smallest and the largest subset.
(Co-)variance components of the reaction norm intercepts and slopes with their standard errors (s.e.), and the associated heritabilities (h 2), repeatabilities (rept) and correlations (r)

I × S = intercept × slope covariance.
Subscripts A, PE, HYS and e denote additive genetic, permanent environmental, HYS-related and residual components, respectively.
The genetic correlation between the intercept and the slope increases from negative in the smallest dataset to almost +0.7 in the largest dataset.
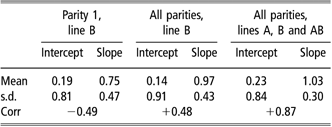
The basic statistics of the intercept and slope estimates of the reaction norms for the sires in the three data subsets are in Table 2, which shows increasing means and decreasing standard deviations (s.d.) of the slope EBVs, from left to right. However, the ratio of the variance of slope EBVs (Table 2) to the corresponding estimate of additive genetic variance (Table 1) increases with increasing data volume (from 0.472/1.54 = 0.14 via 0.432/0.93 = 0.20 to 0.302/0.21 = 0.43, from left to right), indicating an increase of accuracy. At the same time, the correlation between intercept EBVs and slope EBVs (Table 2) and the genetic correlation between intercept and slope (Table 1) both change from negative to strongly positive and become more similar to each other (from [−0.49, −0.09] via [+0.48, +0.26] to [+0.87, +0.69] from left to right). Clearly, more information leads to a lower proportion of extreme slope estimates (and particularly of negative ones), due to increased precision; see also Figure 3.
Statistics of the intercept and slope estimates of the sires in the three data subsets
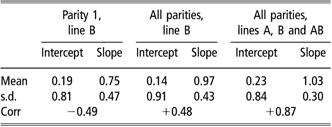
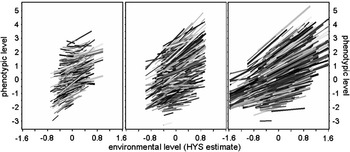
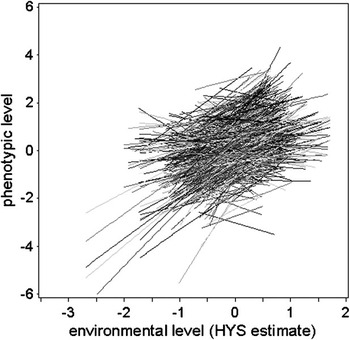
Figure 2 shows the estimated reaction norms for the sires behind the three data subsets. From left to right in Figure 2, the environmental range (horizontal axes) increases due to the inclusion of data from an increasing number of farms (66, 93 and 144, respectively) and their associated HYS classes. Furthermore, the re-ranking of sires in different environments decreases with increasing data volume.
Litter size reaction norms for the sires of sows in three data subsets. Left: parity 1 records of line B sows. Center: all parity records of line B sows. Right: all parity records of lines A, B and AB sows. Horizontal axis: the estimated environmental level of the HYS (herd–year–season) classes. Vertical axis: phenotypic performance in those environments. Each regression line represents a sire’s daughter group; heavier lines represent larger daughter groups.

Figure 3 reflects the trend that the s.e. of the individual sire slope estimates (vertical axes) reduce with increasing data volume. Similarly, the (co-)variance components in Table 1 show progressively lower s.e., particularly the slope variances.
Slope estimates (horizontal axis) and their s.e. (vertical axis) for the sires of the sows in the data subsets of Figure 2. The solid curvilinear trendlines are spline interpolation plots. Data points below the broken reference lines represent slope estimates significantly different from zero at P < 0.05, i.e. the x-value is > 1.96 as large as the y-value.

The correlation between the intercept and the slope due to the permanent environmental effect in Table 1 is extremely high (and very precisely estimated). Hence, irrespective of genetic effects, the performance of sows with a high reproductive capacity is practically always highly sensitive to environmental disturbance. Figure 2 shows the same pattern on the genetic level; both cases make it clear that for litter size, the performance of high-potential genotypes (and of high-capacity sows) will likely come down strongly when environmental conditions become unfavorable. On the other hand, genotypes with low litter size potential (and sows with low capacity) benefit considerably less from favorable conditions than their high-potential (capacity) counterparts do.
Discussion
The results in Tables 1 and 2 (and in Figures 2 and 3) indicate some clear trends due to an increase in data volume and environmental range (from left to right).
In the first place, the reaction norms slopes are obviously estimated with increasing accuracy. The s.e.(byx) of the slope estimate byx from a regression analysis depends on sample size (n), on the variation of the data along the x-axis (σx 2), and on the estimate itself, in the most simple case (e.g. not taking into account any information from relatives) as  (after Lynch and Walsh, Reference Lynch and Walsh1998). From the point of view of identifying the least environmentally sensitive animals in the population, a key issue is the detection of reaction norms with a slope close to zero, i.e. a low value for
 that will lead to a high value for s.e.(byx). This detection is therefore a challenging one, particularly because the creation of many data points (n) with a wide environmental range σx 2 (the other two prerequisites for low s.e.(byx) values) requires much organizational effort. The ratio of each sire’s slope estimate to its s.e. serves as a Student’s t value that can be tested against the hypothesized value of zero by comparing it with the standard significance threshold values; e.g. for a large-sample significance level of P = 0.05, compare with 1.96. Figure 3 shows that an increasing proportion of sire slope estimates passes this test (0.3% on the left, 7% in the middle and 83% on the right), and that this is mainly due to a strong reduction in the s.e. The main development from left to right in the slope estimates themselves is a disappearance of unrealistic values such as negative ones, but their order of magnitude does not really change. The intersection of the data trendline with the broken reference line in the rightmost graph of Figure 3 indicates that, based on the s.e. from this subset for average values of n per sire and σx 2, slope estimates of >0.75 are statistically distinguishable (at P < 0.05) from zero.
In the second place, environmental sensitivity shows a progressively lower genetic component with increasing data volume, and progressively less frequent re-ranking of genotypes across the environmental range. Figure 2 presents an increasingly clean and ordered pattern from left to right. This illustrates that reaction norms analysis is indeed a demanding process, requiring large data volume and a wide environmental range in order to produce meaningful results. Certainly, the volume and structure of our smallest data subset are not sufficient to allow for a meaningful reaction norms analysis. Even for the ‘all parities, line B’ subset with more than 100 000 records from about 50 000 daughters of about 1000 sires, the accuracy of the slope estimates is still too low to be useful in practical breeding. One option to increase this accuracy for a given dataset is to increase the number of records in each environmental level, for example by collapsing the HYS effect into a herd–year effect. Based on our results, it is difficult to obtain high accuracies of the slope EBVs, and it follows that reaction norms slopes very much represent a ‘hard-to-measure’ trait. From that point of view, environmental sensitivity should be seen as a prime candidate trait for marker-assisted selection: DNA markers for reaction norms slopes would form a very valuable tool in animal breeding.
Figure 2 and Table 1 show little G × E of the re-ranking type in the largest dataset (rightmost case), which may easily be interpreted as a reason not to worry much about G × E for this trait in this population. Of course, when the environmental range is extended to considerably lower levels than available in these data, re-ranking would inevitably occur. But the main issue is that in an EBV analysis without reaction norms, part of the G × E effect remains confounded with the additive genetic effect, and this leads to errors in the estimates of the latter; the reaction norms model removes this confounding. From the largest data subset analyzed here, the intercept estimates show correlations with the litter size EBVs as estimated in routine genetic evaluation (with a BLUP model without reaction norms included) of +0.78 for sows with one litter record to +0.85 for sows with seven litter records, and +0.75 for sires. Hence, including reaction norms in the BLUP analysis would increase the reliability of the EBV of young selection candidates without own performance or progeny data by considerably more than 100 × (1/0.75−1) = 33%.
A correlation of this magnitude between (i) an EBV that is under selection in a routine breeding program and (ii) the intercept of the reaction norms, combined with a high genetic correlation between the intercept and the slope of the reaction norms (Table 1; r A = +0.7), would lead to an increase of environmental sensitivity in the population (a slow increase because of the low heritability of the slopes). This is in line with similar findings by Kolmodin et al. (Reference Kolmodin, Strandberg, Jorjani and Danell2003) and Van der Waaij (Reference Van der Waaij2004).
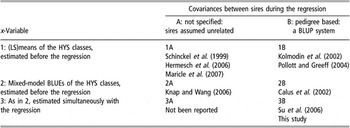
Similarly, the HYS estimates from the largest data subset analyzed here show correlations with the HYS estimates from that same routine BLUP evaluation of 0.48. Hence, the simultaneous estimation of the environmental variable and the regression parameters themselves seems to offer a considerable improvement to earlier analyses (summarized in Table 3) where the regression was carried out on such pre-estimated environmental levels. The disadvantage of options 1 in Table 3 is evident: the horizontal variable is purely phenotypic so the regression is confounded with its own x-variable. In options 2, the phenotype of the horizontal variable was adjusted for genetic effects before entering into the regression, which provides a sounder system; but those genetic effects stem from an analysis without reaction norms in its model, so it implicitly assumes that all regressions based on its x-variable are zero (Strandberg, 2006).
Earlier reaction norm studies in pigs, cattle and sheep, classified according to the way the x-variable was established, and the way covariances between sires were modelled

The combined effect of the two dimensions in Table 3 can best be illustrated by Figure 4, which shows sire reaction norms estimated on an earlier version of the current ‘all parities, line B’ data subset, by Knap and Wang (2006) according to method 2A; the correlation between the sire intercept and slope estimates was +0.08 there. The current method 3B removes a considerable amount of apparent re-ranking G × E.
Sire reaction norms for litter size in pigs (Knap and Wang, 2006; see Table 3 in the current text). The horizontal variable is an HYS (herd–year–season) estimate from a separate BLUP analysis without reaction norms in the model; random regression was subsequently performed with the MIXED procedure of SAS. Compare with the central graph of Figure 2.

In the current analysis, higher parity records were analyzed together with the parity 1 records, and crossbred sow records were analyzed together with purebred sow records. Hence, this provides no conclusive information on the difference between first parity and higher parities, or between purebred and crossbred sows, in terms of environmental sensitivity. These differences require further study.