


1. Introduction
Star-forming regions (SFs, i.e. H ii regions and star-forming galaxies) and active galactic nuclei (AGN) present strong emission lines in their spectra, which can be used to derive physical parameters of their ionised gas, such as electron densities (
 $N_{\mathrm e}$
), electron temperatures (
 $T_{\mathrm e}$
), and metallicities (Z) (e.g., see Maiolino & Mannucci Reference Maiolino and Mannucci2019 and Kewley, Nicholls, & Sutherland Reference Kewley, Nicholls and Sutherland2019 for reviews). Concerning the metallicity, generally, the oxygen abundance in relation to the hydrogen (O/H) is used as a tracer of it, since oxygen presents strong emission lines in the optical spectrum ([O ii]
 $\lambda3726,\lambda3729$
, [O iii]
 $\lambda5007$
) emitted by its most abundant ions (O+,
 $\mathrm {O^{2+}}$
), according to studies of SFs (e.g. Kennicutt et al. 2003; Izotov et al. 2006; Dors et al. Reference Dors2022) and AGN (e.g. Flury & Moran Reference Flury and Moran2020; Dors et al. Reference Dors2020a). Therefore, hereafter we use metallicity (Z) and oxygen abundance (O/H) interchangeably.
Basically, there are two different methods to derive the metallicity through emission lines. The first one is the
 $T_{\mathrm e}$
-method (for a review of the
 $T_{\mathrm e}$
-method see Peimbert, Peimbert, & Delgado-Inglada Reference Peimbert, Peimbert and Delgado-Inglada2017 and Pérez-Monteo Reference Pérez-Montero2017). Briefly, this method is based on direct determinations of electron temperatures, which requires measurements of auroral emission lines, such [O iii]
 $\lambda$
4363 and [N ii]
 $\lambda$
5755 (see Pilyugin Reference Pilyugin2003; Hägele et al. Reference Hägele, Pérez-Montero, Daz, Terlevich and Terlevich2006; López-Sánchez & Esteban Reference López-Sánchez and Esteban2009; Hägele et al. Reference Hägele2008, Reference Hägele2011, Reference Hägele, Firpo, Bosch, Daz and Morrell2012; Toribio San Cipriano et al. Reference Toribio San Cipriano2017; Hogarth et al. Reference Hogarth2020). Unfortunately, auroral lines are weak (about 100 times weaker than H
 $\beta$
) or even not detectable most objects with high metallicities and/or low excitation (van Zee et al. Reference van Zee, Salzer, Haynes, O’Donoghue and Balonek1998; Díaz et al. 2007; Hägele et al. Reference Hägele, Daz, Cardaci, Terlevich and Terlevich2007, Reference Hägele, Daz, Cardaci, Terlevich and Terlevich2009, Reference Hägele, Daz, Cardaci, Terlevich and Terlevich2010, Reference Hägele2013; Dors et al. Reference Dors, Storchi-Bergmann, Riffel and Schimdt2008).
Alternatively, a second method involving strong observational emission-lines has to be used when the
 $T_{\mathrm e}$
-method can not be applied. This kind of indirect method can be used to derive Z, as initially proposed by Pagel et al. (Reference Pagel, Edmunds, Blackwell, Chun and Smith1979), who followed the original idea of Jensen, Strom, & Strom (Reference Jensen, Strom and Strom1976). Indirect or strong-line methods are based on calibrations between strong emission-line ratios, easily measured in SFs and AGN spectra, and the metallicity (for a review on strong-line methods for SFs see López-Sánchez & Esteban Reference López-Sánchez and Esteban2010 and for AGN see Dors et al. Reference Dors2020b). Over decades, several studies have proposed calibrations to derive metallicities in SFs (e.g. Pagel et al. Reference Pagel, Edmunds, Blackwell, Chun and Smith1979; Alloin et al. Reference Alloin, Collin-Souffrin, Joly and Vigroux1979; McGaugh Reference McGaugh1991; Kewley & Dopita Reference Kewley and Dopita2002; Pettini & Pagel Reference Pettini and Pagel2004; Marino et al. Reference Marino2013; Morales-Luis et al. Reference Morales-Luis, Pérez-Montero, Sánchez Almeida and Muñoz-Tuñón2014; Brown, Martini, & Andrews Reference Brown, Martini and Andrews2016; Pilyugin & Grebel Reference Pilyugin and Grebel2016; Curti et al. Reference Curti2017; Ho Reference Ho2019; Mingozzi et al. Reference Mingozzi2020; Pérez-Montero et al. Reference Pérez-Montero2021; Florido, Zurita, & Pérez-Montero Reference Florido, Zurita and Pérez-Montero2022; Díaz & Zamora 2022), being few studies dedicated to AGN (e.g. Castro et al. Reference Castro, Dors, Cardaci and Hägele2017; Pérez-Montero et al. Reference Pérez-Montero2019; Carvalho et al. Reference Carvalho2020; Dors et al. Reference Dors2021; Dors Reference Dors2021; Carr et al. Reference Carr, Salzer, Gronwall and Williams2023) and to low ionisation nuclear emission-line regions (LINERs).
Regarding LINERs, despite this class of objects appearing in
 $\sim+1/3$
of galaxies in the local universe (Netzer Reference Netzer2013), the main ionisation mechanism of the gas of these objects is still an open problem in astronomy, making difficult the determination of their metallicity and chemical abundance studies for this class of galaxies (Storchi-Bergmann et al. Reference Storchi-Bergmann, Schmitt, Calzetti and Kinney1998). Actually, Annibali et al. (Reference Annibali2010), by using optical spectra of a sample (65 objects) of LINERs located in early-type galaxies estimated the O/H abundance assuming ionisation by hot main sequence stars (using the calibration by Kobulnicky et al. Reference Kobulnicky and Kennicutt1999) and by accretion of gas into a central black hole (applying the AGN calibration proposed by Storchi-Bergmann et al. Reference Storchi-Bergmann, Schmitt, Calzetti and Kinney1998). These authors found that the AGN calibration produces higher values (
 $\sim$
0.05 dex in average) for the oxygen abundances than those derived through hot stars calibration.
Recently, there has been a renewed interest in the determination of metal abundances in LINERs. Krabbe et al. (Reference Krabbe2021) derived the O/H abundance in the UGC 4805 nucleus applying distinct methods: (i) comparison between observational data and results of photoionisation models assuming gas accretion into a black hole (representing an AGN), (ii) photoionisation models assuming post-Asymptotic Giant Branch (post-AGB) stars with different temperatures as ionising sources, and (iii) extrapolation of the disk radial abundance gradient to infer the nuclear abundance (see also Pilyugin et al. Reference Pilyugin, Vlchez and Contini2004; do Nascimento et al. Reference do Nascimento2022). These authors found that, depending on the method adopted, discrepancies until
 $\sim+0.4$
dex in O/H estimates are derived (see Table A1 by Krabbe et al. Reference Krabbe2021). This value is of the order of the discrepancies when using different strong-line methods for SFs (see López-Sánchez et al. Reference López-Sánchez2012). Also, Pérez-Díaz et al. (Reference Pérez-Daz, Masegosa, Márquez and Pérez-Montero2021) compiled optical spectroscopic data of 40 LINERs taken from the Palomar survey (Ho, Filippenko, & Sargent Reference Ho, Filippenko and Sargent1995; Ho et al. Reference Ho, Filippenko and Sargent1997) and 25 LINERs from Pović et al. (2016), observed at the Calar Alto Observatory, totaling a sample of 65 LINERs (
 $z\sim 0.1$
), and applied the hii-chi-mistry code (Pérez-Montero Reference Pérez-Montero2014, hereafter HCm code) to derive the O/H and N/O abundances. Pérez-Díaz et al. (Reference Pérez-Daz, Masegosa, Márquez and Pérez-Montero2021) found a range of
 $\mathrm 8.01\: \lesssim \: \mathrm{12+\log(O/H)}\: \lesssim \: 8.86$
for their LINERs sample. Along this paper, we consider the solar oxygen abundance derived by Grevesse et al. (Reference Grevesse, Asplund, Sauval and Scott2010), which is 12 +
 $\log$
(O/H)
 $_\odot$
= 8.69.
For the first time, Oliveira et al. (Reference Oliveira2022) proposed two semi-empirical calibrations to estimate the oxygen abundances of LINERs. These authors selected a sample with 43 LINERs according to the [O iii]
 $\lambda5007$
/H
 $\beta$
versus [N ii]
 $\lambda6584$
/H
 $\alpha$
diagnostic diagram proposed by Baldwin, Phillips, & Terlevich (Reference Baldwin, Phillips and Terlevich1981), known as classic BPT (hereafter [N ii]-diagram). These nuclei were also classified as retired galaxies, i.e., the ionisation of the gas is probably due to post-AGB stars (see the discussion by Cid Fernandes et al. Reference Cid Fernandes2011). Oliveira et al. (Reference Oliveira2022) built a grid of photoionisation models using the Cloudy code (Ferland et al. Reference Ferland2013) and considering post-AGB stars with three different effective temperatures (50, 100, and 190 kK) as the ionising source. The results of these photoionisation models were compared with the observational data of their sample. From this comparison, these authors were able to derive two semi-empirical calibrations, considering the N2 = log([N ii]
 $\lambda 6584/\mathrm{H}\alpha)$
and the O3N2 = log [([O iii]
 $\lambda5007/\mathrm{H}\beta$
)/([N ii]
 $\lambda6583/\mathrm{H}\alpha)]$
indexes as metallicity tracers. Through the proposed calibrations, these authors found that their LINERs present oxygen abundance values in the
 $8.48 \lesssim \: \mathrm{12+\log(O/H)} \: \lesssim \: 8.84 $
range, with an average value of
 $\mathrm{12+\log(O/H)}=8.65$
.
Recently, Oliveira et al. (Reference Oliveira2024) investigated the nitrogen abundances in the same LINER sample studied by Oliveira et al. (Reference Oliveira2022). These authors built detailed photoionisation models with Cloudy code (Ferland et al. Reference Ferland2017) to reproduce a set of observational emission line intensities ratios of the sample. By these models, the authors found nitrogen abundances in the range of
 $7.62 \lesssim \: \mathrm{12+\log(N/H)} \: \lesssim \: 8.57 $
, with a mean value of
 $\mathrm{12+\log(N/H)}=8.05 \pm 0.25$
and an oxygen abundance range between
 $8.05 \lesssim \: \mathrm{12+\log(O/H)} \: \lesssim \: 9.03 $
, with a mean value of
 $\mathrm{12+\log(O/H)}=8.74 \pm 0.27$
. The LINERs analysed by Oliveira et al. (Reference Oliveira2024) are located in the higher N/O region on the N/O versus O/H diagram, showing an unexpected negative trend between these two parameters. The authors investigated some explanations reported in the literature for these deviations, however, they did not find any evidence to support these mechanisms.
As a subsequent study, in the present work, we investigate the oxygen abundance of LINER galaxies whose ionisation sources are probably AGN, since these objects are classified as LINERs in the BPT diagram (Baldwin et al. Reference Baldwin, Phillips and Terlevich1981) and in strong and weak AGN (sAGN and wAGN, respectively) by using the WHAN diagram (Cid Fernandes et al. Reference Cid Fernandes2011). Following a similar methodology as the one applied by Oliveira et al. (Reference Oliveira2022), and also using observational data taken from Mapping Nearby Galaxies at APO (MaNGA Bundy et al. Reference Bundy2015) survey, in the present paper, we propose a new semi-empirical metallicity calibration for these objects by using the N2 index as a metallicity tracer. These object classes (sAGN and wAGN LINERs) were not considered by Oliveira et al. (Reference Oliveira2022) and could represent a substantial increase in the number of LINERs with metallicity determinations. Indeed, taking into account the available observational LINERs data in the MaNGA data set, the metallicity calibration for LINERs classified as wAGN and sAGN in the WHAN diagram and developed in the present study, makes it possible Z estimates for a sample of 118 objects, increasing by a factor of about two the number of Z estimates in LINERs in comparison to previous studies. In addition, metallicity discrepancies in LINERs ionised by distinct sources could reveal the effects of some physical processes on the enrichment of the interstellar medium (ISM), as the influence of gas outflows present in some LINERs classified as wAGN and sAGN (e.g. Ilha et al. Reference Ilha2022). We carried out our analysis using the Cloudy code (Ferland et al. Reference Ferland2013) to build grids of photoionisation models, representing AGN, to reproduce strong optical emission line ratios found for the objects in our sample.
This paper is organised as follows: Section 2 describes the observational data, photoionisation models, and the methodology applied to derive the oxygen abundances. In Section 3, a comparison between the observational data and photoionisation models as well as the calibration obtained are presented, while in Section 4 the discussion of the results is shown. In Section 5 we present our conclusions. Throughout this paper we adopt the Planck Collaboration et al. (Reference Collaboration2021) cosmologic parameters:
 $\textrm{H}_{0}=67.4 \: \mathrm km \:s^{-1} \: Mpc^{-1}$
and
 $\Omega_{\mathrm m}=0.315$
.
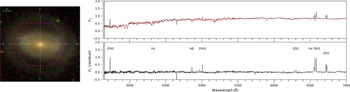
Left panel: SDSS gri band composite image of the nuclear spaxel of sAGN MaNGA 7990-12704 object taken from the MaNGA survey (Blanton et al. Reference Blanton2017). The IFU field of view is indicated in purple. Right upper panel: observed spectrum (in black) and its single stellar population synthesis (in red) for the selected spaxel of the MaNGA 7990-12704 object. Right lower panel: pure emission spectrum for the same object. with some emission lines identified.

2. Methodology
2.1 Sample selection
In this paper, we utilised optical spectroscopic data of LINERs obtained from the MaNGA SDSS DR17 survey (Abdurro’uf et al. 2022). To derive the emission line and continuum fluxes of each galaxy, we followed the methodology described by Zinchenko et al. (Reference Zinchenko, Just, Pilyugin and Lara-Lopez2019b, Reference Zinchenko2021) and Zinchenko (Reference Zinchenko2023). Briefly, on each spectrum of our sample, the stellar component was fitted using the starlight code (see Cid Fernandes et al. Reference Cid Fernandes, Mateus and Sodré2005; Mateus et al. Reference Mateus2006; Asari et al. Reference Asari2007), assuming as templates the simple stellar populations (SSPs) from the work by Bruzual & Charlot (Reference Bruzual and Charlot2003). To fit the emission lines we used our elf3d code, which was built upon the LMFIT package (Newville et al. Reference Newville2016). Following Izotov, Thuan, & Lipovetsky (Reference Izotov, Thuan and Lipovetsky1994), for each spectrum, we applied the Whitford reddening law analytical approximation (Whitford Reference Whitford1958), assuming a Balmer line ratio of H
 $\alpha$
/H
 $\beta = 2.86$
, which was obtained for recombination case B for an electron temperature of 10 000 K and an electronic density of 100 cm-3. In spaxels with values of H
 $\alpha$
/H
 $\beta$
lower than 2.86, we set the reddening to zero.
After we carried out this procedure, we obtained the reddening corrected spectra for the galactic nuclear spaxels, assuming a circular aperture with a diameter of
 $\sim$
2 arcsec. For each object, we selected the nuclear spaxel with the highest signal-to-noise (S/N) of H
 $\alpha$
. The signal-to-noise ratio (S/N) was required to be higher than 5 in all [O ii]
 $\lambda 3727$
, H
 $\beta$
, [O iii]
 $\lambda 5007$
, [O i]
 $\lambda 6300$
, H
 $\alpha$
, [N ii]
 $\lambda 6584$
, and [S ii]
 $\lambda 6716,\lambda6731$
emission lines.
Subsequently, the BPT diagrams [O iii]
 $\lambda$
5007/H
 $\beta$
vs. [N ii]
 $\lambda$
6584/H
 $\alpha$
, [S ii](
 $\lambda6716+\lambda6731$
)/H
 $\alpha$
and [O i]
 $\lambda$
6300/H
 $\alpha$
(Baldwin et al. Reference Baldwin, Phillips and Terlevich1981 and Veilleux & Osterbrock Reference Veilleux and Osterbrock1987), to classify each nuclear spaxel in our sample were used. Initially, the empirical and theoretical criteria proposed by Kauffmann et al. (Reference Kauffmann2003) and Kewley et al. (Reference Kewley, Groves, Kauffmann and Heckman2006), respectively, to classify objects in H ii-like regions, composite, and AGN-like objects were considered. Also, the criteria suggested by Cid Fernandes et al. (Reference Sodrà Cid Fernandes2010) to separate LINERs from Seyfert nuclei in BPT diagrams were used. However, it is difficult to discriminate the ionisation source of LINERs only through the BPT diagrams (e.g. Stasińska et al. 2015). Thus, the WHAN diagram proposed by Cid Fernandes et al. (Reference Sodrà Cid Fernandes2010, Reference Cid Fernandes2011), which uses the equivalent width of H
 $\alpha$
(EW
 $_{\mathrm{H}\alpha}$
) versus [N ii]
 $\lambda6584$
/H
 $\alpha$
, is a useful tool to distinguish the nature of the ionisation source of objects according to the following classification criteria:
-
1. Pure star-forming galaxies: log([N ii]/ H
 $\alpha) \unicode{x003C} -0.4$
and EW
$_{\mathrm{H}\alpha} \: \unicode{x003E} \: 3$
Å. These objects have as ionisation sources O and/or B stars.
-
2. Strong AGN: log([N ii]/H
$\alpha)\: \unicode{x003E} \: -0.4$
and EW
$_{\mathrm{H}\alpha} \: \unicode{x003E} \: 6$
Å. -
3. Weak AGN: log([N ii]/H
$\alpha) \: \unicode{x003E} \: -0.4$
and EW
$_{\mathrm{H}\alpha}$
between 3 and 6 Å.Such as the strong AGN, weak AGN have ionising source radiation coming from accretion of gas into a black hole.
-
4. Retired Galaxies (RGs; i.e., fake AGN): EW
$_{\mathrm{H}\alpha} \: \unicode{x003C} \: 3$
Å. These objects, probably, have as ionisation source post-AGB stars. -
5. Passive galaxies (PGs): EW
$_{\mathrm{H}\alpha}$
and EW
$_{[\textrm{N}\,II]} \: \unicode{x003C} \: 0.5$
Å. PGs are defined as those with very weak or undetected emission lines.


To exclude any ambiguous object, we only selected galaxies with simultaneously LINER classification in the three BPT diagrams and also AGN (strong or weak) classification in the WHAN diagram. The final sample is composed by 118 LINER galaxies: 84 wAGN and 34 sAGN, as classified by the WHAN diagram, with a wide range of stellar masses [
 $9.0 \lesssim \log(M_{*}/{\textrm{M}_{\odot}}) \lesssim 11.2$
] and redshifts
 $0.02 \: \lesssim z \lesssim 0.12$
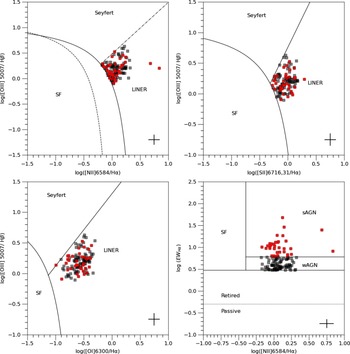
(masses and redshifts were taken from the MaNGA survey). For sample, in Fig. 1 (right top panel), the observed (in black) and synthetic (in red) spectra of the selected nuclear spaxel of the sAGN MaNGA 7990-12704 object belonging to our sample are shown. In the right bottom panel the pure emission spectrum, i.e. after the SSP subtraction, as well as some emission line identifications, are shown. In the left panel of Fig. 1, a composite image of this object with the IFU field overlapped is shown. In Fig. 2, the BPT and WHAN diagrams containing our final sample are shown, where strong and weak AGNs are discriminated by distinct colors, as indicated.
Top left panel: [O iii]
 $\lambda$
5007/H
 $\beta$
versus [N ii]
 $\lambda$
6584/H
 $\alpha$
diagnostic diagram. The black solid curve represents the theoretical upper limit for the star-forming regions proposed by Kewley et al. (Reference Kewley, Dopita, Sutherland, Heisler and Trevena2001), the black dashed curve is the empirical star-forming limit proposed by Kauffmann et al. (Reference Kauffmann2003), and the pointed-dashed black line is the criteria proposed by Cid Fernandes et al. (Reference Sodrà Cid Fernandes2010) to separate LINERs from AGN. Top right panel: [O iii]
 $\lambda$
5007/H
 $\beta$
versus [S ii]
 $\lambda\lambda$
6716,31/H
 $\alpha$
diagnostic diagram, with the criteria proposed by Kewley et al. (Reference Kewley, Groves, Kauffmann and Heckman2006) to distinguish the objects. Bottom left panel: [O iii]
 $\lambda$
5007/H
 $\beta$
versus [O i]
 $\lambda$
6300/H
 $\alpha$
diagram, with the criteria proposed by Kewley et al. (Reference Kewley, Groves, Kauffmann and Heckman2006) to distinguish the objects. Bottom right panel: WHAN diagram. Black and red points represent the observational line ratios for the wAGN and sAGN nuclei, respectively, for the objects in our sample as classified by the WHAN diagram.

In Appendix 1, the reddening corrected emission line intensities (in relation to
 $\mathrm{H}\beta=1$
), the logarithm of EW
 $_{\mathrm{H}\alpha}$
, the reddening coefficient [c(H
 $\beta$
)], and the absolute flux of H
 $\beta$
of for each nuclear spaxel in our sample are listed.
2.2 Photoionisation models
We built a grid of photoionisation models with version 17.02 of the Cloudy code (Ferland et al. Reference Ferland2017), assuming a wide range of nebular parameters. These dust-free models are similar to those built by Carvalho et al. (Reference Carvalho2020) and Oliveira et al. (Reference Oliveira2022). In our models, a plane-parallel geometry is adopted, and the outer radius is assumed to be the one where the gas temperature falls to 4 000 K (default outer radius value in the cloudy code), with a constant electronic density along the radius. A brief description of the input parameters is presented in what follows.
-
1. Spectral Energy Distributions (SEDs): Oliveira et al. (Reference Oliveira2022) considered a sample of LINERs classified in the WHAN diagram as retired galaxies. The photoionisation models built by these authors assumed post-AGB star atmosphere models by Rauch (Reference Rauch2003) as SEDs. In the present work, the LINERs of the sample are classified as strong or weak AGN, i.e. the ionisation is produced by radiation from gas accretion into a black hole with distinct rates. Thus, to represent AGN SEDs, a multi-component continuum, similar to that observed in typical AGN, was assumed. In our models, we assumed three different values for the slope of the SED as defined by Avni et al. (Reference Avni, Soltan, Tananbaum and Zamorani1980):
$\alpha_{ox} = -0.8, -1.1$
, and
$-1.4$
. Carvalho et al. (Reference Carvalho2020) showed that photoionisation models assuming similar
$\alpha_{ox}$
range are able to reproduce optical line ratios of a large sample of Seyfert 2 nuclei (see also Dors et al. Reference Dors, Arellano-Córdova, Cardaci and Hägele2017a; Pérez-Montero et al. Reference Pérez-Montero2019). By using observational data, the value of
$\alpha_{ox}\sim-1.0$
was derived as representative for LINERs and low luminosity AGN (see Ho Reference Ho1999; Eracleous, Hwang, & Flohic Reference Eracleous, Hwang and Flohic2010; Maoz Reference Maoz2007; Younes et al. Reference Younes, Porquet, Sabra, Reeves and Grosso2012). -
2. Metallicity: we assumed (
$Z/{\textrm{Z}_{\odot}}$
) = 0.2, 0.5, 0.75, 1.0, 2.0, and 3.0 for the gas phase of the models. We also assumed the parametrisation of Grevesse et al. (Reference Grevesse, Asplund, Sauval and Scott2010), in which the solar oxygen abundance 12 +
$\log$
(O/H)
$_\odot$
= 8.69 is equivalent to (
$Z/{\textrm{Z}_{\odot}}$
)=1.0. For nitrogen, we assumed the relation proposed by Carvalho et al. (Reference Carvalho2020), who considered abundance estimations for type 2 AGN and SFs. The other elements (e.g. S, Ar) were linearly scaled with the metallicity. -
3. Electron Density: Oliveira et al. (Reference Oliveira2024) derived, by using photoionisation models combined with observational data, a range of electron density (
$N_{\textrm{e}}$
) between
$50 \lesssim N_{\textrm{e}} \lesssim $
2800
$\textrm{cm}^{-3}$
, with an average value about
$N_{\textrm{e}} \approx $
400
$\textrm{cm}^{-3}$
. In the present work,we assumed electron density values
$N_{\textrm{e}}$
= 100, 500, and 3 000
$\textrm{cm}^{-3}$
, constant along the nebular radius. This is the same interval used by Oliveira et al. (Reference Oliveira2022) for photoionisation model grids to reproduce observational data of LINERs classified as retired galaxies and used by Carvalho et al. (Reference Carvalho2020) to build a grid of models to reproduce data from Seyfert 2 nuclei. -
4. Ionisation Parameter: we followed Oliveira et al. (Reference Oliveira2022) and assumed the logarithm of U in the range of −4.0
$\le \log U \le $
−1.0, with a step of 0.5 dex. This is about the same range of values assumed by Feltre, Charlot, & Gutkin (Reference Feltre, Charlot and Gutkin2016), Feltre et al. (Reference Feltre2023), who built a photoionisation model grid to reproduce ultraviolet and optical emission-line ratios of AGN and SFs.



To estimate the metallicity and ionisation parameters for the galaxies in our sample, we compared observational emission line intensity ratios with those predicted by our photoionisation models. This comparison is done by using the diagrams: log([O iii]
 $\lambda 5007$
/[O ii]
 $\lambda 3727)$
versus N2, being [O iii]/[O ii] mainly sensitive to U and N2 to Z.
Alternatively, the metallicity Z can be estimated from bayesian-like comparison between certain observed and model-predicted emission-line ratios sensitive to total oxygen abundance (see Pérez-Montero Reference Pérez-Montero2014). For instance, Thomas et al. (Reference Thomas2018) proposed a Bayesian code, called as NebulaBayes, in which a comparison between observational data and photoionisation model grids representing AGN is performed to estimate Z. This code determines the probability of a set of model parameter values (including a wide range of nebular parameters and SED of ionising source) reproduces a given observational data. Thomas et al. (Reference Thomas2019), applying the NebulaBayes code, found that this analysis method produces similar (almost identical) results to those derived by Castro et al. (Reference Castro, Dors, Cardaci and Hägele2017). The methodology proposed by Castro et al. (Reference Castro, Dors, Cardaci and Hägele2017) is the same as that one applied by Dors et al. (Reference Dors, Monteiro, Cardaci, Hägele and Krabbe2019), Carvalho et al. (Reference Carvalho2020), Oliveira et al. (Reference Oliveira2022), and, finally, by us in the present work. Thus, it is reasonable to assume that our grid of models seems to produce similar metallicity values to those derived from bayesian-like comparisons.
3. Results
Auroral emission lines (such as [O iii]
 $\lambda4363$
and [N ii]
 $\lambda5755$
) are not measured in the spectra of the objects belonging to our sample, thus, it is not possible to apply the
 $T_{\textrm{e}}$
-method, and Z estimates are only possible by indirect or strong-line methods.
To obtain a strong-line method to estimate Z in LINERs classified as sAGN and wAGN, we compare the results of AGN photoionisation models to the observational data for the objects of our sample in the
 $\log$
([O iii]
 $\lambda 5007$
/[O ii]
 $\lambda 3727$
versus N2 diagram (Fig. 3). This diagram combines the [O iii]/[O ii] lines ratio, mainly sensitive to the ionisation degree of the gas (e.g. McGaugh Reference McGaugh1991; Dopita et al. Reference Dopita, Kewley, Heisler and Sutherland2000), with N2, mainly sensitive to Z (e.g. Storchi-Bergmann, Calzetti, & Kinney Reference Storchi-Bergmann, Calzetti and Kinney1994; Raimann et al. Reference Raimann, Storchi-Bergmann, Bica, Melnick and Schmitt2000). A similar methodology was recently applied by Carr et al. (Reference Carr, Salzer, Gronwall and Williams2023), who compared observational data of Seyfert 2 nuclei and photoionisation model results in a [O iii]
 $\lambda 5007$
/H
 $\beta$
versus N2 diagram. Dors et al. (Reference Dors, Krabbe, Hägele and Pérez-Montero2011) analysed the reliability of oxygen abundance and ionisation parameter estimates through a number of diagnostic diagrams containing SF photoionisation results. The accuracy of the diagrams was analysed by comparing O/H estimates from these with those via the
 $T_{\textrm{e}}$
-method. Unfortunately, the
 $T_{\textrm{e}}$
-method was not developed for LINERs and, thus, there are no (reliable) direct abundance estimates for this object class in the literature. Therefore, it is worth emphasising that future direct O/H estimates are necessary to validate the abundance results obtained in the present work.
log([O iii]
 $\lambda 5007$
/[O ii]
 $\lambda 3727$
) versus N2=log([N ii]
 $\lambda$
6584/H
 $\alpha$
) diagnostic diagram. Distinct colored solid lines connect the photoionisation model (see Section 2.2) results with the same metallicity, while dotted lines connect models with the same ionisation parameter (U), as indicated. Black and red points represent the observational line ratios (see Section 2.1) for each nucleus (wAGN and sAGN, respectively)of our sample. In each plot, a grid of models assuming different electron density (
 $N_{\textrm{e}}$
) and
 $\alpha_{ox}$
values, as indicated, is shown.

The
 $\log$
([O iii]
 $\lambda 5007$
/[O ii]
 $\lambda 3727$
) versus N2 diagrams containing the observational data and photoionisation model results are shown in Fig. 3, where it can be seen that models with
 $\alpha_{ox} \: \unicode{x003C} \: -1.4$
well reproduce the observational data. It is also possible to note that models with
 $\alpha_{ox}= -1.4$
do not reproduce most parts of the observational data, in the sense that the N2 values predicted by the models are underestimated (by
 $\sim$
0.5 dex) in comparison to the observational ones (see also Dors et al. Reference Dors, Arellano-Córdova, Cardaci and Hägele2017a; Carvalho et al. Reference Carvalho2020). Therefore, models with
 $\alpha_{ox}= -1.4$
are not considered in the derivation of the
 $Z-N2$
calibration.
To calibrate the N2 index as a function of the metallicity, we derived the logarithm of the ionisation parameter and the metallicity for each galactic nucleus of our sample through linear interpolation between the models (see also Dors et al. Reference Dors, Krabbe, Hägele and Pérez-Montero2011). From this interpolation, for each object and for each diagram (i.e. for models with distinct
 $\alpha_{\textrm{ox}}$
and
 $N_{\textrm{e}}$
values, see Fig. 3), it is possible to obtain pairs of values (Z, U) and their corresponding ([O iii]/[O ii], N2) values. In this way, we derived a set of points for the sample, i.e. (Z, U)-([O iii]/[O ii], N2) and, thus, an unidimensional
 $Z-N2$
calibration. In Fig. 4, the average values of the (N2, Z) obtained considering the six diagrams shown in Fig. 3 (values from models assuming
 $\alpha_{\textrm{ox}}=-1.4$
are not considered) are shown. A clear correlation between these quantities is found, with a correlation coefficient of
 $r=0.97$
, being represented by
 \begin{align}{\textrm{12} + \log(O/H)} &= 0.72 (\pm 0.09) \: x^{2} + 0.68 (\pm 0.01) \: x\nonumber\\ &\quad+ 8.60 (\pm 0.01).\end{align}
being
 $x= N2$
.
Oxygen abundance versus N2 parameter. Black and red points represent the average values of O/H (for wAGN and sAGN, respectively) derived from interpolation between observational data and the results of photoionisation model grids from Fig. 3. The red curve represents the fitting to the points and it is given in Equation (1), while the vertical dashed lines represent the valid interval for our calibration.

In Fig. 4 this equation is represented by a red curve and it is valid for the range of
 $-0.2 \: \unicode{x003C} \: N2 \: \unicode{x003C} \: 0.35$
.
From the interpolation between observational data and the results of photoionisation model grids we derive oxygen abundance for the wAGN in the range of
 $\rm 8.50 \: \lesssim \: 12+\log(O/H) \: \lesssim \: 8.90$
(i.e.
 $0.5 \: \lesssim \:Z/\textrm{Z}_{\odot} \: \lesssim \: 1.7$
), with an average value of
 $\unicode{x003C}\mathrm{12+log(O/H)}\unicode{x003E}=8.68\pm0.09$
(i.e.
 $\unicode{x003C}Z/\textrm{Z}_{\odot}\unicode{x003E}\sim0.9$
) while for the sAGN these quantities are
 $\rm 8.51 \: \lesssim \: 12+\log(O/H) \: \lesssim \: 8.81$
(i.e.
 $0.5 \: \lesssim \:Z/\textrm{Z}_{\odot} \: \lesssim \: 1.31$
) and
 $\unicode{x003C}\mathrm{12+log(O/H)}\unicode{x003E}=8.65\pm0.07$
(i.e.
 $\unicode{x003C}Z/\textrm{Z}_{\odot}\unicode{x003E}\sim0.8$
). We assumed the solar oxygen abundance
 $\rm \log(O/H)_{\odot} = -3.31$
derived by Grevesse et al. (Reference Grevesse, Asplund, Sauval and Scott2010). About
 $\sim$
30% of the objects of our sample present oversolar abundances. It is worth mentioning that, as would be expected due to the N2 index mainly depending on metal abundances, both wAGN and sAGN are distributed along the entire metallicity range. See also how the distributions of both kinds of objects are overlapped in Fig. 3.
4. Discussion
To determine the metallicity of the gas phase of any object through its emission lines it is essential to know the nature of the ionising source of the gas, especially when indirect methods are applied. Strong-line methods have been proposed over the years (see Maiolino & Mannucci Reference Maiolino and Mannucci2019 and the references therein) to estimate Z in SFs and AGN (mainly Seyfert 2s), however, an opposite situation is found regarding LINERs. The nature of the ionising source of this class of galaxies is an open problem in astronomy and several works have proposed explanations for it. Heckman (Reference Heckman1980) suggested shocks as responsible for the ionisation of LINERs. On the other hand, radiation from gas accretion into black holes (AGN) was suggested as the ionising mechanism of the gas (Ferland & Netzer Reference Ferland and Netzer1983; Halpern & Steiner Reference Halpern and Steiner1983; Ho, Filippenko, & Sargent Reference Ho, Filippenko and Sargent1993). Also, hot evolved stars (like post-AGBs, e.g. Terlevich & Melnick Reference Terlevich and Melnick1985) or even normal main-sequence stars (O5 or earlier, e.g. Shields Reference Shields1992) were proposed as the main ionising source of LINERs. In the present work, we used three BPT diagnostic diagrams (Baldwin et al. Reference Baldwin, Phillips and Terlevich1981; Veilleux & Osterbrock Reference Veilleux and Osterbrock1987), as well as the WHAN diagram (Cid Fernandes et al. Reference Cid Fernandes2011), to select LINERs that are probably ionised by AGN. Therefore, based on this assumption, we proposed a semi-empirical calibration between the N2 line ratio and the metallicity derived from a comparison between photoionisation models assuming an AGN as the main ionising source of the gas and optical observational data (see Section 2).
4.1 Oxygen abundance: Comparison with post-AGB LINERs and Seyferts nuclei
The results obtained in the present work, together with those from Oliveira et al. (Reference Oliveira2022), are the first metallicity estimates for LINERs taking into account the distinct ionising source of this object class. Thus, a comparison between these estimates, as well as with those for confirmed AGN (see Dors et al. Reference Dors2020b and references therein), produces important insights on metal ISM enrichment by stars within different environments. In fact, it is expected that in LINERs ionised by post-AGB stars the ISM enrichment would be, mainly, due to the metal releasing in the ISM by already evolved stars, i.e. there is not (or low level of) ongoing star formation. Otherwise, it has been observed some level of recent nuclear star formation in wAGN and sAGN LINERs and in ‘normal’ AGN (e.g. Seyfert nuclei) (e.g. Shlosman, Begelman, & Frank Reference Shlosman, Begelman and Frank1990; Storchi-Bergmann et al. Reference Storchi-Bergmann, Rodriguez-Ardila, Schmitt, Wilson and Baldwin1996; Riffel et al. Reference Riffel, Pastoriza, Rodrguez-Ardila and Bonatto2009, Reference Riffel2023). In addition, feedback processes in AGN (e.g. see Fabian Reference Fabian2012 for a review.) and LINERs (e.g. Ilha et al. Reference Ilha2022) could suppress (e.g. Page et al. Reference Page2012; Barger et al. Reference Barger2015), increase (e.g. Lutz et al. Reference Lutz2010; Rosario et al. Reference Rosario2012; Rovilos et al. Reference Rovilos2012; Banerji et al. Reference Banerji2015) or not impact the star formation (e.g. Hatziminaoglou et al. Reference Hatziminaoglou2010; Shao et al. Reference Shao2010; Harrison et al. Reference Harrison2012; Stanley et al. Reference Stanley2015; Suh et al. Reference Suh2017; Ramasawmy et al. Reference Ramasawmy, Stevens, Martin and Geach2019).
Taking this into account, in Fig. 5 the distribution of O/H abundances for our sample of wAGN and sAGN LINERs is compared with:
Histograms representing the oxygen abundance distributions derived for wAGN and sAGN LINERs (in black and red, respectively) by using Equation (1), for post-AGB LINERs (in blue) from Oliveira et al. (Reference Oliveira2022) and for Seyfert 2 galaxies (in green) from Carvalho et al. (Reference Carvalho2020), as indicated. The dashed pink line represents the solar value of
 $\textrm{12}+\log(O/H)_\odot =8.69$
(Grevesse et al. Reference Grevesse, Asplund, Sauval and Scott2010).

-
• Oxygen estimates for 463 Seyfert 2 galaxies (
$z\: \unicode{x003C} \: 0.4$
) studied by Carvalho et al. (Reference Carvalho2020). These estimates were obtained through the semi-empirical calibration: (2)where
\begin{equation}(Z/Z_{\odot})=a^{N2}+b,\end{equation}
$a=4.01\pm 0.08$
and
$b=-0.07\pm0.01$
. The observational data used by these authors were taken from the Sloan Digital Sky Survey DR7 (SDSS, York et al. Reference York2000), and the objects have masses in the range of
$9.4 \: \lesssim \:\log(M_{*}/\textrm{M}_{\odot}) \: \lesssim \: 11.3$
.
-
• O/H values for 43 LINERs ionised by post-AGB stars and estimated through the semi-empirical calibration proposed by Oliveira et al. (Reference Oliveira2022):
(3)
\begin{equation} {\textrm{12}+\log(O/H)} = 0.71 (\pm 0.03) N2 + 8.58 (\pm 0.01).\end{equation}
The observational data used by these authors were taken from the MaNGA database, being the sample with redshift in the range of
$0.2 \: \lesssim \: z \: \lesssim \: 0.7$
and mass in the interval
$9.9 \: \lesssim \:\log(M_{*}/\textrm{M}_{\odot}) \lesssim 11.2$
.







The range of galactic masses of the samples by Carvalho et al. (Reference Carvalho2020), Oliveira et al. (Reference Oliveira2022) and in the present work are similar, not yielding any bias in the Z comparison. In Fig. 5, we compare the O/H estimate distributions for these three different samples, finding a very similar behaviour between them. The number of objects in each sample together with the maximum and minimum (range) and the average oxygen abundance values are listed in Table 1. This result could suggest that these distinct object classes could have a similar star formation history and the recent star formation found in galaxies hosting an AGN or a LINER seems to not alter their metallicity. This result is consonance with the one derived by Stasińska et al. (2015), who based on spectral synthesis results of a large sample of SDSS objects, found that the specific star formation rates (sSFRs) in retired galaxies are identical to those of SF and AGN galaxies.
Statistics of the oxygen abundances for LINERs and Seyfert 2 nuclei. Second column indicates the number of objects in each sample.

4.2 Relation between ionisation parameter and the equivalent width of
${\mathrm{H}\alpha}$

The ionisation parameter is defined, basically, by the ratio between the hydrogen ionising photon flux,
 $Q(\textrm{H})$
, and the density of hydrogen atoms (e.g. Dopita & Sutherland Reference Dopita and Sutherland2003; Osterbrock & Ferland Reference Osterbrock and Ferland2006). For SFs,
 $Q(\textrm{H})$
is driven by the effective temperature (
 $T_{\textrm{e}ff}$
) of the hottest ionising stars (which decreases with the age of main sequence stars) as demonstrated by Dors et al. (Reference Dors, Hägele, Cardaci and Krabbe2017b). Due to the effects of opacity and/or line-blanketing in stellar atmospheres, stars with higher Z tend to present lower
 $T_{\textrm{e}ff}$
than those with lower Z and with similar mass (see Zinchenko et al. Reference Zinchenko, Dors, Hägele, Cardaci and Krabbe2019a and references therein). In this sense, if gas-embedded ionising stars and the SF gas phase have similar Z (e.g. Toribio San Cipriano et al. Reference Toribio San Cipriano2017), it is expected an anti-correlation between U and the metallicity of the gas phase. However, such correlation/anti-correlation for SFs is still under discussion in the literature, with studies finding correlations (e.g. Dopita et al. Reference Dopita2006; Morisset et al. Reference Morisset2016; Ji & Yan Reference Ji and Yan2022; Espinosa-Ponce et al. Reference Espinosa-Ponce2022) or not (e.g. Dors et al. Reference Dors, Krabbe, Hägele and Pérez-Montero2011; Poetrodjojo et al. Reference Poetrodjojo2018; Kreckel et al. Reference Kreckel2019; Kumari et al. Reference Kumari, Amorn, Pérez-Montero, Vlchez and Maiolino2021). These controversial results are indicative that U also depends on other physical parameters (e.g. the nebular geometry).
In fact, if U is driven, mainly, by the hardness of the ionising radiation flux (e.g. Steidel et al. Reference Steidel2014), it would be derived higher U values in AGN (which have harder far-UV spectra than stellar populations) in comparison to estimates for SFs. Nevertheless, similar U values between SFs and AGN were found, for instance, by Pérez-Montero et al. (Reference Pérez-Montero2019), who carried out an analysis through a comparison between results from the HCm code (Pérez-Montero Reference Pérez-Montero2014) and optical spectroscopic data.
With the goal to compare our LINER U values with those of AGN, in Fig. 6, the wAGN and sAGN LINERs U estimates are plotted with those derived for post-AGB LINERs derived by Oliveira et al. (Reference Oliveira2022) and those for Seyfert 2 nuclei Carvalho et al. (Reference Carvalho2020). All U and O/H estimates are derived from a comparison between results obtained from Cloudy photoionisation models and observational data by using the [O iii]/[O ii] versus N2 diagram. We can see in Fig. 6 that the wAGN, sAGN, and post-AGB LINERs have similar and a narrow range of U values, i.e.
 $-3.2 \: \lesssim \: \log U \: \lesssim \: -3.8$
. This result suggests that the (possible) distinct ionising source of both LINER types does not alter the U values. Moreover, a clear tendency of LINERs to present lower U values than Seyfert 2s (although sharing the bottom part of the U distribution), as suggested by Ferland & Netzer (Reference Ferland and Netzer1983), is noted in Fig. 6.
Logarithm of the ionisation parameter versus oxygen abundance. Black and red points represent wAGN and sAGN LINERs, respectively, analysed in the present work. Blue points represent estimates of post-AGB LINERs taken from Oliveira et al. (Reference Oliveira2022). Green points are estimates derived by Carvalho et al. (Reference Carvalho2020) for Seyfert 2 nuclei.

It is interesting to analyse how the equivalent width of H
 $\alpha$
depends on the ionisation parameter of LINERs. The EW
 $_{\mathrm{H}\alpha}$
is calculated as the ratio between the H
 $\alpha$
emission-line flux, which is proportional to Q(H), and its surrounding continuum fluxes (Dottori Reference Dottori1981). For SFs the decrease of EW
 $_{\mathrm{H}\alpha}$
is mainly due to the decrease of the
 $T_{\textrm{e}ff}$
of O/B stars (or increase of the stellar ionising cluster age, e.g. Copetti, Pastoriza, & Dottori Reference Copetti, Pastoriza and Dottori1985; Stasińska & Leitherer Reference Stasińska1996; Dors et al. Reference Dors, Storchi-Bergmann, Riffel and Schimdt2008) and becoming significant the contribution from longer-lived, non-ionising, lower-mass stars with aging (e.g. Fernandes, Leão, & Lacerda Reference Fernandes, Leão and Lacerda2003). For AGN, the decrement of the equivalent widths is mainly due to the ionising continuum softening with increasing the luminosity L (e.g. Binette et al. Reference Binette, Prieto, Szuszkiewicz and Zheng1989; Netzer, Laor, & Gondhalekar Reference Netzer, Laor and Gondhalekar1992; Korista, Baldwin, & Ferland Reference Korista, Baldwin and Ferland1998), the so-called ‘Baldwin effect’ (Baldwin Reference Baldwin1977). The Baldwin effect (see also Shields Reference Shields, Ho and Wang2007 for a review) has been found by using equivalent widths of broad (e.g. Dietrich et al. Reference Dietrich2002;Wang et al. Reference Wang, Liu, Shang and Brotherton2022) and narrow (e.g. Zhang et al. Reference Zhang, Wang, Gaskell and Dong2013) emission lines. Thus, since it is assumed that post-AGB LINERs and those classified as sAGN and wAGN LINERs have distinct ionising sources, it is expected that different LINER types follow distinct U-EW
 $_{\mathrm{H}\alpha}$
relation.
In Fig. 7, a plot of logU versus log(EW
 $_{\mathrm{H}\alpha}$
), our estimates (considering the average values of logU estimated from the upper and middle diagrams in Fig. 3) for wAGN and sAGN LINERs and those for post-AGB LINERs from Oliveira et al. (Reference Oliveira2022) are shown. Assuming bins of 0.15 dex in log(EW
 $_{\mathrm{H}\alpha}$
), we derived average log(EW
 $_{\mathrm{H}\alpha}$
) and
 $\log U$
values for each bin. The black points and their error bars in Fig. 7 represents these average values and their corresponding standard deviations. Despite the scattering of the points, it can be seen a decrement of
 $\log U$
with log(EW
 $_{\mathrm{H}\alpha}$
). A linear regression to the average values in these bins, whith a correlation coefficient of
 $r=-0.94$
and a p-value of 0.000087, is given by:
 \begin{equation} \log U =(-0.22\pm 0.01) \times \log[\mathrm{EW}_{\mathrm{H}\alpha}]-3.38\pm0.02.\end{equation}
This result could be due to two factors:
-
1. Post-AGB stars tend to have a harder ionising photon flux [or
$Q(\textrm{H})$
] than wAGN and sAGN LINERs. -
2. Post-AGB stars are spread along the nebulae, maintaining a high ionising degree at large distances (e.g. at scales of kpc), as found by Krabbe et al. (Reference Krabbe2021). Otherwise, in wAGN and sAGN LINERs the ionising source, i.e. the AGN-like source, extends to
$\sim$
10 pc (e.g. Constantin et al. Reference Constantin2015), yielding lower ionisation levels as the distance increases with the nebular radius.


logU versus
 $\log(\textrm{EW}_{H\alpha})$
. Black and red points represent the average values of logU derived from interpolation between observational data and the results of photoionisation model grids for wAGN and sAGN LINERs, respectively. Blue points represent values reported by Oliveira et al. (Reference Oliveira2022) for post-AGB LINERs. Pink points and error bars represent the average values and standard deviation of the points, respectively, considering bins of
 $\log(\textrm{EW}_{H\alpha})$
equal to 0.15 dex. The line represents the linear regression (Equation 4) to the pink points.

4.3 Mass metallicity relation
Finally, we discuss the mass-metallicity relation of galaxies (Lequeux et al. Reference Lequeux, Peimbert, Rayo, Serrano and Torres-Peimbert1979) by using our estimates. It is well known the existence of a strong correlation between the mass and metallicity (mass metallicity relation - MZR) in elliptical and spiral bulges (e.g. Zaritsky, Kennicutt, & Huchra Reference Zaritsky and Kennicutt1994; Pérez-Montero et al. Reference Pérez-Montero, Daz, Vlchez and Kehrig2006; Duarte Puertas et al. Reference Duarte Puertas2022). This relation is poorly known in AGN. In fact, Dors et al. (Reference Dors, Cardaci, Hägele and Krabbe2014) and Nagao, Maiolino, & Marconi (Reference Nagao, Maiolino and Marconi2006) found a small increase of metallicity for Seyfet 2, quasar and radio galaxies. Thomas et al. (Reference Thomas2019) analysed the MZR in a large sample of local AGN, comparing observational data from the SDSS and a four-dimensional grid of photoionisation models using the Bayesian parameter code nebulaBayes. These authors found that the oxygen abundance of AGN increases by
 $\sim$
0.1 dex as a function of the stellar mass of the hosting galaxy. None of these studies analysed the MZR for LINER nuclei. In view of that, we analysed if the oxygen abundances of the central zone of our LINER galaxies are correlated with the stellar mass of the hosting galaxies for our sample. The stellar masses of the galaxies in our sample were taken from the database provide by Sánchez et al. (Reference Sánchez2016), and are in the range of
 $9.0 \lesssim \: \log(M_{*}/{\textrm{M}_{\odot}}) \: \lesssim \: 11.2$
. In Fig. 8, our O/H estimates are plotted against the stellar masses (in units of the solar mass) of the galaxies in our sample, as well as the estimations of the oxygen abundance versus stellar masses for a sample of galaxies with SF nuclei taken from the MaNGA survey. For these SF objects, we applied the R calibration proposed by Pilyugin & Grebel (Reference Pilyugin and Grebel2016) to derive the oxygen abundance. Since we are comparing two different samples of objects: LINERs and SFs, obviously we derived the metallicity by using two different calibrations, one for each kind of object. Thus, some bias could be introduced in this analysis. From these estimates, we found a Pearson’s correlation coefficient for our LINERs of
 $r=0.24$
and a p-value of
 $0.008$
. These coefficients indicate that the relationship between these two parameters (mass and metallicity), if any, is small.
Oxygen abundances derived through our
 $Z-N2$
calibration (Equation 1) versus stellar masses (in units of the solar mass). Black and red points represent wAGN and sAGN LINERs, respectively. Black triangles are oxygen abundances of SF nuclei derived by using the calibration proposed by Pilyugin & Grebel (Reference Pilyugin and Grebel2016).

Small correlation between mass and metallicity was also found by Pérez-Díaz et al. (Reference Pérez-Daz, Masegosa, Márquez and Pérez-Montero2021) and Li et al. (Reference Li2024). Pérez-Díaz et al. (Reference Pérez-Daz, Masegosa, Márquez and Pérez-Montero2021) analysed a sample of SF galaxies, Seyfert nuclei, and LINER nuclei and could derive an MZR for SF objects, while no significant correlations were found for Seyfert nor LINER nuclei. Recently, Li et al. (Reference Li2024) applied the NebulaBayes code to a sample of objects taken from the MaNGA survey and studied the MZR in active and non-active galaxies. These authors found that for galaxies that show no evidence of AGN, the Z increases with
 $M_{*}$
below
 $M_{*} \sim 10^{10.5}$
M
 $_{\odot}$
and flattens at higher masses. Galaxies hosting AGN (Seyferts, Composite, Ambiguous, and LINERs) present similar O/H to non-AGN galaxies at stellar masses above
 $10^{10.5}\,\mathrm{M}_{\odot}$
, biasing to higher O/H below this stellar mass. However, it is important to note that for a reliable statistical result, a larger sample of LINER galaxies should be analysed. Also, it is worth mentioning that the values we derive for the oxygen abundance are in the high-metallicity end and the metallicity range is not very large, hence it is difficult to clearly establish the relationship between mass and metallicity in these galaxies.
5. Conclusions
We compiled the optical spectroscopic data of 118 galaxies taken from the MaNGA survey classified as LINERs using three different BPT diagrams and sub-classified as weak and strong AGN (84 and 34 objects, respectively) from the WHAN diagnostic diagram. Comparing observational data with photoionisation model grids built with the cloudy code we derive a semi-empirical calibration based on the N2 index to estimate the oxygen abundances for these objects. Through our calibration, we derived oxygen abundances for our wAGN LINERs in the range
 $8.50 \lesssim \: {\textrm{12}+\log(O/H)} \: \lesssim \: 8.90$
, with an average value of
 $12+\log(\textrm{O}/H)=8.68$
, and for our sAGN LINERs in the range
 $8.51 \lesssim \: {\textrm{12}+\log(O/H)} \: \lesssim \: 8.81$
, with an average value of
 $12+\log(\textrm{O}/H)=8.65$
. Both, wAGN and sAGN LINERs, present very similar metallicity ranges and average oxygen abundance values, and about 30 per cent of them have oversolar abundances.
The O/H abundances derived through the calibration proposed in this work are in consonance with those derived by using calibrations for a sample of 463 Sy2 galaxies, as well as a calibration for a sample of 43 LINER galaxies ionised by hot post-AGB stars and classified as retired galaxies in the WHAN diagram. In fact, we found a very good agreement between O/H derived by using the calibration proposed for LINERs classified as retired galaxies and the O/H obtained for our wAGN and sAGN LINERs, suggesting that both calibrations can be applied for this kind of nuclei.
We also search for the existence of a relation between the equivalent width of the observed H
 $\alpha$
emission line and the estimated ionisation parameter given by the photoionisation models, deriving a semi-empirical linear relation between them. We finally studied the mass-metallicity relationship for this kind of galaxies. Our data show that the correlation between mass and metallicity, if any, is small, but this is probably biased as we are considering the metallicity of the centre of the galaxy as representative (or something similar).
Acknowledgments
We thanks a lot the referee, Dr. Ángel R. López-Sánchez, for all comments and suggestions, which improved a lot our paper. CBO is grateful to the Fundação de Amparo à Pesquisa do Estado de São Paulo (FAPESP) for the support under grant 2023/10182-0 and to the Coordenação de Aperfeiçoamento de Pessoal de Nvel Superior (CAPES). OLD is grateful to FAPESP, process number 2022/07066-6, and to Conselho Nacional de Desenvolvimento Cientfico e Tecnológico (CNPq).
Data availability statement
Not applicable.
Appendix A. Fluxes of emission lines
Reddening corrected emission-line intensities (in relation to H
 $\beta$
=1.00) derived for each LINER nucleus in our sample. Values of the logarithm of EW
 $_{\mathrm{H}\alpha}$
, c(H
 $\beta$
), and the absolute flux of H
 $\beta$
in units of 10-17 erg/s/cm
 $^2$
/spaxel are also listed.