I. INTRODUCTION
Pattern formation due to dewetting thin films can be of vital importance in nanotechnology, with the possibility of designing patterned surfaces for specific applications, for example, photoelectrodes, optical devices, and sensors.
Early studies of the dewetting of thin polymer films on silicon substrates were reported by ReiterReference Reiter1 using polystyrene. This and subsequent studies of thin nonvolatile liquid films on nonwetting substratesReference Bucknall2 have identified dewetting as a three-stage process. In the first stage, the film breaks up into randomly distributed holes. This is followed by the growth of the holes, resulting in the formation of a polygonal network of straight liquid rims. In the final stage, the rims become unstable and break up by Rayleigh instability to form an array of dots. These initial studies showed that the average distance d between the holes scales with the second power of the thickness l of the film: d ≈ l 2. In theoretical studies, two possible rupture mechanisms have been considered: heterogeneous and homogeneous (also known as spinodal) dewetting.Reference Bucknall2–Reference Blossey11 Heterogeneous dewetting is initiated by nucleation centers, such as dust particles or other inhomogeneities or defects in the liquid film or on the surface of the substrate. This is followed by the growth of the holes producing rims that eventually break up into dots as described previously. In spinodal dewetting, which does not require nuclei, the surface or interface is destabilized by thermally excited capillary waves. This instability is similar to the spinodal decomposition of incompatible mixtures, hence the similarity in their names. When the films are sufficiently thin (less than 100 nm) for the van der Waals forces to play an important role, the instability against excited capillary waves becomes very sensitive to the thickness of the film.Reference Becker, Grün, Seemann, Mantz, Jakobs, Mecke and Blossey12 The surface fluctuations caused by the destabilizing forces grow exponentially, and the film ruptures with that wavelength of surface undulation whose amplitude increases most rapidly. This characteristic wavelength depends on the thickness of the film. Once the film ruptures, holes, rims, and finally dots form according to the dewetting process described previously, but with a characteristic wavelength.
One of the commonly used techniques to produce thin films is spin coating. In spin coating, a solution at low concentration is placed on the substrate and subjected to rotation. The spin coating process involves three stages. In the first stage, most of the solution is centrifuged off and a thin layer of solution remains on the substrate. In the second stage, this layer gets thinner as a result of liquid flow. The rapid evaporation of the solvent increases the viscosity of the solution and slows the shear thinning of the film. In the third stage, the solvent evaporation conserves the developed structure. Generally, the structures are created in a nonequilibrium stage, resulting from the rapid solvent quench, since typical spin coating times are only 30 to 60 s.
During spin coating, the solvent evaporates very quickly, giving rise to modulations of the surface induced by differences of surface tension (Marangoni effect). Of importance are thermocapillarity (the evaporating solvent creates a temperature gradient between the top and bottom of the film) and solutocapillarity (composition gradient between the top and bottom of the film).Reference Mitov and Kumacheva13–Reference Birnie17 The created modulations may increase in amplitude and eventually hit the substrate: the film breaks up by a dewetting process to minimize the area where the liquid has contact with the substrate. First, small dots form. In time they merge with the neighboring dots in a process called “coarsening,” resulting in larger dot size and lower density. Coarsening reduces the total free energy of the system by reducing interfacial area while maintaining a constant volume fraction.
So far, mainly nonvolatile polymers,Reference Bucknall2, Reference Geoghegan and Kraush18 liquid metal films,Reference Bischof, Scherer, Herminghaus and Leiderer4, Reference Herminghaus, Jacobs, Mecke, Bischof, Frey, Ibn-elhaj and Schalogwski6 and nanoparticle suspensionsReference Rabani, Reichman, Geissler and Brus19 have been used to prepare micro- and nanostructures induced by dewetting. Thiele et al.Reference Thiele, Mertig and Pompe20 studied the rupture mechanism, the first stage of dewetting, and its dependence on film thickness and humidity using volatile, spin coated nonwetting films containing collagen macromolecules.
In this work, we spin coat a volatile iron oxide precursor solution on a solid substrate. Dewetting, as also observed in thin films at rest and leading to a characteristic dewetting pattern, competes with the continuous thinning of the film due to evaporation, leading to additional forces for film destabilization (spinodal dewetting). This dynamic dewetting results in randomly distributed microdots, which is probably a superposition of structures initiated at different film thicknesses. The iron-containing organic molecules in the solvent aid the visualization of the developed structure after solvent evaporation and, after thermal treatment, serve as a source of the Fe2O3 microstructure. We investigated the effect of solvent volatility, temperature, substrate, and electric field on dot size distribution. We observed unimodal and bimodal size distributions depending on these parameters. We propose two potential mechanisms to explain the uni- and bimodality. One of them is shown to be valid, while the other is ruled out.
II. EXPERIMENTAL METHODS
Equimolar amounts (10 mmol each) iron(III)acetylacetonate (99%, Acros Organics, Geel, Belgium) and benzoylacetone (99%, Aldrich Chemicals, Buchs, Switzerland) were mixed in 1 mL methanol and stirred for 2 h at ambient temperature. To this Fe oxide precursor solution, 3 mL spin coating solvent (2-octanol, 1-pentanol, ethanol, or methanol) was added and stirred for a further 15 min. The solution was filtered with a 0.45 μm PTFE filter membrane and 0.1 mL of the solution was spin coated onto a polished silicon wafer (Si-Mat (Si-Mat Silicon Materials, Landsberg, Germany), Si(100), about 1 × 1 cm pieces) for 55 s. The rotational speed of the spin coater was varied between 1000 and 6000 rpm. Before spin coating, the wafers were cleaned in acetone in an ultrasonic bath, then rinsed with ethanol and dried under nitrogen flow. The initial thickness of the liquid films before spin coating was around 10 μm; it was determined by the specular reflectivity of a laser beam pointing at the sample during spin coating.Reference Jukes, Heriot, Sharp and Jones21 The films dried during spin coating and the whole dewetting process was completed before the end of the spin coating with methanol, ethanol, and pentanol. When octanol was used, because of its lower volatility, the process was slower and the final solvent evaporation, which conserves the already developed structure, was visible. The final film structures were examined by optical microscope (Leica) and atomic force microscope (NanoSurf-AFM Mobile S, tapping mode). Size distribution was determined using ImageJ image processing software.
III. RESULTS AND DISCUSSION
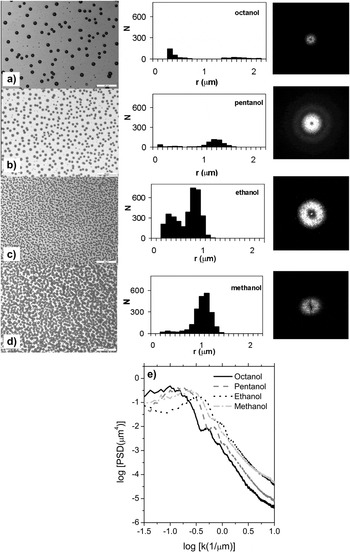
Figure 1 (left panel) shows a series of optical microscope images (scale bar 20 μm) of dots formed by spin coating iron(III)acetylacetonate [Fe(acac)] and benzoylacetone (bzac) solutions using four different alcohols as solvents with increasing volatility. Transition from structures consisting of some large dots surrounded by very small dots [Fig. 1(a)] toward densely packed small dots [Fig. 1(d)] is observed with increasing volatility.
Optical micrographs of dots obtained with different spin coating solvents (left panel) and resulting size distribution (middle panel) where r = radius (μm) of the dots, N = number of dots on the displayed area (10,758 μm2). (a) 2-octanol, (b) 1-pentanol, (c) ethanol, (d) methanol, and the corresponding FFTs (right panel). The scale bar is 20 μm on the microscopic images, the image size of the FFTs is 3.4 × 3.4 μm−1. The solution was spin coated on a silicon wafer with 4000 rpm for 1 min. (e) The power spectral density function (PSD) of the microscopic images (a)–(d).

The middle panel of Fig. 1 shows the size distribution of the dots on a representative area. When octanol, pentanol, and ethanol are used as spin coating solvents there are two well-separated peaks. The first peak is always around 400 nm (radius), and the second peak shifts to smaller values with increasing volatility, from octanol to ethanol [from about 1.7 μm to 800 nm, Figs. 1(a)–1(c)]. At the same time, the height of the dots increases with their size observed on AFM images (not shown). The increasing radius and height of the dots indicates that more material accumulates in the dots when less volatile, slower evaporating solvents are used. With less volatile solvents, the dots have more time to grow as a result of coarsening. In contrast, the position of the first peak at around 400 nm does not change with the solvents. However, the peak in the histogram almost completely disappears when methanol is used as the solvent. The clear bimodality of the size distribution in Figs. 1(a)–1(c) suggests two different dot-formation mechanisms. We propose the following explanation, which is supported by the facts that the dependence on the solvent volatility of the larger and smaller dots is completely different and that the small dots do not exist at all at the highest volatility. This explanation is based on the assumption that the two dot types form at different film thicknesses. We propose that we have two competing dewetting mechanisms. For larger film thicknesses, the film follows a classical heterogeneous dewetting pathway, (growing holes, formation of rims, break up into dots), the final morphology showing dots that are clearly aligned along a classical dewetting rim structure as typically observed in thin films at rest [Fig. 1(a)]. For smaller film thicknesses [Fig. 1(d)], a Marangoni-type instability becomes dominant, and the film destabilizes via homogeneous (spinodal) dewetting. This type of dewetting generates dots of similar size (unimodality). A bimodal size distribution in the final morphology can be an indication that both types of dewetting (heterogeneous and homogeneous) have played a role. In the initial stages of solvent evaporation, heterogeneous dewetting is dominant; upon solvent evaporation (as the film gets thinner), conditions also allow for spinodal dewetting (which is a faster process) to occur.
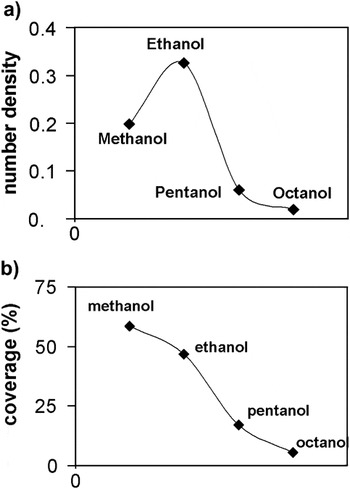
For low-volatility solvents, the film ruptures and dots form at the early stage of spin coating. As the solvent slowly evaporates, the dots have time to merge with their neighbors, i.e., to coarsen. With increasing volatility there is less time for the dots to merge, yielding more [larger number density—Fig. 2(a)], smaller dots covering a larger area of the surface [higher coverage—Fig. 2(b)]. However, there are still unruptured areas between the dots where the thickness reaches the critical range for spinodal dewetting, and the destabilizing forces break up these areas into small dots by spinodal dewetting. This process leads to the observed bimodal size distribution shown in Figs. 1(a)–1(c). When the volatility is high [Fig. 1(d)], the film reaches the critical thickness for spinodal dewetting very quickly as a result of very fast solvent evaporation. Therefore, the driving force for spinodal dewetting is also stronger and heterogeneous nucleation cannot start.
Effect of decreasing solvent volatility on number density and coverage. (a) Number density (μm−2) = number of dots/area of the whole image (μm2), (b) coverage (%) = area of the dots (μm2)/area of the whole image (μm2) × 100.

To support the hypothesis of two competing structure formation mechanisms, we analyzed the power spectral density (PSD) from the micrographs. The power values of the PSD were determined by a fast Fourier transform (FFT) algorithm. In the right panel of Fig. 1 we show the intensity distribution in reciprocal space as obtained from the FFT analysis. We first note that all FFTs with exception of the methanol sample are isotropic, as already presumed from the real space images, and the dots do not order along any preferential direction. In addition, all samples seem to show a ring of maximum intensity, which indicates the existence of a prominent in-plane length scale for all samples. Differences from sample to sample become obvious by azimuthally averaging over the rings to obtain the PSD [Fig. 1(e)]. Here, only the “ethanol” sample shows a distinct peak at log k = 0.45 1/μm, which corresponds to a characteristic length of 2.94 μm. The other extreme is the “octanol” sample, which shows a characteristic “knee” shape. In that presentation a peak is not visible, the ripple on the decaying branch of the curve (at log k = 0.3) is an indication of the monodispersity of the domains. From here we conclude that at least two different structure formation mechanisms are at play, one of which has a spinodal character. The two other samples (pentanol and methanol) show elements of both characteristic PSD shapes. The position of the kink implies information on the size of the particles. Consistent with the decrease of the domain diameter in the real space images from “octanol,” “pentanol,” to “methanol,” the kink position increases in that order.
A second potential explanation for the bimodality is based on the fact that all the bimodal size distributions occur when a mixture of solvents is used, i.e., methanol to dissolve the Fe(acac) and bzac, and the spin coating solvent: ethanol, pentanol, or octanol [Figs. 1(a)–1(c)]. When only one solvent, namely methanol, is used for both purposes, a unimodal size distribution is observed [Fig. 1(d)]. This could be explained by the coexistence of dewetting and phase separation with solvent mixtures and a simple dewetting mechanism with methanol alone.
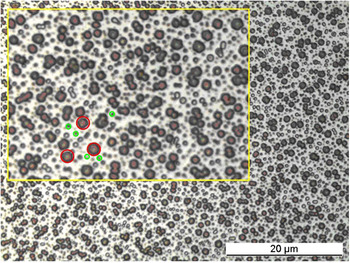
If the bimodal size distribution of the dots is the result of phase separation of the two solvents, a unimodal size distribution would be expected using only ethanol as the solvent. To test this, the experiment using methanol as the only solvent was repeated with ethanol. In this case a bimodal, not unimodal, size distribution was observed (Fig. 3), indicating that it is not the phase separation of the two solvents that is responsible for the bimodal distribution. If the phase separation of the two solvents induced the bimodal size distribution, using only one solvent should result in a unimodal size distribution, regardless of whether it was methanol or ethanol.
Micrograph of dots formed from a solution containing only one solvent (ethanol) showing a clear bimodal size distribution (inset with red large circles denoting large mode drops, and green small circles small mode drops).

AFM images of a scratch on the structures (not shown) also support the dewetting mechanism rather than phase separation, as the scratch is at the same level as the empty areas between the dots, which in this case is the substrate. This shows that there is no second phase between the dots; i.e., we can exclude phase separation into a wetting layer covering the substrate and a dot phase.
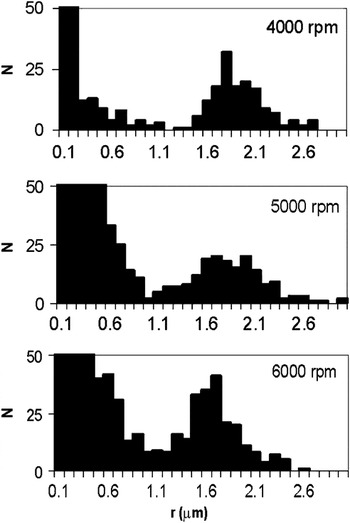
Increasing the rotational speed of the spin coater reduces the final thickness of a film,Reference Meyerhofer22 which means the solvent evaporates faster, leaving less time for the dots formed by heterogeneous dewetting to merge. This effect is demonstrated by the quantitative image analysis shown in Fig. 4, where the position of the second peak of the bimodal distribution shifts in the direction of smaller radius with increasing rotational speed (from 4000 to 6000 rpm). Evaluation of the first statistical moment〈r〉from the larger modes in Fig. 4 yields 1.84 μm (1.78 and 1.63 μm, respectively) for 4000 rpm (5000 and 6000 rpm, respectively). With very low spin coating speed (≤2000 rpm) large dots and randomly shaped patches of liquid form on the solid surface, indicating a very advanced merging stage and suggesting that the solvent has not evaporated completely. Again, the position of the first peak of the bimodal size distribution in Fig. 4 does not change (not shown).
Effect of spin coating rotational speed (thickness of the film) on the bimodal size distribution of dots formed using pentanol as the spin coating solvent. N = number of dots on an area of 10,758 μm2; r = radius (μm) of the dots.

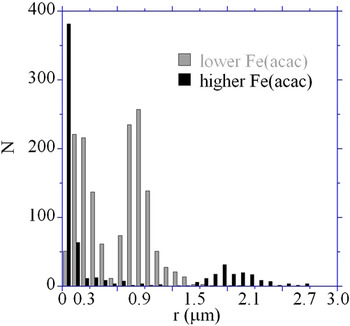
Figure 5 shows the effect of Fe(acac) concentration on the size distribution of dots formed when pentanol is used as the spin coating solvent. Halving the Fe(acac) concentration shifts the second peak to a much lower radius. By decreasing the amount of the component with the highest molecular weight in the solution the density and viscosity of the solution are drastically decreased. It is well known that thinner, stable films can be prepared by spin coating when solutions with lower concentrations are used.Reference Meyerhofer22 As the film with lower Fe(acac) concentration is stable until a much lower film thickness than with higher Fe(acac) concentration, there is less time for heterogeneous dewetting, and, therefore, for coarsening of the dots when a lower Fe(acac) concentration is used. Hence the size of the dots formed by heterogeneous dewetting is smaller (second mode of the bimodal size distribution). Spinodal dewetting quickly follows heterogeneous dewetting, providing the first mode (at smaller radius) of the bimodal size distribution in Fig. 5.
Effect of Fe(acac) concentration on the size distribution of dots formed using pentanol as the spin coating solvent and 4000 rpm rotational speed. N = number of dots on an area of 10,758 μm2; r = radius (μm) of the dots.

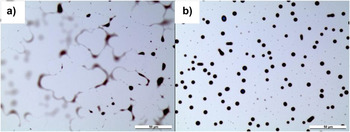
Heating the freshly made films immediately after spin coating to an elevated temperature (150 °C), using the least volatile solvent (octanol), accelerates the evaporation of the solvent so much that the film dries (all of the solvent evaporates) before the dewetting process can reach its final, dot stage over the entire substrate surface: at some areas the second stage of dewetting is conserved [Fig. 6(a)]. In this stage, the dewetted dry patches grow and the material is accumulated in the rim surrounding the growing holes. Some of these rims have already broken up into strings of small dots [Fig. 6(a)] via the Rayleigh instability. On other parts of the film the typical bimodal dot sizes are observed [Fig. 6(b)], but a few merging dots can still be seen (oval-shaped dots). The similarity of dot alignment in Fig. 6(b) and Fig. 1(a) provides further evidence that dewetting causes the dot formation.
(a) Dewetting pattern and (b) typical bimodal dots at 150 °C with octanol as the spin coating solvent and using 4000 rpm rotational speed. Scale bar is 50 μm.

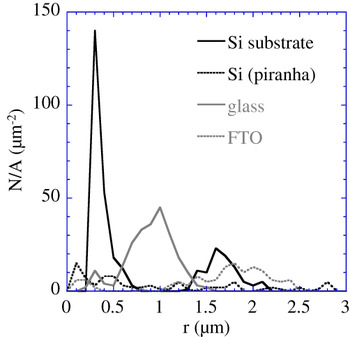
The preconditioning and type of substrate also affect the size of the dots (Fig. 7). When the silicon wafer substrate is cleaned with a mixture of sulfuric acid and hydrogen peroxide (so-called Piranha solution) instead of our usual method (with acetone and ethanol), a much wider size distribution is observed. Piranha cleaning solution is a strong oxidizer, removes most organic contaminants from the surface of the substrate, and also hydroxylates most surfaces (adds −OH groups). Hydrogen bonding can occur between these −OH groups on the surface of the substrate and the alcohol molecules of the solvent, but they are not strong enough to stabilize the film. Therefore, heterogeneous dewetting starts at a relatively early stage of the spin coating process and, as the solvent evaporates more slowly due to hydrogen bonding with the substrate, there is more time for coarsening, yielding larger dots. The longer evaporation time also means a wider range of thicknesses for heterogeneous and spinodal dewetting, resulting in a wide size distribution. On a glass (microscope slides from Menzel–Gläser, Braunschweig, Germany) substrate, the dot size is smaller than on silicon substrates regardless of the cleaning method of the silicon. In addition, it has a close to unimodal size distribution in contrast to the clear bimodal size distribution of the silicon substrates. The reason for this difference is that the hydrogen bonding between the −OH groups on the glass surface and the alcohol can be so strong that it stabilizes the film down to a very low film thickness, after which the thermal destabilizing forces break up the film into small dots by spinodal dewetting. On a glass coated with fluorine-doped tin oxide (FTO; Pilkington Corporation, Hartford Glass co, Inc., Hartford City, IN) the dot size is large and the distribution is bimodal. The rough surface of the FTO initiates the heterogeneous dewetting at high thickness resulting in large droplets and the subsequent spinodal dewetting causes the bimodality. (FTO and microscope slides were cleaned in ultrasonic bath with demineralized water, ethanol, isopropanol, and acetone for 5 min each).
Effect of different substrates on the dot size distribution using octanol as the spin coating solvent and 4000 rpm rotational speed. N = number of dots on an area of 10,758 μm2; r = radius (μm) of the dots.

Finally, we investigated the effect of the electric field on the dot size distribution (Fig. 8). When a material with a high dielectric constant is placed in an electric field, the magnitude of that field will be measurably reduced within the volume of the dielectric. Therefore, octanol is chosen as the solvent for electric field experiments having the lowest dielectric constant between the used alcohols. This is also the slowest evaporating solvent, giving us time to manipulate the process. Electrohydrodynamic instabilities caused by an electric field have been used to produce self-organized dots/pillars of polymers and inorganic materials.Reference Steiner and Huck23, Reference Voicu, Saifullah, Subramanian, Welland and Steiner24 An experimental setup developed for this purpose is used. The freshly spin coated film on a silicon substrate is placed parallel to another silicon wafer containing 600 nm high spacers to keep a constant distance between the two wafers and an electric field is applied. The electrostatically induced pressure across the interface is

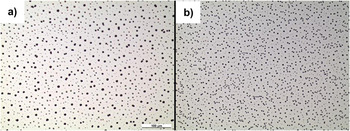
(a) Micrograph of dots formed without electric field and (b) with electric field (30 V) using octanol as the solvent and 4000 rpm rotational speed.

where ε0 is the permittivity of vacuum, εf is the dielectric constant in the film.Reference Steiner and Huck23 The electric field in the film E f can be expressed by:

where U is the applied voltage, d is the distance between wafers, and h is the thickness of the film. The characteristic invariant of that process is the wavelength λ, which in our case is the distance between formed dots:

where γ is the surface tension on the film surface. By increasing the applied voltage (U), the electric field E f in the film increases [Eq. (2)] in which case p also increases [Eq. (1)]. The distance between the dots decreases with increasing pressure [Eq. (3)], which can also be seen in Fig. 8. Without an electric field [in Fig. 8(a)] a wide range of dot sizes can be observed. When 30 V was applied immediately after spin coating in the described experimental setup for 20 min [Fig. 8(b)], smaller dot size with narrower distribution (smaller distance between the dots) is observed. The origin of that behavior can be understood by quantifying the balance of forces that act at the liquid–air interface. These forces determine the film destabilization wavelength [Eq. (3)] as well as the driving forces for droplet coalescence. The surface tension γ minimizes the liquid–air interface area, leading to coarsening of domains. On the other hand, the electrical field polarizes a dielectric medium that results in an effective displacement charge density at the liquid–air interface. Eventually, these forces can overcome the surface tension and limit coarsening.
IV. SUMMARY AND CONCLUSIONS
An organic iron oxide precursor solution has been used to prepare iron oxide microdots exploiting dynamic dewetting processes. Volatile solvents were used to spin coat the solution on a solid substrate. The superposition of different dot sizes has been observed resulting from the occurrence of different dewetting mechanisms at different film thicknesses during spin coating. Heterogeneous dewetting is responsible for the formation of dots at higher thicknesses, and spinodal dewetting breaks up the thin films into dots at lower thicknesses. We showed that phase separation is not responsible for the dot formation. The effect of solvent volatility, temperature, substrate, and electric field on dot size distribution has been investigated. Increasing the solvent volatility or the electric field decreases the dot size and narrows the size distribution. For less volatile solvents, the size distribution is bimodal, while a unimodal size distribution has been observed using more volatile solvents. On a silicon substrate, the size distribution is wider and the size is larger when the substrate is cleaned with Piranha solution than when it is cleaned with ethanol and acetone. On silicon substrates, the size distribution of the dots is bimodal regardless of the cleaning method. A comparison with dot sizes observed on silicon substrates showed smaller dot sizes on a glass substrate and larger dot sizes on an FTO substrate. The size distribution is clearly bimodal with FTO and close to unimodal with a glass substrate.
The conventional methods used to develop structured materials are the so-called “top-down” techniques, where structures are produced by fabricating the material by removing parts of it, i.e., lithography methods. In the past years considerable attention has been devoted to the so-called “bottom-up” techniques where the structure is built using self-assembling techniques. Dewetting is a simple, low-cost nonlithographic technique to pattern ceramic materials. The patterning is followed by a thermal treatment at 550 °C to produce crystalline Fe2O3 micropatterns.Reference Pal and Sharon25 Fe2O3 is an inexpensive photoactive material, which can be used in photovoltaic applications. It is well known that in such applications patterning can improve the performance of the photoelectrodes.Reference Kayes, Atwater and Lewis26 After annealing, the height of the dots decreases significantly from ∼360 to ∼20 nm. However, the diameter of the dots and the distance between their centers remained the same. Our method is not yet optimized for photoelectrochemical applications, but knowing how the solvent, substrate, and electric field affect the properties of the structure will help future work.
ACKNOWLEDGMENTS
Financial support for R.T. by the Empa Board of Directors 7th R&D Program and by the European Union FP7 Project “Nanostructured Photoelectrodes for Energy Conversion (NanoPEC)”, Novel Materials for Energy Applications (Grant No. 227179) is gratefully acknowledged. R.T. thanks SUL (Scanning Microscopy User Lab) at Empa for the opportunity to use their AFM.