Introduction
The need for new plant genetic material for crop improvement is increasing as environmental conditions change, and, as technologies advance, the opportunities for transferring desirable traits from crop wild relatives (CWR) to crops are expanding (see Brozynska et al., Reference Brozynska, Furtado and Henry2016). CWRs are wild plant taxa that have a broader genetic diversity than crops hence they are an excellent source of genes and traits to improve crops (Maxted et al., Reference Maxted, Ford-Lloyd, Jury, Kell and Scholten2006). Many countries have established national inventories of CWR and developed strategies and plans for their conservation, including China (Kell et al., Reference Kell, Qin, Chen, Ford-Lloyd, Wei, Kang and Maxted2015), Czech Republic (Taylor et al., Reference Taylor, Kell, Holubec, Parra-Quijano, Chobot and Maxted2017), England (Fielder et al., Reference Fielder, Brotherton, Hosking, Hopkins, Ford-Lloyd and Maxted2015), Finland (Fitzgerald, Reference Fitzgerald2013), Jordan (Magos Brehm et al., Reference Magos Brehm, Saifan, Taifour, Abulaila, Al-Assaf, El-Oqlah, Al-Sheyab, Bani-Hani, Ghazanfar, Haddad, Shibli, Taleb, Ali, Maxted, Maxted, Dulloo and Ford-Lloyd2016), Mexico (Contreras et al., Reference Contreras-Toledo, Cortés-Cruz, Costich, Rico-Arce, Magos Brehm and Maxted2018), Portugal (Magos Brehm et al., Reference Magos Brehm, Maxted, Ford-Lloyd and Martins-Loução2008), Spain (Rubio Teso et al., Reference Rubio Teso, Torres, Parra-Quijano, de la Rosa, Fajardo and Iriondo2017), Zambia (Ng'uni et al., Reference Ng'uni, Munkombwe, Mwile, Dulloo, Thormann, Gaisberger, Maxted, Magos Brehm and Kell2017) and South Africa (Department of Agriculture, Forestry and Fisheries, South Africa, 2016).
South Africa has the richest temperate flora globally (Germishuizen et al., Reference Germishuizen, Meyer, Steenkamp and Keith2006) with about 20,500 indigenous plant taxa represented (Raimondo, Reference Raimondo2011). It has high levels of plant endemism, with about 60% of species and subspecies restricted to the country and it has three of the world's biodiversity hotspots (Mittermeier et al., Reference Mittermeier, Robles Gil, Hoffmann, Pilgrim, Brooks, Mittermeier, Lamoreux and da Fonseca2004). There is a strong policy and legislative environment to conserve this diversity The National Strategy for Plant Conservation (Raimondo, Reference Raimondo2015) is aligned with the Global Strategy for Plant Conservation (https://www.cbd.int/gspc/strategy.shtml), which in turn is part of the Convention on Biological Diversity programmes. Target 9 of the global and the national strategy covers the conservation of the genetic diversity of crops, including their wild relatives (https://www.cbd.int/gspc/).
The compilation of a checklist or inventory of CWR is a critical first step for identifying which taxa require conservation and the conservation activities required (Fielder et al., Reference Fielder, Brotherton, Hosking, Hopkins, Ford-Lloyd and Maxted2015). The checklist of wild relatives of human food (including beverages) and fodder crops for South Africa includes 1593 taxa, or 7% of the total number of plant taxa in South Africa (SANBI, ARC and DAFF, 2017). Given the financial and human constraints to conserve the entire CWR diversity, taxa were prioritized based on their distribution (whether indigenous and endemic), their threat status in South Africa according to the 2001 International Union for Conservation of Nature (IUCN) categories and criteria (IUCN, 2001), potential for crop improvement according to the genepool (Harlan and de Wet, Reference Harlan and de Wet1971) or taxon group concepts (Maxted et al., Reference Maxted, Ford-Lloyd, Jury, Kell and Scholten2006) and socio-economic importance of the crop to which they are related. A total of 258 priority taxa were identified including relatives of cassava (Manihot esculenta), rice (Oryza sativa and O. glaberrima), rooibos tea (Aspalathus linearis), rye (Secale cereale), sorghum (Sorghum bicolor), soya bean (Glycine max), sugarcane (Saccharum officinarum, S. barberi, S. sinense), sweet potato (Ipomea batatas), wheat (Triticum aestivum) and yam (Dioscorea alata, D. bulbifera, D. cayenensis, D. dumetorum, D. rotundata, D. trifida) (Department of Agriculture, Forestry and Fisheries, South Africa, 2016; SANBI, ARC and DAFF, 2017).
While South Africa has legislation to protect biodiversity (South African Government, 2004) and a well-established protected areas network (Department of Environmental Affairs, South Africa, 2010), there are many competing demands in terms of socio-economic priorities and there are limited resources available for biodiversity conservation and management. Large parts of the country are being transformed through mining, monoculture agriculture and infrastructure developments (Jewitt et al., Reference Jewitt, Goodman, Erasmus, O'Connor and Witkowski2015). The most pragmatic approach to CWR species conservation is therefore to identify the taxa most requiring conservation and to develop a systematic conservation plan for these in agreement with existing protected area expansion strategies.
Systematic biodiversity conservation planning (Margules and Pressey, Reference Margules and Pressey2000) is widely accepted in South Africa as best practice for the identification of spatial biodiversity priorities (Balmford, Reference Balmford2003; Knight et al., Reference Knight, Driver, Cowling, Maze, Desmet, Lombard, Rouget, Botha, Boshoff, Castley and Goodman2006). This approach is a scientific method for identifying places of ecological importance, emphasizing the need to sufficiently represent all aspects of biodiversity (including setting quantitative targets for critical habitats, ecological processes, ecosystem services and species), and to secure the ecological processes that allow them to persist over time. The configuration of priority areas is designed to be spatially efficient (i.e. to meet targets in the smallest possible area), to take into account aspects such as connectivity in the landscape and to avoid conflict with other sectors and land-uses where possible (see Kukkala and Moilanen, Reference Kukkala and Moilanen2013).
This paper is a contribution to the in situ conservation of priority food and fodder CWR in South Africa. The priority CWR identified in SANBI, ARC and DAFF (2017) are categorized based on endemism and threat status, and targets are set for taxa based on a systematic approach which ensures that sufficient populations are protected, priority protected areas where CWR-rich areas occur are identified and areas that are critical for the conservation of priority CWR but which are not currently protected are mapped. Recommendations for formalizing the protection of these areas are also made.
Materials and methods
Occurrence data used for in situ conservation planning
The distribution of each of the 258 priority CWR was determined by compiling occurrence data from specimens in the three herbaria of the South African National Biodiversity Institute (SANBI), the Compton Herbarium (NBG), KwaZulu-Natal Herbarium (NH) and National Herbarium (PRE) (9965 records), and other data sources provided by SANBI including the vegetation ecologist John Acocks' plant records collected at 3000 sites across South Africa, (10,291 records), South Africa's Plant Invasive Atlas (3582 records), the Millennium Seedbank data (49 records), the Threatened Species Programme (575 records) and South Africa's Citizen Science virtual museum, iSPOT (www.ispot.org) (1057 records). The Crop Wild Relatives Global Occurrence Database (Sotelo, Reference Sotelo2017), which is available through the Global Biodiversity Information Facility (GBIF) at https://www.gbif.org/dataset/07044577-bd82-4089-9f3a-f4a9d2170b2e, and that includes occurrence data for more than 1300 CWR species from 193 crop gene pools from 100 data providers provided 1807 records. In 2016 we conducted field work to verify the localities for 30 CWR taxa for which there were few records or the status of populations at localities was uncertain (i.e. where it was suspected that development may have eradicated a population). This field work added 52 records. A total of 23,850 records were obtained for the priority CWR. Georeferencing to a fine spatial accuracy based on the collection locality description was undertaken where needed using a range of digital tools including Geolocate (http://www.geo-locate.org/), Google Earth and Google Maps, digitized toposheets, and various gazetteers. The quality of the data for species with narrow distributions was assessed by mapping each species and re-checking the co-ordinates and locality data for records that represented outliers in the map. All analyses were done at the species level.
Definition of units for spatial planning
We defined planning units based on a combination of parameters: land types (units with consistent soil and topography used in defining the far larger vegetation map units for many habitat types) (Department of Agriculture, South Africa, 1970–2001), catchments (quinary catchments, see Driver et al., Reference Driver, Nel, Snaddon, Murray, Roux, Hill, Swartz, Manuel and Funke2011), protected areas based on the South African Protected Area Database (SAPAD) (https://www.environment.gov.za/mapsgraphics#protectedareas_register) and mesozones, 50 km2 geographic units which divide South Africa into approximately 25,000 planning units and which are pragmatic because similar sized units have been used in previous conservation planning processes at a national scale and they align with the scale of available datasets (CSIR, 2011).
Planning units under 50 km2 were not further divided, but larger units were split by catchments, and mesozones if necessary to get fine enough units that linked to the landscape. Protected areas were treated as single planning units.
Identification of areas with high CWR richness
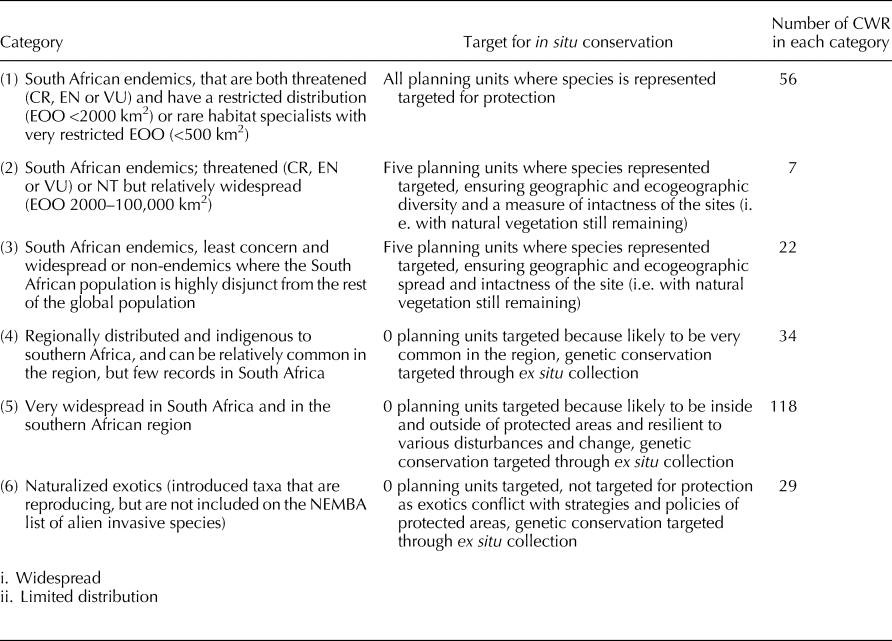
A 50 m buffer was created for each species occurrence point to ensure that records on the boundary of a planning unit were reflected as being present in both units. This was necessary because (i) the co-ordinates for point data are not all totally precise (the exact point of collection is not always known), (ii) the point data hopefully represent more than one individual of a species and (iii) as planning units were 50 km2, a species located right at the edge of a unit may be more closely linked to the adjacent unit (which may be a few metres away) rather than the furthest edge of the planning unit where the point is located. The buffers were then combined with the planning units. Where multiple occurrences of one species occurred in a single planning unit, the unit was treated as a single ‘population’ in terms of the targets set (see Table 1). Conservation targets were set for a number of geographically distinct planning units with that species present rather than just numbers of individuals (which could all be from the same population and location).
Targets set for systematic planning assessment for in situ conservation of priority CWR

Note only endemic species had targets set for in situ conservation, more widespread species should be targeted for ex situ conservation.
CR, critically endangered; EN, endangered; VU, vulnerable; NT, near threatened; EOO, extent of occurrence (IUCN, 2001).
A simple richness analysis that summed all CWR species occurrences per planning unit was conducted using the systematic conservation planning software Marxan 2.1.1 with CLUZ as the user interface for inputting data (Ball and Possingham, Reference Ball and Possingham2000; Smith, Reference Smith2004; Ball et al., Reference Ball, Possingham and Watts2009). Marxan is the most widely used conservation planning tool supporting the design of marine and terrestrial reserves worldwide and is used by more than 1300 users in over 100 countries worldwide (http://marxan.org/about.html).
Setting conservation targets for priority CWR
The approach used for setting targets for in situ conservation of priority CWR is presented in Table 1. The priority CWRs were categorized according to their Extent of Occurrence (EOO), and threat status according to the South African Red List for Plants (http://redlist.sanbi.org/) because these are the species most vulnerable to extinction. For those threatened CWR with a narrow distribution (EOO <2000 km2), all planning units where the species is represented are targeted for conservation, while for those CWR that have a wider distribution, but that are endemic to South Africa, five planning units where these taxa are represented are targeted. For species that are widely distributed, no targets were set because their risk of extinction is likely to be low.
The principles applied as the basis for setting targets for the conservation of CWR in South Africa were: (i) the conservation of five planning units for a species is enough to ensure the persistence of the species as they represent effectively its genetic diversity (Heywood et al., Reference Heywood, Casas, Ford-Lloyd, Kell and Maxted2007), and (ii) it is assumed that ecogeographic diversity is a proxy for genetic diversity and sampling from the maximum ecogeographic diversity will result in the most genetically diverse sample (Heywood et al., Reference Heywood, Casas, Ford-Lloyd, Kell and Maxted2007; Parra-Quijano et al., Reference Parra-Quijano, Draper, Torres and Iriondo2008).
Prioritization of protected areas for active in situ conservation of priority CWR
Once the CWR localities had been mapped an assessment of the importance of protected areas for CWR conservation was carried out. Protected areas were examined in terms of whether they were irreplaceable (i.e. needed to meet the in situ targets set for endemic CWR (categories 1–3 in Table 1)) and the number of species in categories 1–3 represented.
Four categories of protected areas were recognized:
• extreme richness: minimum of three category 1 species, and four category 1, 2 and 3 species
• high richness: minimum of two category 3 species and three category 1, 2 and 3 species
• moderate richness: minimum of one category 2 species and two category 1, 2 and 3 species
• other richness: minimum of one category 1, 2 and 3 species.
Number cut-offs per category were determined by examining the frequency distributions of species per category per unit and identifying natural breaks in the data.
Prioritization of areas outside protected areas required to meet targets for endemic, near endemic and threatened CWR
We used a standard systematic conservation planning approach following Margules and Pressey (Reference Margules and Pressey2000) and Balmford (Reference Balmford2003) to identify an efficient portfolio of sites to meet all targets at the lowest possible cost. This approach involves evaluating to what extent targets are met by existing protected areas, and then using Marxan 2.1.1 and CLUZ (Ball and Possingham, Reference Ball and Possingham2000; Smith, Reference Smith2004; Ball et al., Reference Ball, Possingham and Watts2009) to identify the least cost (see below) complementary portfolio of sites outside of existing protected areas that were most important for threatened, endemic and near endemic CWR (categories 1–3 in Table 1) that were not already sufficiently included within protected areas. Marxan iteratively strives to identify portfolios of planning units that are optimized for least solution cost, with cost being calculated by a combination of a penalty factor for not meeting targets for features and the total planning unit costs, and effectively Marxan is favouring smaller portfolios of lower cost sites. Importantly, we did not use a third element that is typically used in Marxan analyses to prioritize adjacent planning units, namely boundary costs. We did not want to prioritize sites that are adjacent given that there was a stated objective to achieve a geographic and ecogeographic spread.
We assumed all protected areas with CWR were effectively conserved. For example, where the target for a CWR was met in the protected area network, no further areas would be selected to meet targets for that species. We then examined all remaining planning units with priority CWRs in order to identify an efficient portfolio of sites to meet the conservation targets (Table 1).
The approach taken for CWR was to overlap the areas for conservation with priorities from national and provincial protected area expansion strategies, with areas likely to support resilience to climate change impacts and with areas that are least impacted by land transformation. This was done by defining different costs for planning units that are incorporated into the Marxan analysis as follows:
Base cost: We aimed for as small an area as possible. The base cost of a planning unit was determined by its area in hectares. This ensures that, all else being equal, targets will be met in the smallest area possible. This results in a spatially efficient solution.
Protected area expansion priories alignment cost: The underlying assumption was that area priorities for CWR that overlap with the existing national and provincial protected area expansion strategies priorities would have the highest likelihood of being implemented by national and provincial conservation agencies. Note that South African agencies have priority lists of areas or localities needing protection that are far in excess of their current implementation capacities, and hence even if the selected areas are on the existing priority lists, it is still worth highlighting them as this may result in them being secured earlier or in a worst case scenario would at least reduce the chance that they would be dropped off the provincial or national priority list. The percentage of each planning unit that was a national and provincial protected area expansion strategy was calculated as follows:
 $${\rm Area }\; \left( {{\rm ha}} \right) \times (100 - {\rm NPAES}\% )/10$$
where NPAES% is the percentage of the planning unit that is an identified priority in the National Protected Area Expansion Strategy (NPAES). Area (ha) is the size of the planning unit. This results in an area which is fully identified as a protected area expansion priority having no additional cost, while an area which had zero overlap with existing protected area priorities would have an additional cost of 10 times its area.
Climate resilience alignment cost: The underlying assumption was that priority sites for in situ conservation of CWR that overlapped with identified areas projected to support climate change resilience would both be more likely to persist into the future and more likely to be targeted for conservation activities. The existing identification undertaken for the National Biodiversity Assessment 2011 (Driver et al., Reference Driver, Sink, Nel, Holness, Van Niekerk, Daniels, Jonas, Majiedt, Harris and Maze2012) of areas projected to be important for supporting resilience was used. These areas include riparian and coastal corridors; landscapes with high diversity of temperature, precipitation and altitude; landscapes with high diversity of ecosystems, ecoregions and biomes; intact centres of endemism and large unfragmented landscapes. Areas with high ecosystem-based adaptation values (four or more of the feature types listed) were flagged as areas supporting resilience to climate change impacts for this study. The percentage of each planning unit that met this threshold was calculated. An addition cost for each unit was calculated as follows:
 $${\rm Area }\; \left( {{\rm ha}} \right) \times (100-{\rm EBA}\% )/10,$$
where EBA% is the percentage of the planning unit that was identified as being important for supporting climate change resilience. This results in an area which is fully identified as supporting resilience to climate change impacts having no additional cost, while an area which had zero overlap would have an additional cost of 10 times its area.
Alignment with natural areas cost. The underlying assumption was that natural sites should be prioritized for protecting priority endemic CWR. An up to date national landcover map (Geoterraimage, 2014) was used and supplemented with additional data on transformed areas, mostly dams, roads and fields compiled from various topocadastral GIS datasets, predominantly from the Department of Rural Development and Land Reform, National Geo-Spatial Information (http://www.ngi.gov.za/). The percentage of each planning unit that was transformed was calculated. An addition cost for each unit was calculated as follows:
 $${\rm Area }\;\left( {{\rm ha}} \right) \times \left( {{\rm Transformation}\% } \right)/10$$
where Transformation % if the percentage of the site that is not natural. This results in an area which is natural having no additional cost, while theoretically a fully transformed planning unit would have an additional cost of 10 times its area.
Combined cost. The combined cost of a planning unit was determined by the sum of the above four values:
 $$\eqalign {&\hbox{Base cost + Protected area expansion priories} \cr &\hbox{alignment cost} + \hbox{Climate resilience alignment cost} \cr &+ \hbox{Alignment with natural areas cost}}$$
The conservation planning algorithm used in Marxan attempts to meet targets while minimizing cost. Only intact areas of a planning unit are part of an area selected for the priority endemic CWR. Where the actual record for a priority endemic CWR was at a transformed site, the remaining intact areas of that planning unit were nevertheless considered from a precautionary perspective to represent potential habitat for that species, and remained available for selection. Where an endemic priority CWR species was found in a planning unit that was also a national and provincial protected area expansion strategy priority (Department of Environmental Affairs, South Africa, 2016), then this planning unit was automatically selected. We defined these priority units as those with at least a 10% overlap with protected area expansion priorities.
Results
Identification of areas with high richness of CWR
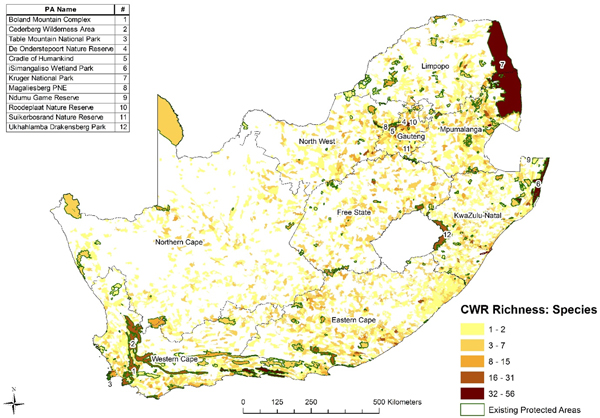
The northern and eastern parts of South Africa, which have summer rainfall, are important for CWR diversity, as well as some areas in the winter rainfall Western Cape Fynbos biome (Fig. 1). Several existing protected areas have high richness of CWR (Fig. 1). The Kruger National Park has 66 priority CWR and Isimangaliso Wetland Park, a World Heritage Site, has 51, while several small reserves in the heavily populated and developed province of Gauteng also have high richness: the Magaliesberg Protected Natural Environment in Gauteng has 55 CWR species, Suikerbosrand Nature Reserve has 30 species, the Cradle of Humankind has 33 species and Roodeplaat Nature Reserve has 30 species. The very small De Onderstepoort Nature Reserve which lies on the outskirts of the city of Pretoria has 46 species. Many of the CWR in these reserves are, however, widely distributed and occur in a number of protected areas and outside of these as well.
Richness patterns of food (including beverages) and fodder priority wild relatives in South Africa. Darker areas refer to higher richness (higher number of priority CWR).

Prioritization of protected areas for active in situ conservation of priority CWR
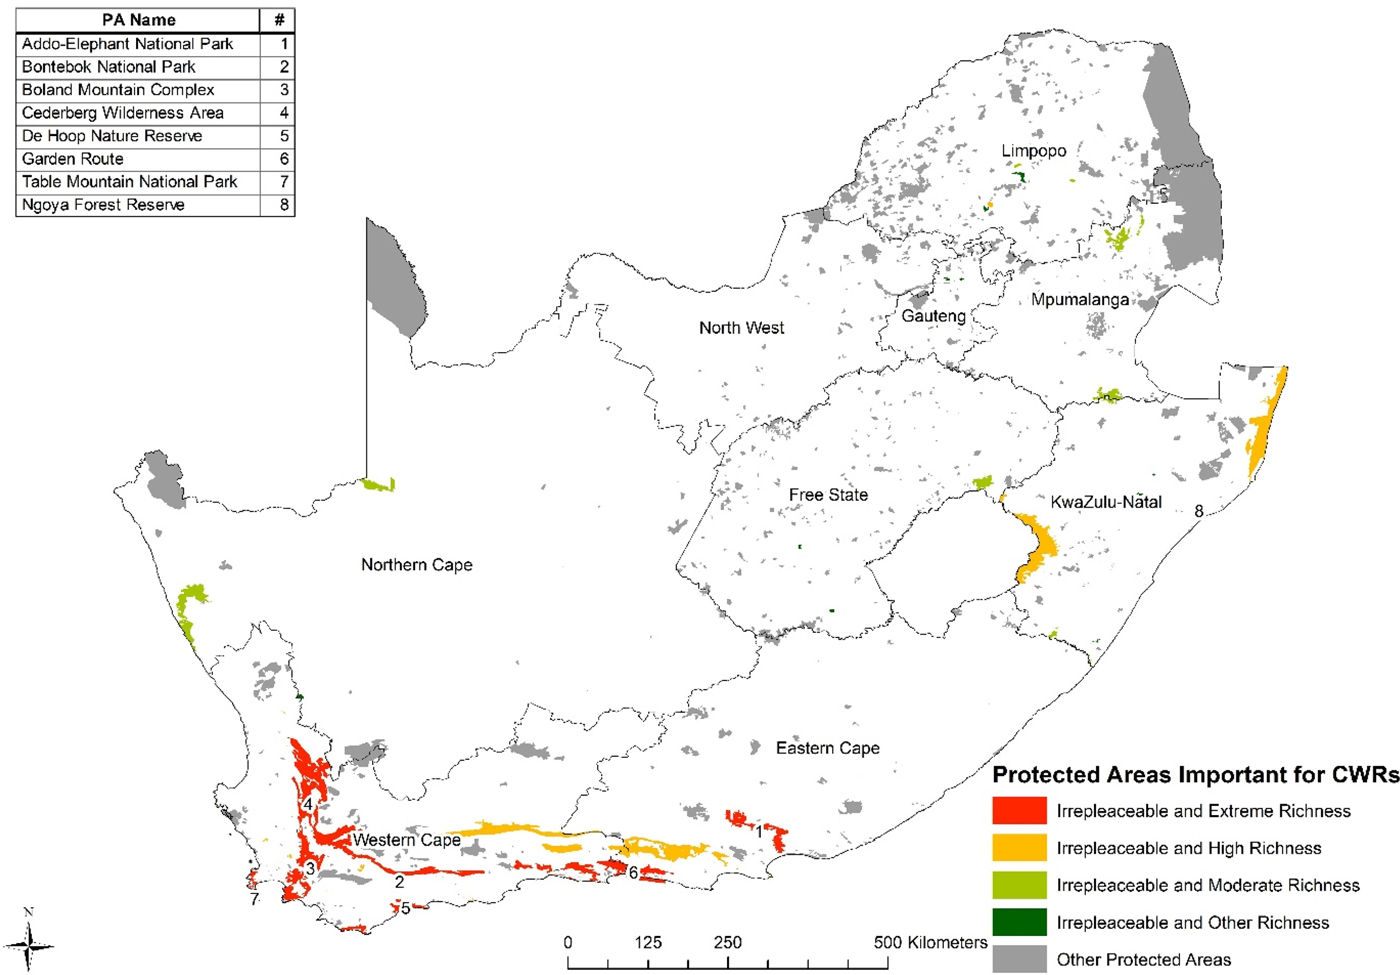
Ninety-two protected areas in South Africa have populations of priority CWR (Fig. 2) and 57 of these protected areas are considered irreplaceable in terms of the conservation of priority CWR. This means that they hold priority CWR species that are restricted to that particular protected area. Eight protected areas were categorized as being irreplaceable with extreme richness based on their contribution to conserving targeted populations of CWR species in categories 1–3, 12 as being Irreplaceable with high richness, 19 as irreplaceable with moderate richness and 18 as irreplaceable with at least one species in category 1, 2 or 3 (Fig. 2, online Supplementary Table S1).
Priority protected areas for the conservation of CWR based on irreplaceability, and number of narrow endemic CWR taxa. Extreme richness = minimum of three category 1 species, and four category 1, 2 and 3 species; high richness = minimum of two category 3 species and three category 1, 2 and 3 species; moderate richness = minimum of one category 2 species and two category 1, 2 and 3 species; other richness = minimum of one category 1, 2 and 3 species. The locations of the eight extreme richness protected areas are shown as numerals 1–8.

Meeting targets for in situ conservation of priority CWR
Eighty-eight of the 258 priority CWR are endemic to South Africa (Department of Agriculture, Forestry and Fisheries, South Africa, 2016, online Supplementary Table S1). The majority (63%) either do not occur in any protected area or they have less than 50% of the populations required to ensure long-term persistence occurring in a protected area (Table 2). Only 8% of endemic CWR are considered to be moderately represented in protected areas (51–80% of populations in protected areas) and 20% are currently well represented in protected areas, which means that they have more than the target number of populations in protected areas.
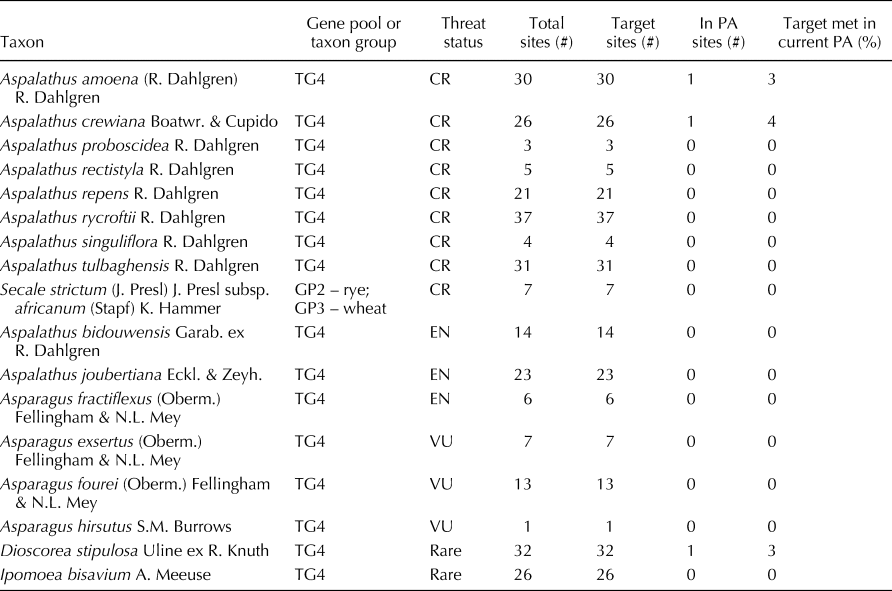
Restricted endemics that are threatened (including rare) and endemic to South Africa and not adequately conserved in a protected area

Aspalathus species are related to rooibos tea, Asparagus to asparagus, Secale to rye and wheat, Dioscorea to yam and Ipomea to sweet potato. Total sites indicate the number of sites from which the species is known. Gene pool or Taxon group indicate the potential for transfer of genes to the crop, GP2 = secondary genepool which means that gene transfer to the crop is possible but difficult using conventional breeding techniques; GP3 = gene transfer to the crop is impossible, or if possible requires sophisticated techniques (Harlan and de Wet, Reference Harlan and de Wet1971); TG4 = taxon group 4 which means species in the same genus as the crop (Maxted et al., Reference Maxted, Ford-Lloyd, Jury, Kell and Scholten2006).
CR, critically endangered; EN, endangered; VU, vulnerable (IUCN, 2001).
The highest priority CWR that are restricted endemics (EOO <2000 km), threatened and not conserved in a protected area are listed in Table 2. Close relatives of rooibos tea (A. linearis), make up the majority of these priority taxa. As with rooibos tea, all species in the genus Aspalathus are N2-fixing legumes which depend on specific soil bacteria for nodulation. Soil chemistry and availability of species-specific bacteria limit these species’ distributions and they tend to be highly range restricted and hence vulnerable to impacts of conflicting land uses.
Endemic relatives of asparagus (Asparagus), rye (Secale), yams (Dioscorea) and sweet potato (Ipomea) are also threatened and do not occur within any existing protected area or do not have sufficient populations in protected areas (Table 2, online Supplementary Table S1).
While there are major gaps in in situ conservation for priority CWR, there are several high priority CWR species that are well represented in protected areas. Relatives of rice, O. longistaminata, which is categorized as VU has 18 records from inside existing protected areas, and O. punctata, a non-endemic, is in three protected areas. Cucumis humifructus, a relative of cucumber and melon, has 13 populations in protected areas and the widespread yam relative, Dioscorea sylvatica var. sylvatica has 171 populations in protected areas (online Supplementary Table S1).
Prioritization of areas outside of existing protected areas for the conservation of CWR
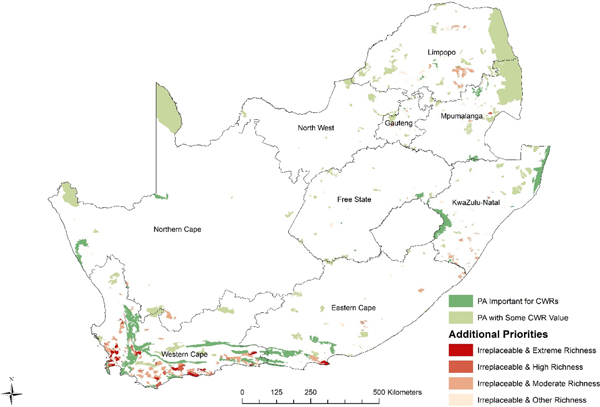
The CWR spatial assessment identified priority sites outside of the current protected area network that need to be conserved in order to ensure that at least five populations of all endemic CWR are conserved in situ. The areas identified are those that most align with priorities from national and provincial protected area expansion strategies, areas likely to support resilience to climate change impacts and areas that are least impacted by land transformation (Fig. 3).
Priority sites for the in situ conservation of CWR in South Africa including important existing protected areas and additional priority sites outside of existing protected areas required to meet targets presented in Table 1. Extreme richness = minimum of three category 1 species, and four category 1, 2 and 3 species; high richness = minimum of two category 3 species and three category 1, 2 and 3 species; moderate richness = minimum of one category 2 species and two category 1, 2 and 3 species; other richness = minimum of one category 1, 2 and 3 species. PAs important for CWR are those that are irreplaceable, while those that have some value are those that have high numbers of CWR.

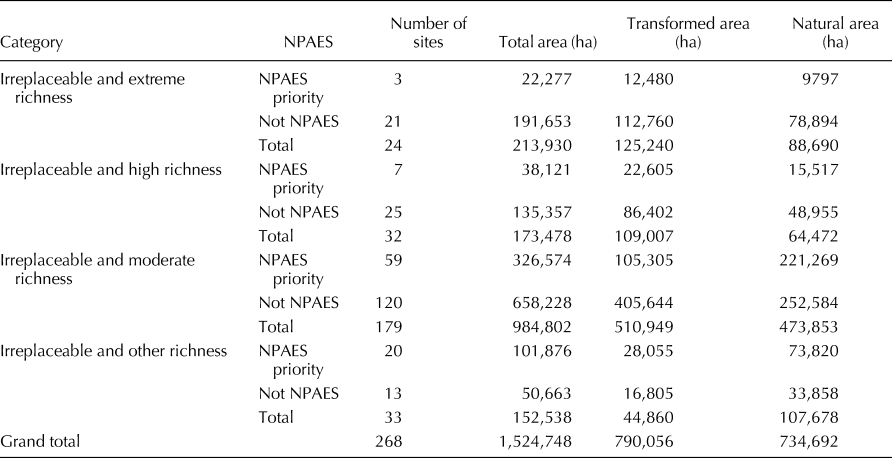
A total of 89 CWR priority sites outside the existing network of protected areas are National Protected Areas Expansion Strategy (NPAES) priorities. An additional 324 sites are needed to meet the remaining target for threatened, endemic and near endemic priority CWR (Table 3). The Western Cape has the highest concentration of priority sites for the conservation of endemic CWR that do not currently have sufficient populations in protected areas to ensure their conservation (Fig. 3). The Western Cape is the area of the Fynbos Biome where 60% of South Africa's plant species are found and many are restricted endemics. A total area of 734,692 ha outside of existing protected areas is required to protect the categories 1–3 CWR and of this, 414,298 ha is outside of areas that are identified in the NPAES (Table 3).
Number of sites and area outside of existing protected areas required to meet targets for CWR categories 1–3 taxa

Extreme richness: minimum of three category 1 species, and four category 1, 2 and 3 species; high richness: minimum of two category 3 species and three category 1, 2 and 3 species; moderate richness: minimum of one category 2 species and two category 1, 2 and 3 species; other richness: minimum of one category 1, 2 and 3 species. NPAES = National Protected Areas Expansion Strategy.
Discussion
The global and national policy and strategy context
Categorization as a global biodiversity hotspot not only reflects high richness and endemism but also high levels of loss and threats. In South Africa the main threats are conversion of natural habitat to agricultural lands, alien invasive species, overgrazing by livestock and large scale infrastructure development especially mining and urbanization (Raimondo et al., Reference Raimondo, Staden, Foden, Victor, Helme, Turner, Kamundi and Manyama2009). Identification of priority species and areas are important for decision-making not only to guide where development should be avoided but also for identifying where additional protected areas are required and within existing protected areas, what management and monitoring activities are required and CWR can and should now be considered.
South Africa has produced a second National Biodiversity Strategy and Action Plan (Department of Environmental Affairs, South Africa, 2015), which includes a number of proposed outcomes that align with the in situ conservation of CWR as addressed here including establishing a network of protected and conservation areas that includes a representative sample of species, and that is coherent and effectively managed.
There is thus a comprehensive policy context for the conservation of CWR and the proposed mechanism for this is through the expansion of the protected area estate through the NPAES. Previously the sites that require protection for CWR conservation had not been identified and food security was not considered in the identification of priority areas for protected area expansion. The approach used here for CWR is efficient in that it is aligned with and allows adjustment of existing priorities where necessary, rather than presenting an additional set of areas for conservation, which would not be feasible in a country where there are many competing land uses and economic constraints. The approach also avoids impacted and transformed land where possible and is aligned with areas likely to be climate change resilient. By presenting the CWR priority areas to various working groups of the national Department of Environmental Affairs that involve provincial representatives responsible for protected areas expansion, the priority areas for CWR conservation can be promoted for implementation. Apart from state-owned protected areas there are several other models for protected area expansion in South Africa, including stewardship programmes on private land (Gallo et al., Reference Gallo, Pasquini, Reyers and Cowling2009; Pasquini et al., Reference Pasquini, Cowling, Twyman and Wainwright2010) which will be important for protecting several priority CWR.
Monitoring and management of CWR in priority protected areas
A passive approach to conservation by merely including CWR in protected areas may not always be successful at maintaining a population. Over time genetic diversity may be eroded and the population may go extinct, or management activities such as burning or erosion control may be detrimental to the CWR (Hunter et al., Reference Hunter, Maxted, Heywood, Kell and Borelli2012). There is limited information about which active interventions are required for different CWR taxa and these will vary depending on the specific requirements of individual taxa and the habitat. Weeding to remove competitors, removal of alien invasive species, preventing grazing or modifying fire regimes and exposure are examples of the type of active management interventions that may be required (Hunter et al., Reference Hunter, Maxted, Heywood, Kell and Borelli2012).
The analyses carried out here identify protected areas with high richness of CWR, but awareness of the value of these plants needs to be promoted. South Africa is currently developing the second National Biodiversity Assessment (NBA) and inclusion of CWR in this Assessment will highlight their value. The NBA is widely used for planning and decision-making nationally. Additional materials that highlight the CWR in protected areas do need to be developed to promote their conservation.
There are limited resources available for managing and monitoring individual species that are not considered charismatic or as having direct economic value. Currently protected area staff in many reserves do monitor threatened plant species’ populations and it may be possible to expand these activities to CWR. At minimum, we suggest that the 56 category 1 CWR are included in protected area management plans and are monitored at least once every 5 years. Outside of protected areas, volunteers who work on the Custodians of Rare and Endangered Wildflowers (CREW, http://www.sanbi.org/biodiversity-science/state-biodiversity/biodiversity-monitoring-assessment/custodians-rare-and-endan) programme could include category 1 CWR in their activities.
The CWR in protected areas are unlikely to require specific management actions but threats such as inappropriate burning, alien invasive plants and overgrazing by livestock can be managed should these threaten priority CWR. Conservation of CWR outside of protected areas is critical for several reasons. While they have not been prioritized for in situ conservation, several of the CWR on the 258 priority taxa list are widespread and commonly grow in disturbed habitats such as along roads on in ploughed fields. The adaptations that have resulted from the selective pressures associated with regular disturbance may mean that these CWR possess traits that could be useful in crop improvement (Maxted and Kell, Reference Maxted and Kell2009; Fielder et al., Reference Fielder, Brotherton, Hosking, Hopkins, Ford-Lloyd and Maxted2015). Thirty-three of the 258 priority CWR species in South Africa only occur outside protected areas and while these populations might not require specific management, there should be awareness of their potential value so that they are not inadvertently eradicated. These populations can also be targeted for ex situ conservation to complement the genetic diversity represented by populations conserved in situ.
Ex situ conservation to complement in situ conservation
Ex situ conservation of CWR should be combined with in situ conservation actions (Maxted et al., Reference Maxted, Ford-Lloyd and Hawkes1997). Most of the South African CWRs are not adequately represented in ex situ collections such as botanical gardens and seed banks. Sixty-nine of the 176 priority CWR taxa included in this study (39%) are represented in the SANBI Botanical Gardens, the Millennium Seedbank Partnership (MSBP) at the Royal Botanic Gardens, in Kew or various international gene banks covered on the Genesys database (https://www.genesys-pgr.org/). Of these, 19 taxa are represented by a single sample from South Africa, although there may be more samples originating from populations outside of South Africa for non-endemic taxa. Only nine taxa have more than 20 samples from South Africa in the collections. This means that ex situ conservation of CWR in South Africa also requires attention.
Ex situ collections should aim to include genetic diversity and so the material should represent the ecogeographic diversity of taxa in South Africa. The map of CWR richness and the database of localities compiled for the CWR are both useful resources for identifying where material can be collected for ex situ conservation (Department of Agriculture, Forestry and Fisheries, South Africa, 2016).
Addressing knowledge gaps to improve in situ conservation of CWR in South Africa
Fielder et al. (Reference Fielder, Brotherton, Hosking, Hopkins, Ford-Lloyd and Maxted2015) recommend that the CWR checklist and the prioritization process be reviewed regularly (after about 10 years) and this should also be done in South Africa. The status of species in terms of Red List category and protection levels also need to be reviewed as more distribution data become available and new protected areas are proclaimed.
Ongoing plant surveys will provide better coverage of CWR distributions. The 258 priority taxa were represented by 23,850 records in South Africa while the 204 priority CWR for the Czech Republic were represented by 206,760 records in their analyses (Taylor et al., Reference Taylor, Kell, Holubec, Parra-Quijano, Chobot and Maxted2017). Many of South Africa's CWR may be represented in protected areas or may have a wider distribution than currently known.
‘Minimum’ and ‘optimum’ quality standards for in situ conservation of CWR (Iriondo et al., Reference Iriondo, Maxted, Kell, Ford-Lloyd, Lara-Romero, Labokas, Magos Brehm, Maxted, Dulloo, Ford-Lloyd, Frese, Iriondo and Pinheiro de Carvalho2012) provide guidance for both the design of the CWR conservation strategy, and for protected area managers. The minimum standards are the baseline requirements for any genetic reserve to function and fulfil its conservation objectives while optimum standards are a more rigorous set of requirements. The standards apply to the selection of areas, and attributes of the taxa and populations including aspects such as gene flow between cultivated crops and the protected CWR population, and demographic assessment and understanding, and defining the exact limits of the population in the protected area. The spatial plan meets the ‘Optimum’ standard described by Iriondo et al. (Reference Iriondo, Maxted, Kell, Ford-Lloyd, Lara-Romero, Labokas, Magos Brehm, Maxted, Dulloo, Ford-Lloyd, Frese, Iriondo and Pinheiro de Carvalho2012) for a few elements but there are large knowledge gaps that would need to be addressed to meet even minimum standards for some aspects.
The targets for CWR set here should be seen as a minimum required, especially in terms of representing genetic diversity. A study by Whitlock et al. (Reference Whitlock, Hipperson, Thompson, Butlin and Burke2016) on eight widespread but declining plant species with different breeding systems in the UK showed that conservation of only one population per species captured 63.7% of all alleles on average (range 43.1–78.4%), and 69.8% of common alleles, but represented only 3.7% of rare allelic variation. Conserving five populations under a randomized in-situ sampling design captured 86.4% of all and 91.1% of common alleles. In order to conserve all common alleles with 90% confidence using a fully randomized sampling design, it was necessary to conserve, on average, 87.8% of the total number of populations, equivalent to 16–29 populations per species. A similar investigation on selected CWR in South Africa should be carried out. It would probably be most pragmatic to start with those CWR that have been utilized or have the highest potential for the improvement of high value (economic and nutritional) crops, rather than the most threatened and narrowest endemics for this type of study.
Conclusions
CWRs have not previously been considered in South Africa's biodiversity strategies and activities. Through the development of a checklist (SANBI, ARC and DAFF, 2017), and a National Strategic and Action Plan for the Conservation and Sustainable Use of CWR (Department of Agriculture, Forestry and Fisheries, South Africa, 2016), and with the analyses and recommendations presented here, this shortcoming can be addressed. We believe that using an approach that is aligned with existing protected area expansion plans and that prioritises as small an area as possible, but with selected areas with untransformed habitat and with climate resilience, implementation should be both feasible and effective. Ex situ conservation plans should also be implemented in order to complement the in situ actions recommended here. Promotion of the value of CWR and the analyses presented here, targeting a range of stakeholders will be a critical aspect of achieving protection of CWR (Department of Agriculture, Forestry and Fisheries, South Africa, 2016).
Supplementary material
The supplementary material for this article can be found at https://doi.org/10.1017/S1479262118000503.
Acknowledgements
The research presented here formed part of the ‘National Strategic and Action Plan for the Conservation and Sustainable Use of CWR for South Africa’ which was jointly developed by the Department of Agriculture, Forestry and Fisheries (DAFF), South African National Biodiversity Institute (SANBI) and the Agricultural Research Council (ARC), as part of a project entitled ‘In situ conservation and use of crop wild relatives in three ACP countries of the SADC region’ (http://www.cropwildrelatives.org/sadc-cwr-project/). The project was co-funded by the European Union and implemented through the ACP-EU Co-operation Programme in Science and Technology (S&T II) by the African, Caribbean and Pacific (ACP) Group of States. Grant agreement no. FED/2013/330-210. We are grateful to Ehsan Dulloo and Imke Thormann (Bioversity International) and Shelagh Kell (University of Birmingham) for their input into different components of the broader project. We are also grateful to Hannelie Snyman and Brenda Daly who extracted SANBI data for the CWR, and to the team of staff who assisted with georeferencing of the records under the supervision of Fhatani Ranwashe. We thank two anonymous reviewers for their valuable comments.