Clay Minerals
For a long time, interest has been focused on clay minerals because they are abundant in nature and have potential for various applications. Clay minerals have a large surface area to volume ratio, ion exchange capacity, adsorption ability, and mucoadhesive property, which are fascinating as drug delivery carriers (Choy et al., Reference Choy, Choi, Oh and Park2007). In particular, layered double hydroxide (LDH), so-called anionic clay, consists of positively charged metal hydroxide sheets and interlayers of charge-compensating anions hydrated with water molecules. Recently, LDHs have been exploited extensively as delivery carriers for medical and biological purposes (Choi & Choy, Reference Choi and Choy2011a, Reference Choi and Choy2011b; Choi et al., Reference Choi, Oh and Choy2008a, Reference Choi, Choi, Oh, Oh, Park and Choy2010). A class of cationic clays, montmorillonite (MMT), is a bio-inspired layered material and applied widely for pharmaceutical formulation (Baek & Choi, Reference Baek and Choi2012; Baek et al., Reference Baek, Choy and Choi2012a). Although LDH and MMT are accepted generally as low-toxic materials, little information is actually available about their in vitro and in vivo toxicity.
Effect of Clay Minerals on Cell Proliferation or Viability
The short-term effect of clay minerals on cell proliferation can be evaluated with 3-(4,5-dimethylthiazol-2-yl)-2,5-diphenyltetrazolium bromide (MTT) or water soluble tetrazolium salt-1 (WST-1) assay after 24–72 h exposure. These are colorimetric assays, which measure the reduction of MTT or WST-1 by mitochondrial dehydrogenase in viable cells, giving rise to purple or dark red formazan. As a result, the assays actually measure the net metabolic activity of cells, thereby being reflective of the number of viable cells.
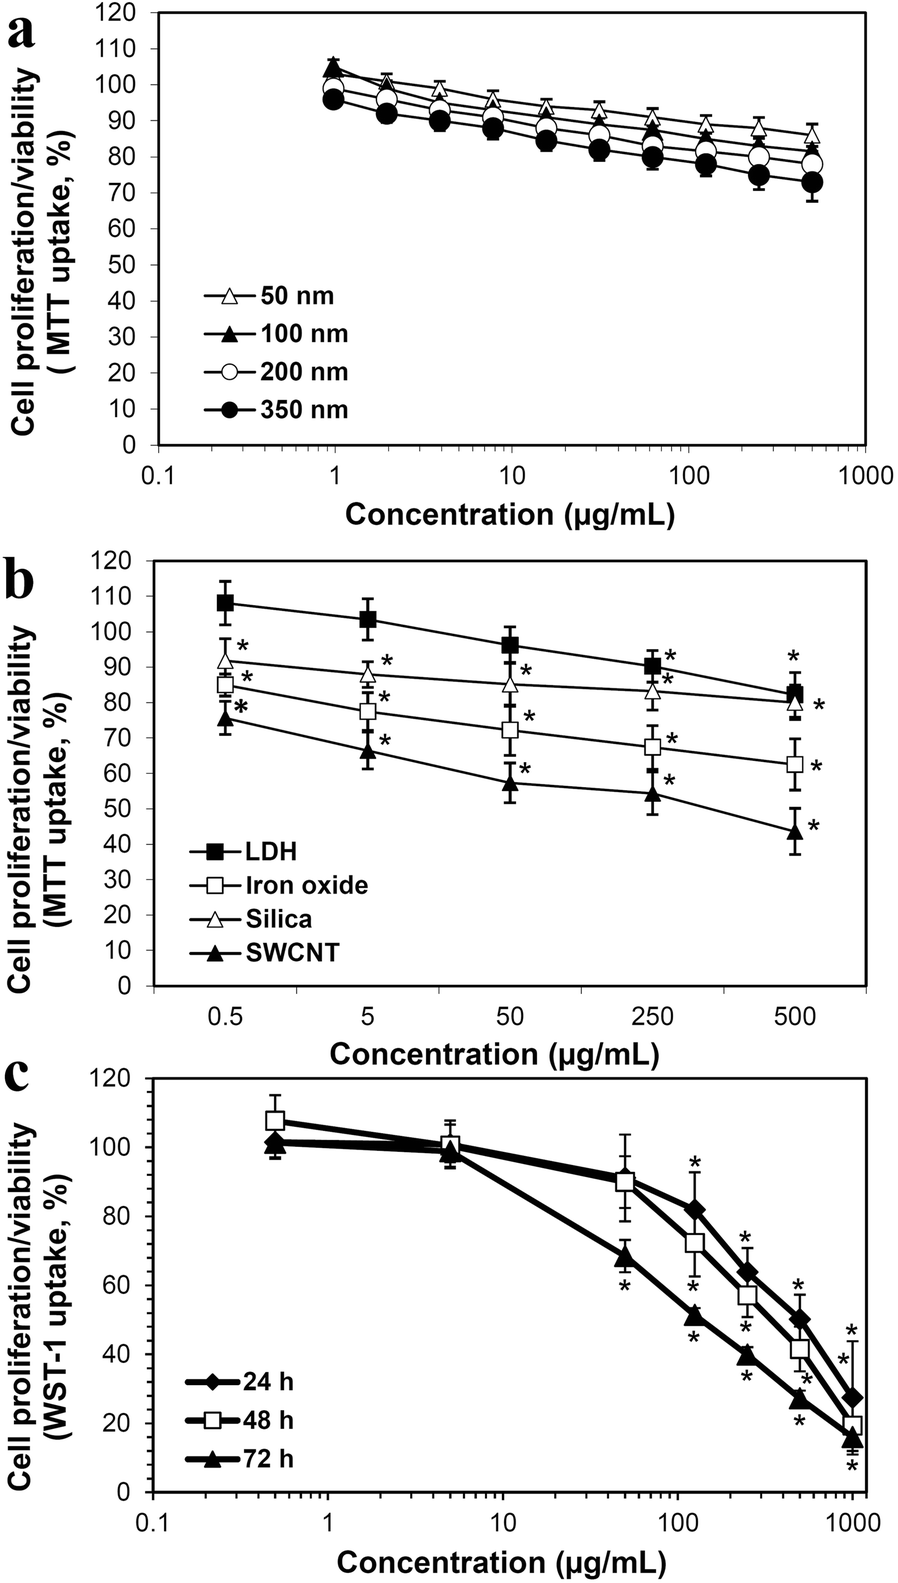
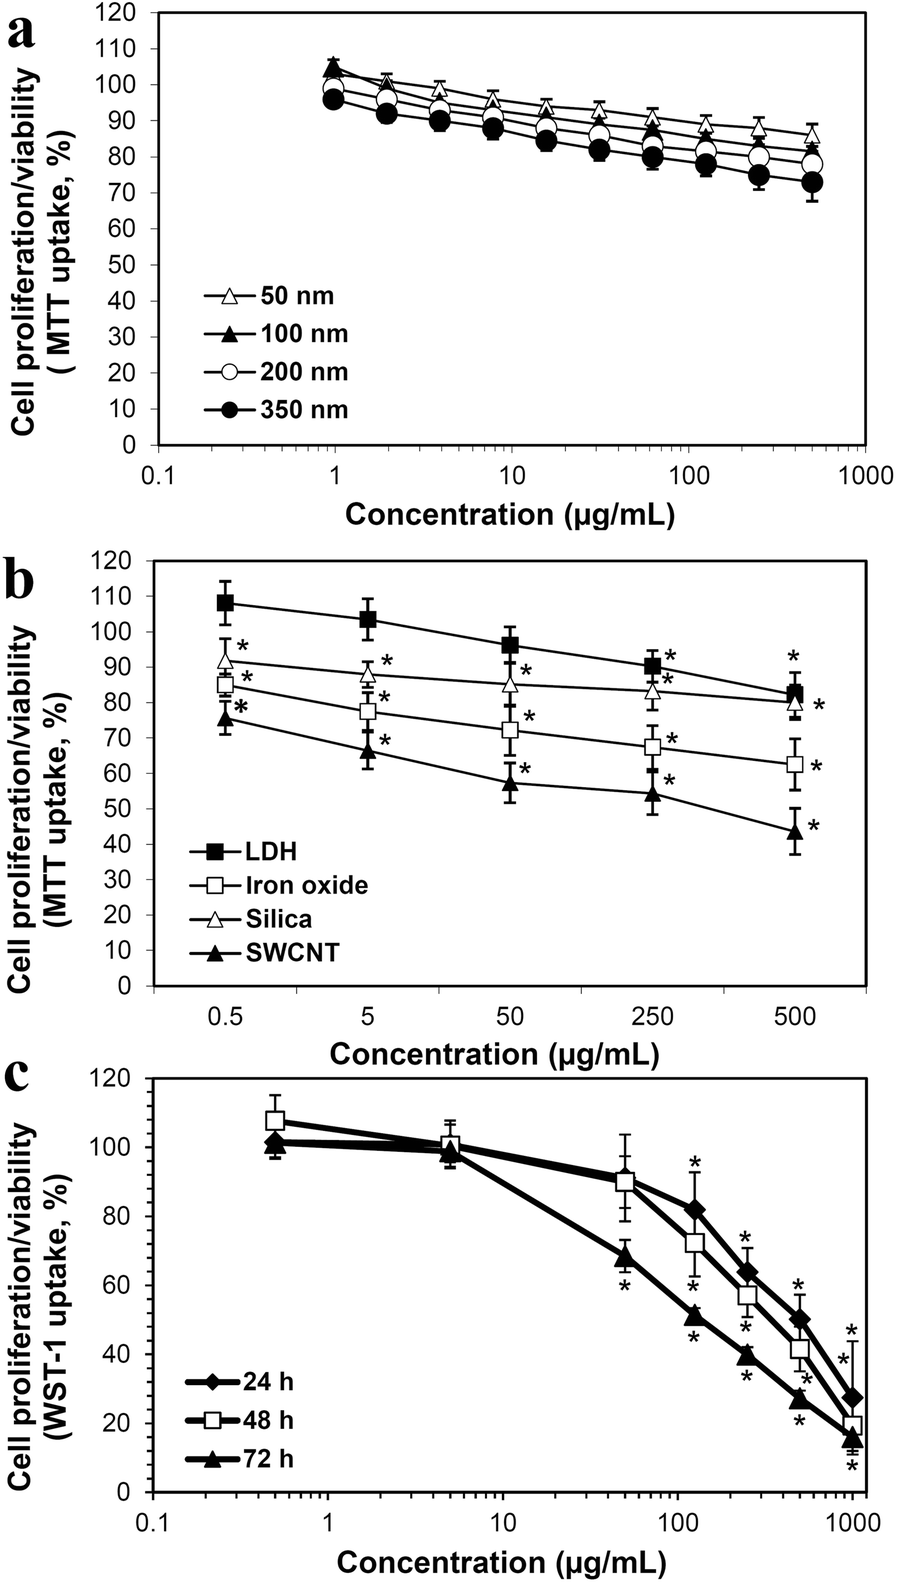
LDH nanoparticles (NPs) of various sizes (50, 100, 200, and 350 nm) did not inhibit remarkably cell proliferation of lung epithelial A549 cells, except at high concentrations (250–500 μg/mL after 48 h) (Fig. 1a) (Choi et al., Reference Choi, Oh and Choy2008b). However, the inhibition of cell proliferation by LDH-NPs (200 nm) was much less than that caused by iron oxide, silica, and single-walled carbon nanotube (SWCNT) (Fig. 1b) (Choi et al., Reference Choi, Oh and Choy2009). MMT was also found to affect the proliferation of human intestinal INT-407 cells, but at a high concentration of >100 μg/mL after 48–72 h (Fig. 1c) (Baeket al., Reference Baek, Lee and Choi2012b). Worth noting is that the cytotoxicity of LDH-NPs can be affected strongly by their physicochemical properties and chemical composition (Baek et al., Reference Baek, Lee and Choi2011; Choi & Choy, Reference Choi and Choy2011a, Reference Choi and Choy2011b).
Effect of LDH-NPs on cell proliferation of human lung epithelial A549 cells with respect to particle size after incubation for (a) 48 h and (b) concentration after incubation for 72 h. (c) Effect of MMT on human intestinal INT-407 cells with respect to concentration and incubation time. * denotes significant difference from the untreated control (p < 0.05). Reproduced, in part, from Choi et al. (Reference Choi, Oh and Choy2008b, Reference Choi, Oh and Choy2009), and Baek et al. (Reference Baek, Lee and Choi2012b) with the permission of American Scientific Publishers, Elsevier, and Springer Nature, respectively
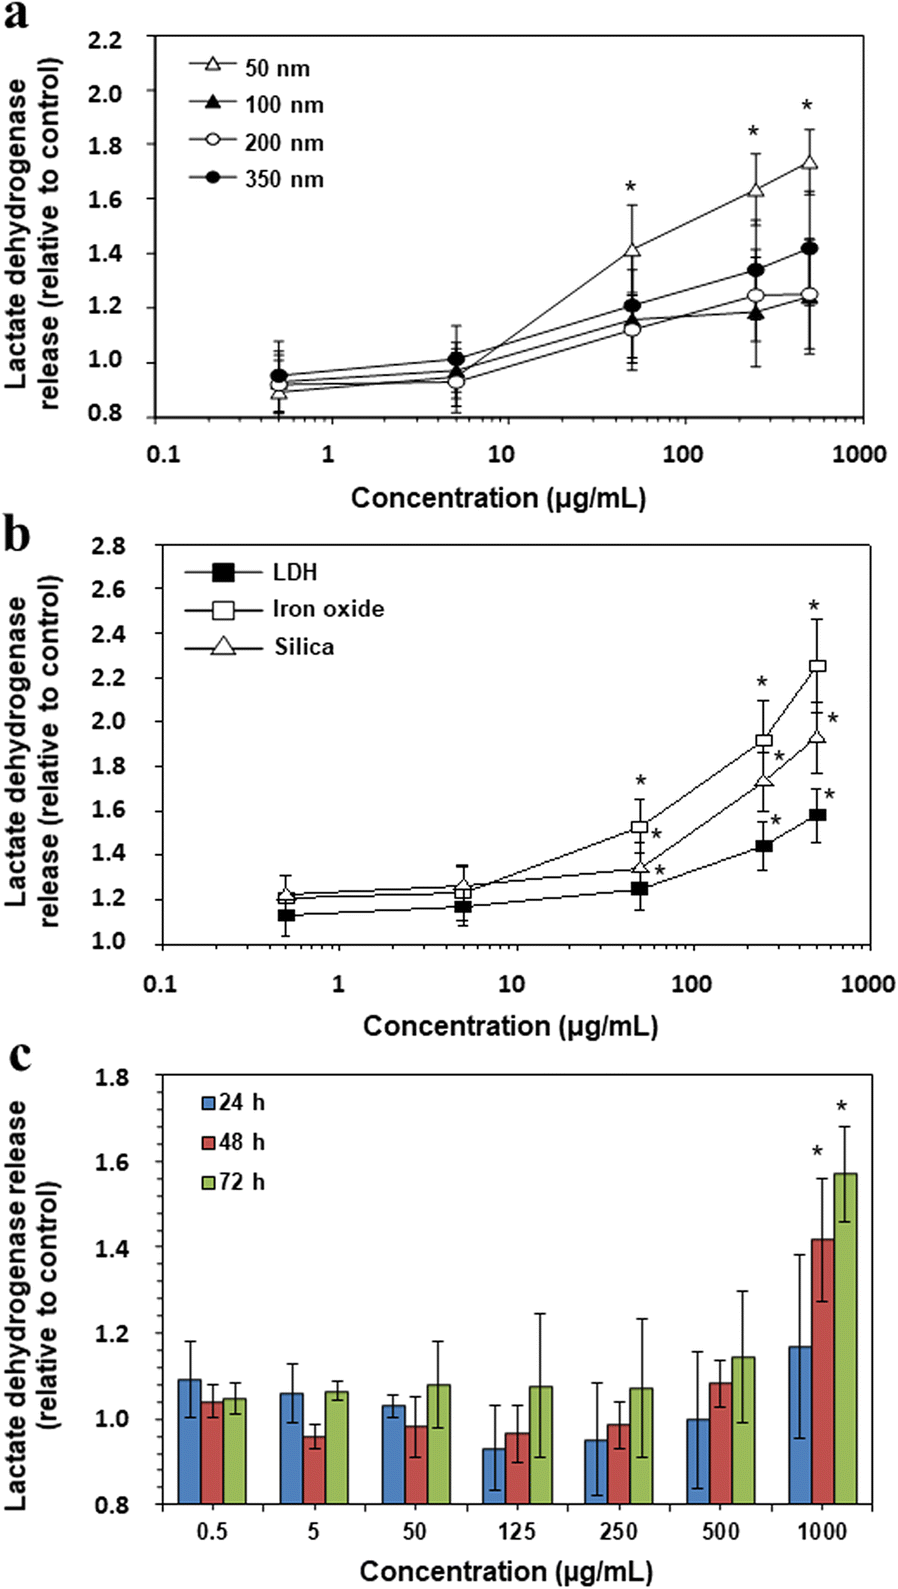
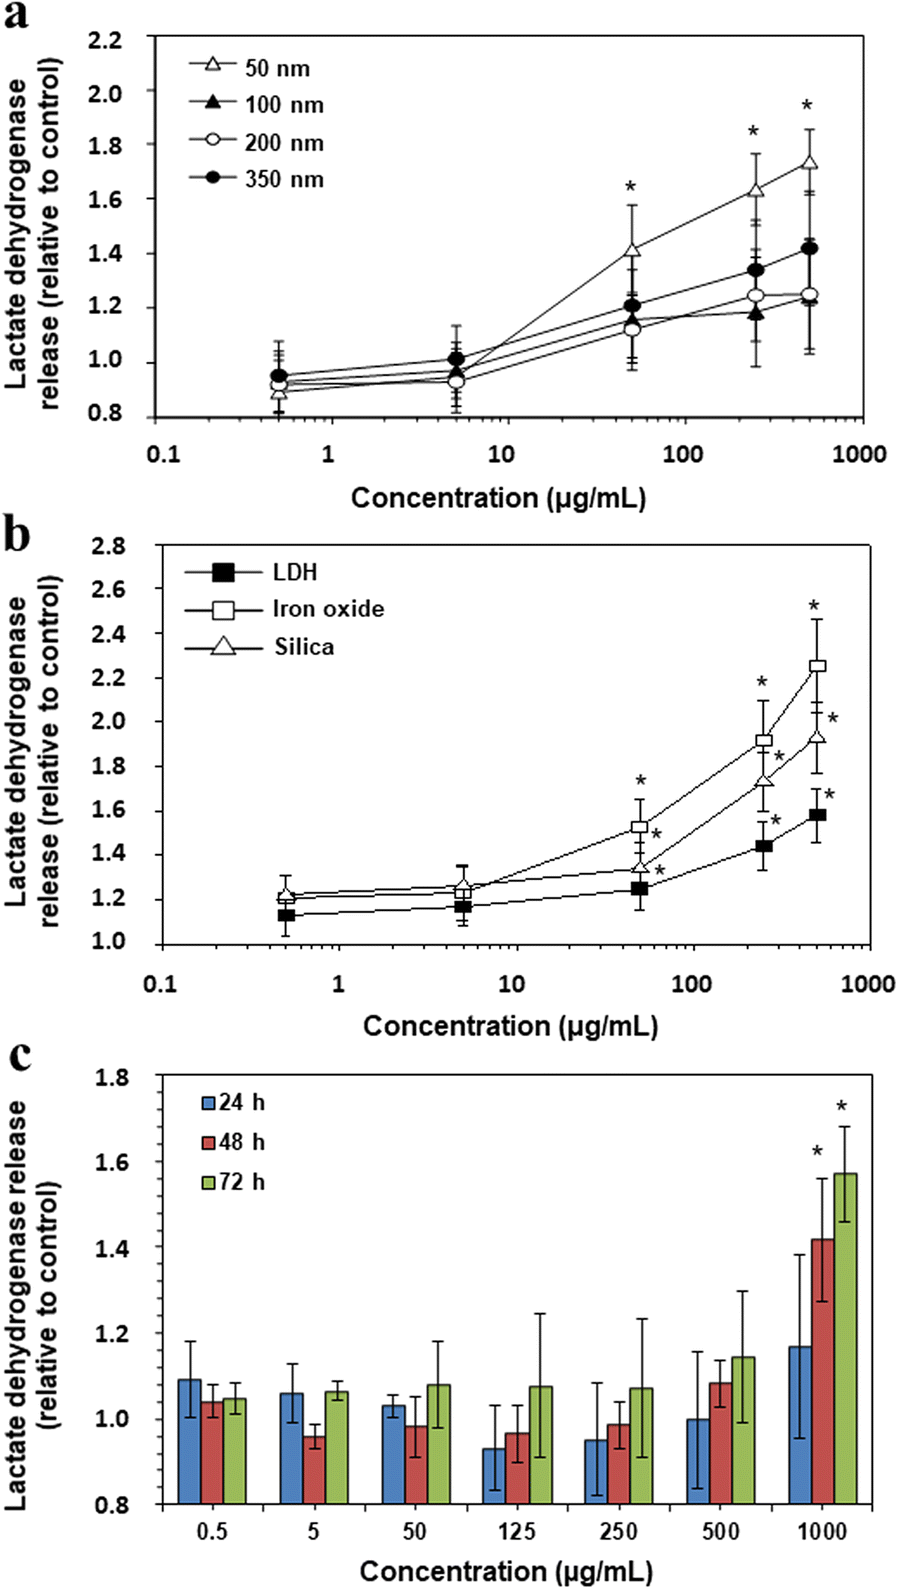
A soluble cytosolic enzyme, lactate dehydrogenase, present in eukaryotic cells, is released into the extracellular cell culture medium when the cell plasma membrane is damaged, thereby directly reflecting cell death. Thus, the released levels of lactate dehydrogenase by LDH-NPs were also evaluated. Size-dependent release of lactate dehydrogenase was found from A549 cells incubated with LDH-NPs for 48 h, showing that the greatest membrane damage was caused by 50 nm-sized NPs (Fig. 2a) (Choi et al., Reference Choi, Oh and Choy2008b). Meanwhile, relatively low levels of enzyme release by LDH (200 nm) were found compared to those caused by iron oxide or silica (Fig. 2b) (Choi et al., Reference Choi, Oh and Choy2009), which is in good agreement with the results obtained by MTT assay (Fig. 1b). On the other hand, MMT released significant levels of enzyme only at 1000 μg/mL after 48–72 h of exposure (Fig. 2c) (Baek et al., Reference Baek, Lee and Choi2012b).
Lactate dehydrogenase release from A549 cells treated with different sized LDH-NPs for (a) 48 h or (b) incubated with LDH, iron oxide, or silica for 72 h. (c) Released levels of lactate dehydrogenase from MMT-exposed INT-407 cells with respect to concentration and incubation time. * denotes significant difference from the untreated control (p < 0.05). Reproduced, in part, from Choi et al. (Reference Choi, Oh and Choy2008b, Reference Choi, Oh and Choy2009) with the permission of American Scientific Publishers, Elsevier, and Springer Nature, respectively
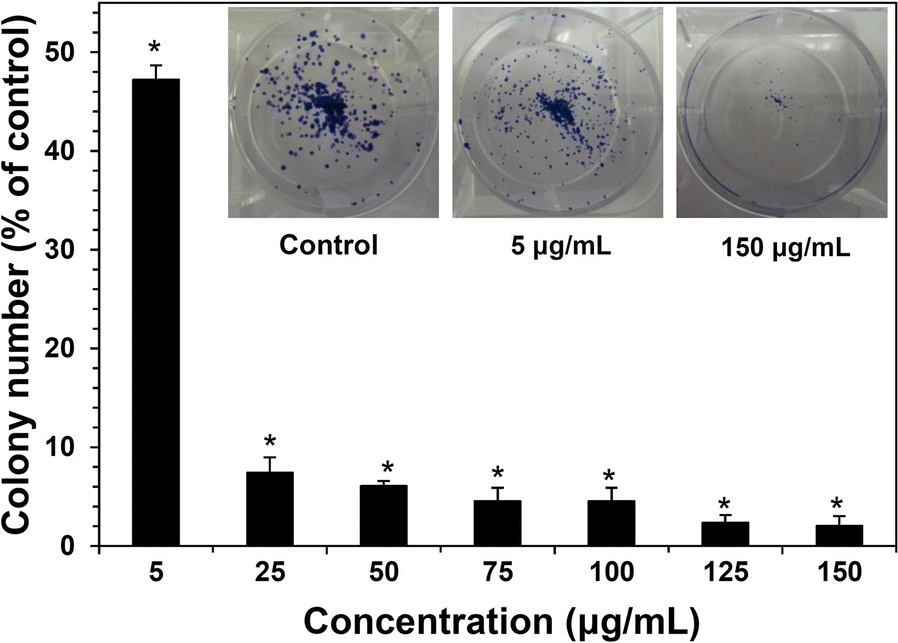
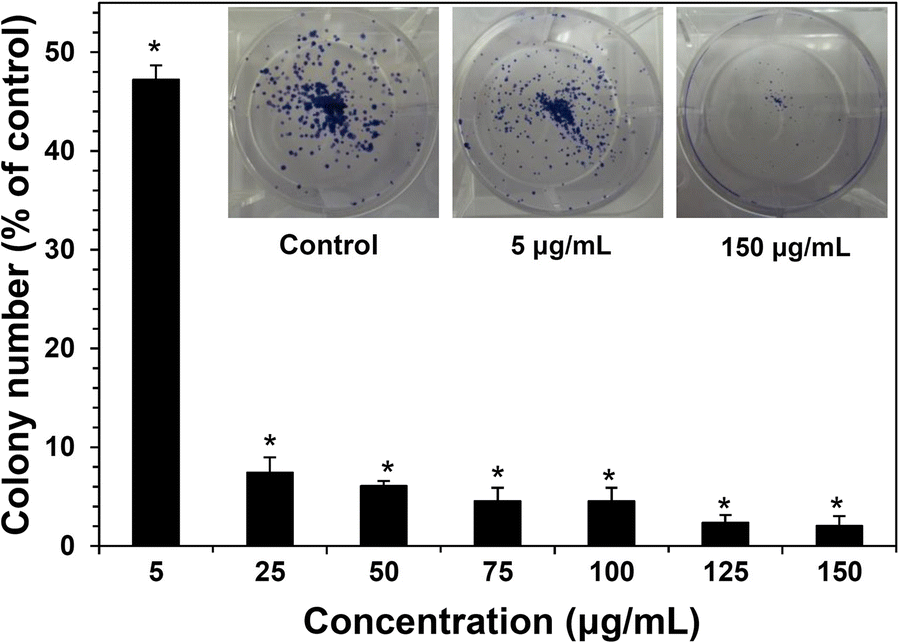
The long-term effect on cell proliferation can be investigated using clonogenic assay. This measures colony-forming ability, based on the fact that a single cell grows into a colony. Here, a colony is defined as a cluster of at least 50 cells, and a relatively long time exposure of 7–14 days depending on the cell line needed for colony formation. The colony can be determined after fixation with methanol and staining with crystal violet. MMT inhibited significant colony-formation ability after exposure for 10 days (Fig. 3) (Baek et al., Reference Baek, Lee and Choi2012b). However, worth noting is that in vitro long-time exposure to NPs is meaningful only when the NPs are observed to accumulate in specific organs. This type of assay is applied widely to evaluate whether an anticancer drug or therapy can reduce clonogenic survival of tumor cells.
Long-term inhibition of colony formation caused by MMT after exposure for 10 days. * denotes significant difference from the untreated control (p < 0.05). Reproduced, in part, from Baek et al. (Reference Baek, Lee and Choi2012b) with the permission of Springer Nature
Effect of Clay Minerals on Oxidative Stress
Several types of NPs were reported as causing oxidative stress; oxidative stress can be evaluated by measuring the levels of reactive oxygen species (ROS) inside cells. The cell-permeant 2′,7′-dichlorodihydrofluorescein diacetate (H2DCFDA) dye is applied as an indicator of intracellular ROS. The dye is non-fluorescent, but converts to green fluorescent dichlorofluorescein (DCF) upon oxidation by ROS after cleavage by intracellular esterases.
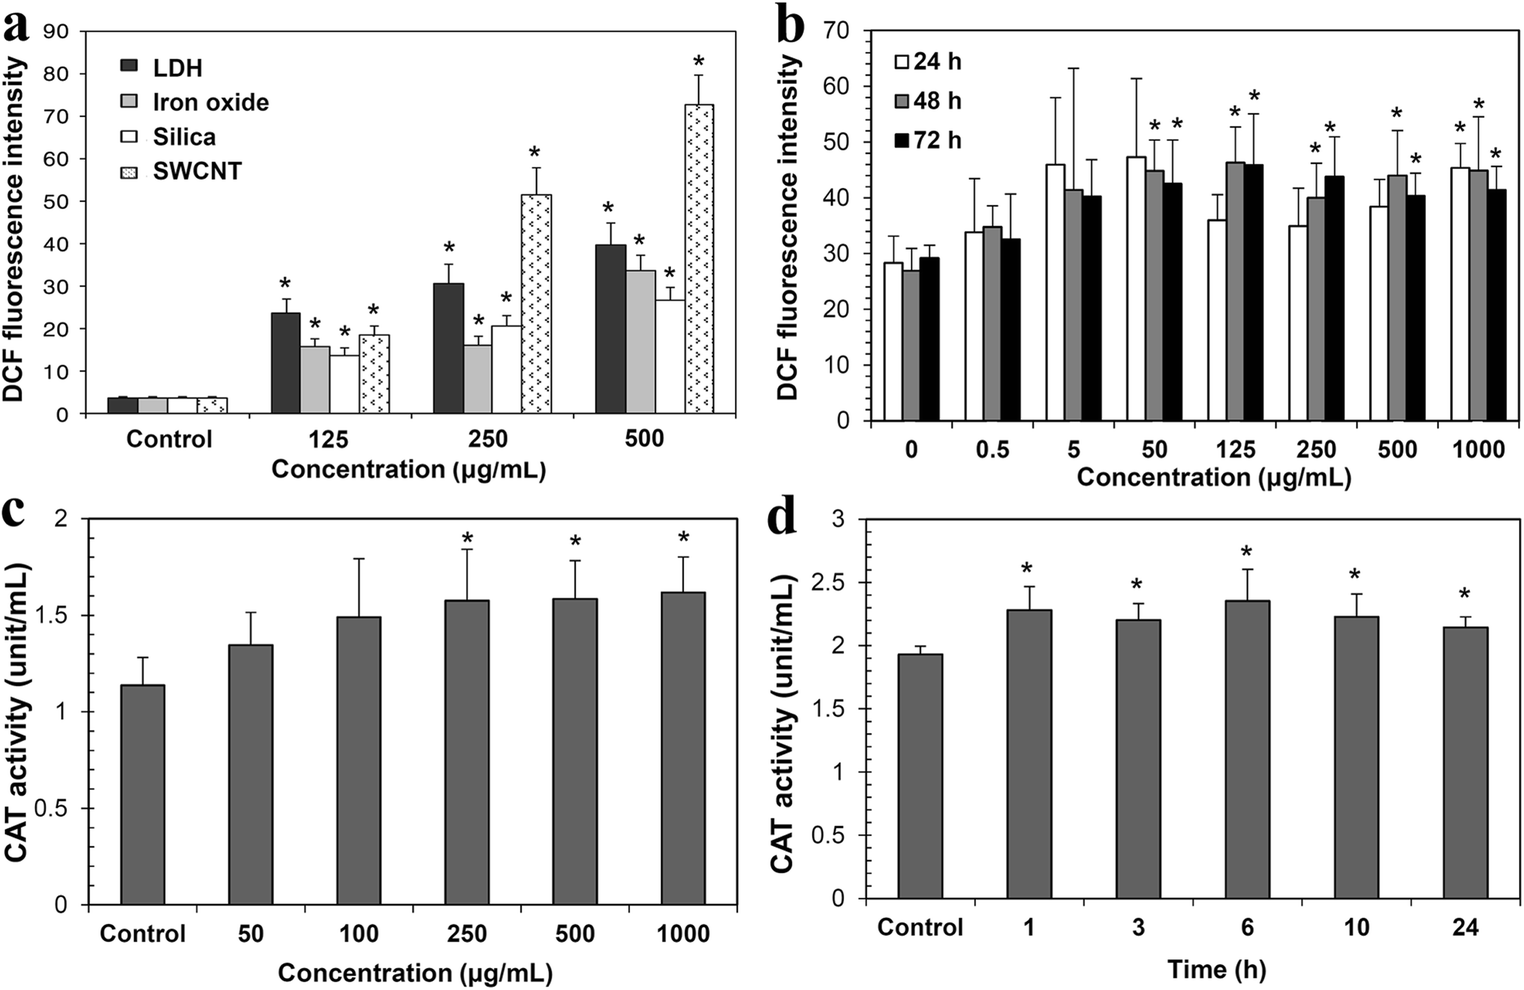
LDH-NPs (200 nm) and MMT were found to generate ROS (Fig. 4a and b) in A549 cells and INT-407 cells, respectively, indicating induction of oxidative stress (Baek et al., Reference Baek, Lee and Choi2012; Choi et al., Reference Choi, Oh and Choy2009). However, ROS generation was observed only at high concentration (>100 μg/mL) and after 48–72 h exposure. Moreover, relatively low ROS generation by LDH-NPs was observed compared to SWCNT.
ROS generation caused by (a) LDH, iron oxide, silica, and SWCNT after incubation for 72 h and by (b) MMT with respect to concentration and incubation time. Increased CAT activity (c) in LDH-NPs-treated A549 cells with respect to concentration after incubation for 24 h and (d) in 500 μg/mL LDH-treated cells with respect to incubation time. * denotes significant difference from the untreated control (p < 0.05). Reproduced, in part, from Choi et al. (Reference Choi, Oh and Choy2009, Reference Choi, Paek and Yu2015) and Baek et al. (Reference Baek, Lee and Choi2012b) with the permission of Elsevier, Springer Nature, and Dovepress, respectively
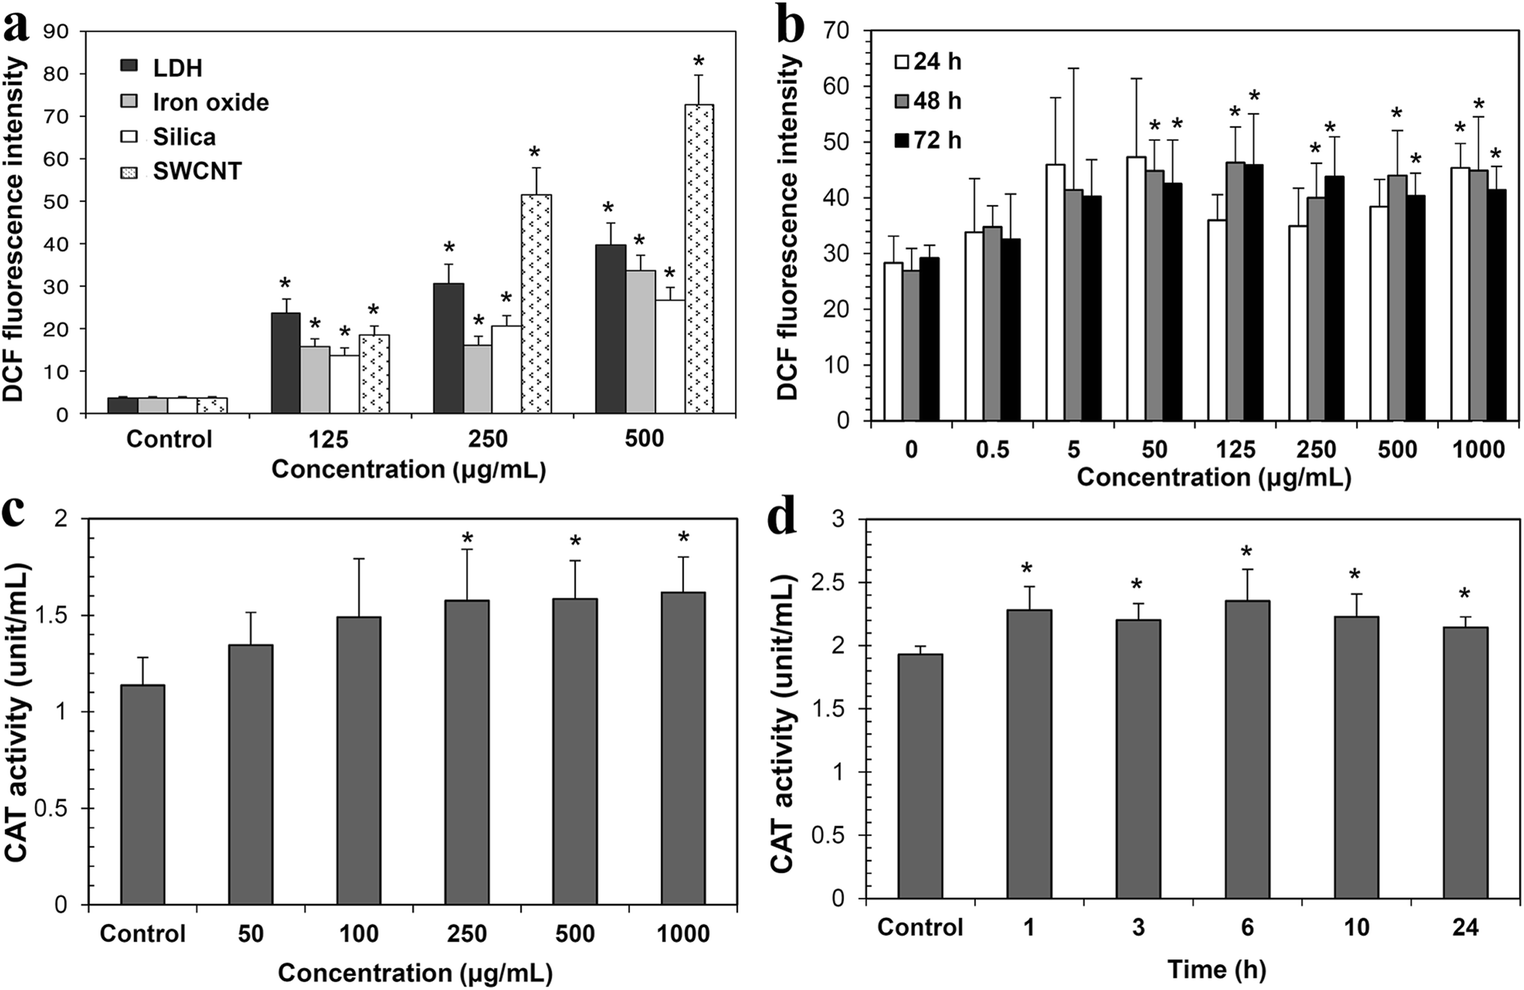
Oxidative stress caused by NPs was further evaluated by analyzing antioxidant enzymes, such as catalase (CAT), glutathione reductase (GR), superoxide dismutase (SOD), and heme oxygenase-1 (HO-1), in LDHs-exposed A549 cells (Choi et al., Reference Choi, Paek and Yu2015). These enzymes metabolize oxidative toxic intermediates, and their expression and activity increase the protection of cells against oxidative stress. The activity of CAT, GR, SOD, and HO-1 increased in cells exposed to LDH-NPs (100 nm) at 250–1000 μg/mL for 24 h (Fig. 4c) (Choi et al., Reference Choi, Paek and Yu2015). But, the antioxidant enzyme activity increased rapidly even after 1 h of exposure to 500 μg/mL LDH-NPs (Fig. 4d). Interestingly, LDH-NPs at a concentration of 500 μg/mL did not inhibit cell proliferation for 24 h (Choi et al., Reference Choi, Paek and Yu2015). LDH-NPs are likely, therefore, to produce ROS, thereby increasing antioxidant enzyme activity in order to control and neutralize ROS. The detoxification process by antioxidant enzymes may have a minor effect on cell proliferation (Fig. 1b).
Indeed, diverse NPs including CNT, silica, iron oxide, and zinc oxide (ZnO) have been reported to cause oxidative stress, but at much lower concentration levels and after shorter time exposure than LDH-NPs (Ng et al., Reference Ng, Yong, Hande, Ong, Yu, Bay and Baeg2017; Pongrac et al., Reference Pongrac, Pavicic, Milic, Brkic Ahmed, Babic, Horak, Vinkovic Vrcek and Gajovic2016; Shvedova, Pietroiusti, Fadeel & Kagan, Reference Shvedova, Pietroiusti, Fadeel and Kagan2012; Zuo et al., Reference Zuo, Duan, Jia, Chu, He, Yuan, Dai, Li, Xing and Wu2016).
Effect of Clay Minerals on Inflammation Response
Inflammation can be a toxicity endpoint caused by diverse types of NPs. In vitro inflammation induction is evaluated by measuring the levels of pro-inflammatory cytokines, such as interleukin-1 (IL-1), IL-6, IL-8, and tumor necrosis factor (TNF). Pro-inflammatory cytokines are signaling molecules, which are excreted from immune cells and other cell types that promote inflammation. These cytokines play a role in mediating the innate immune response.
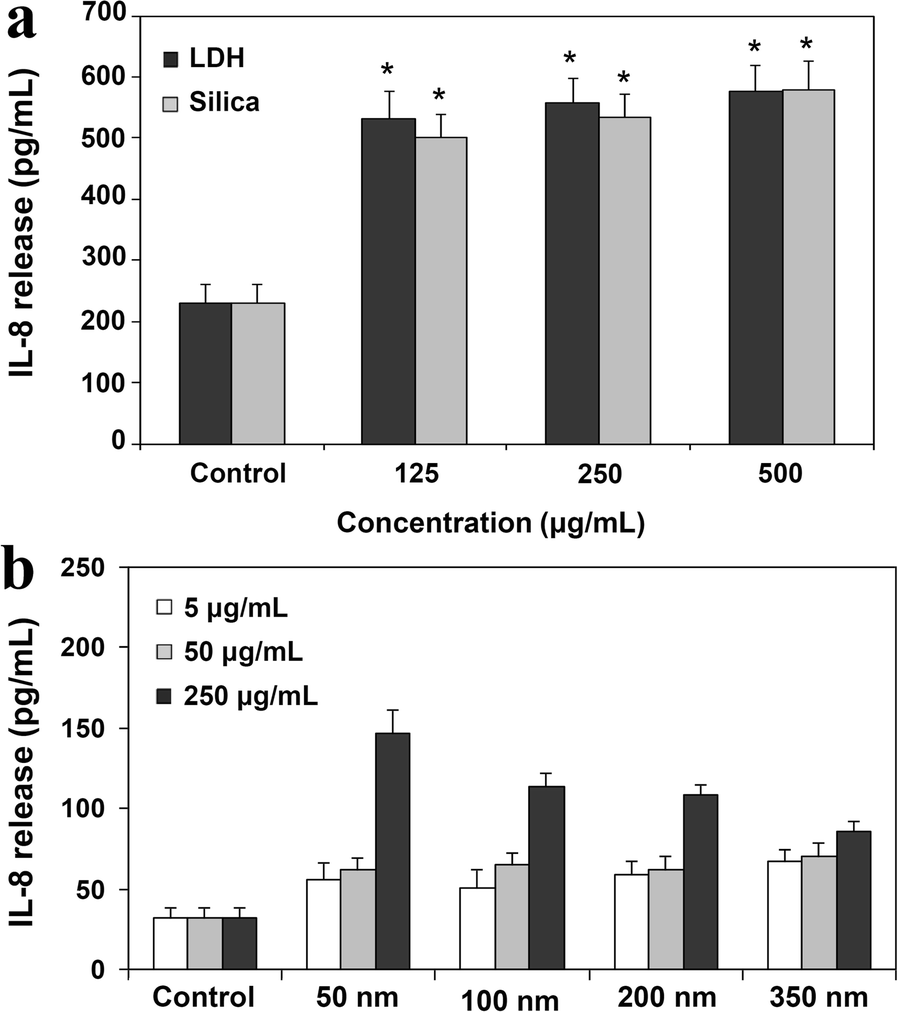
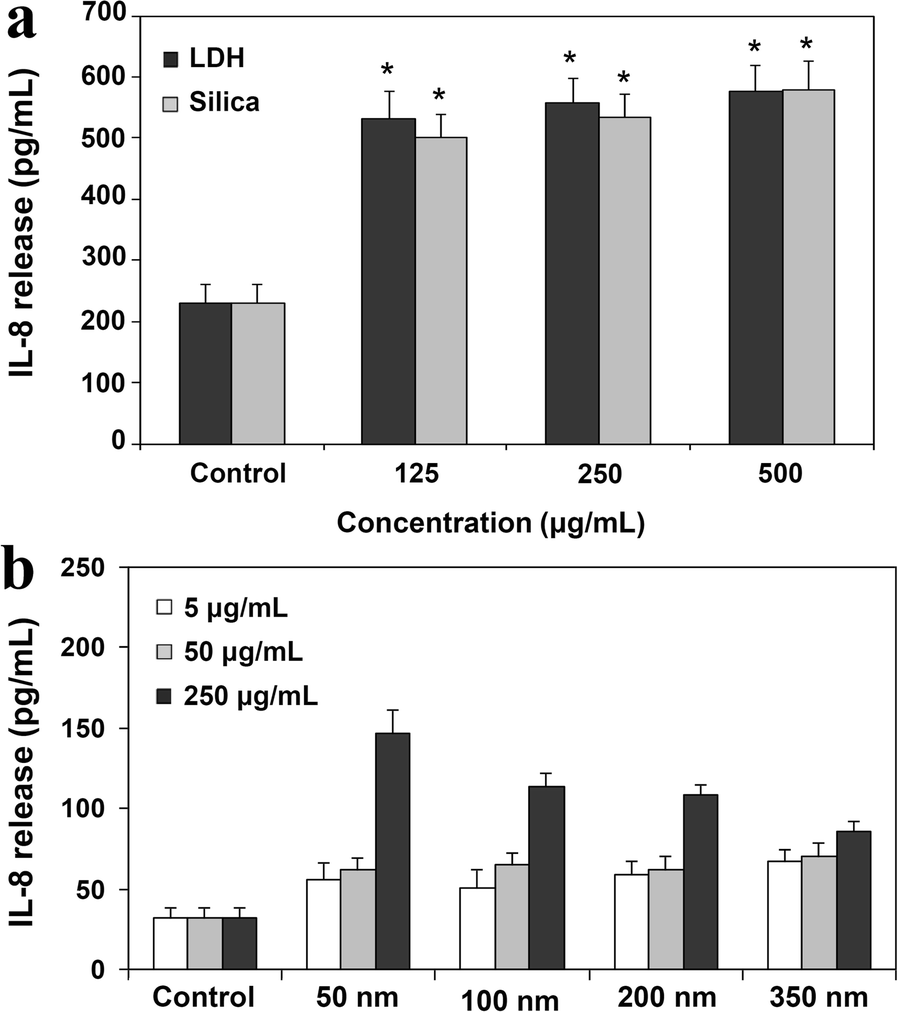
LDH-NPs (200 nm) were determined to induce a pro-inflammatory cytokine, IL-8, from A549 cells at concentrations > 125 μg/mL in a time-dependent manner (Fig. 5a) (Choi et al., Reference Choi, Oh and Choy2009). The highest level of IL-8 was induced by 50 nm particles, compared to 100, 200, and 350-nm particles (Fig. 5b), indicating the inflammation potential caused by LDH-NPs (Choi et al., Reference Choi, Oh and Choy2008b). On the other hand, of LDH-NPs (100 nm)-induced pro-inflammatory cytokines, only IL-6 and IL-8, but not IL-1 and TNF-α, resulted from oxidative stress (Choi et al., Reference Choi, Paek and Yu2015). Silica and carbon nanotubes were also reported to have induced an inflammation response (Chan et al., Reference Chan, Tsui, Law, So, Leung, Sham, Tsui and Chan2018; Poulsen et al., Reference Poulsen, Jackson, Kling, Knudsen, Skaug, Kyjovska, Thomsen, Clausen, Atluri, Berthing, Bengtson, Wolff, Jensen, Wallin and Vogel2016).
Pro-inflammatory mediator, IL-8, release from A549 cells (a) treated with LDH or silica NPs for 72 h or (b) treated with different-sized LDH-NPs for 48 h. * denotes significant difference from the untreated control (p < 0.05). Reproduced, in part, from Choi et al. (Reference Choi, Oh and Choy2008b, Reference Choi, Oh and Choy2009) with the permission of American Scientific Publisher and Elsevier, respectively
Cellular Trafficking of Clay Minerals
Most NPs are now well known to be taken up by cells via an energy-dependent endocytic pathway, such as clathrin-mediated endocytosis (Oh et al., Reference Oh, Choi, Kim and Choy2006, Reference Oh, Choi, Lee, Kim and Choy2009). Understanding the fate and trafficking pathway of NPs after internalization into cells is important for predicting their potential toxicity and delivery efficiency. Transport of NPs from plasma membrane to endocytic organelles, such as endosomes, lysosome, the Golgi apparatus, the endoplasmic reticulum (ER), and nucleus can be evaluated using immunofluorescence assay, followed by quantification using confocal microscopy. Conjugation of NPs to a fluorescent dye, such as fluorescein 5′-isothiocyanate (FITC), is also necessary to determine the colocalization of NPs with specific organelles. Here, endosome is an intracellular membrane-bound compartment, transporting molecules from plasma membrane to lysosomes or recycling back from the Golgi. Lysosome is a type of vesicle, which can degrade diverse biomolecules with the help of hydrolytic enzymes and low pH (4.5–5.0). The ER plays a role in protein folding and molecule transport to the Golgi. The Golgi apparatus is a collection, packaging, and modifying step of proteins received from the ER for secretion via exocytosis. The cell nucleus contains most of the genetic materials, controlling gene expression.
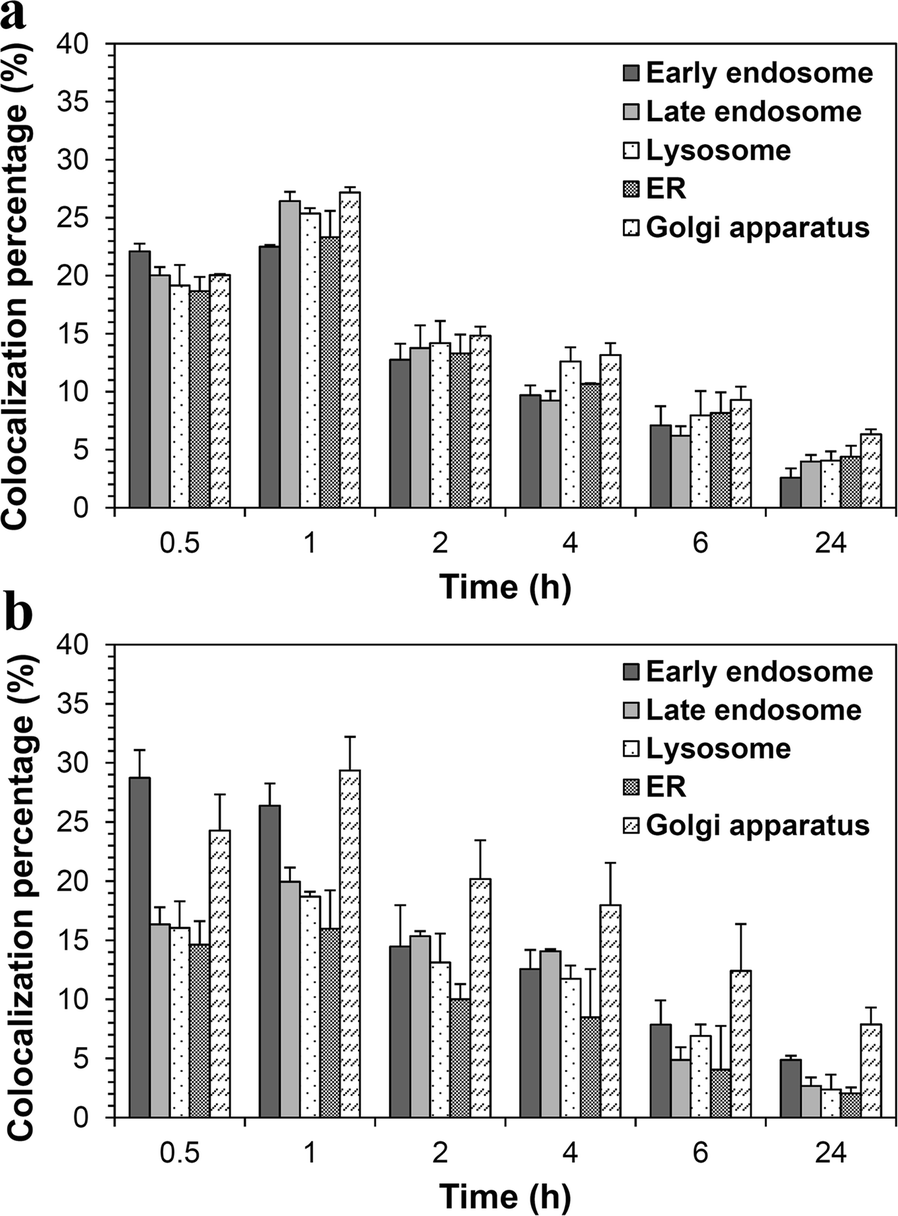
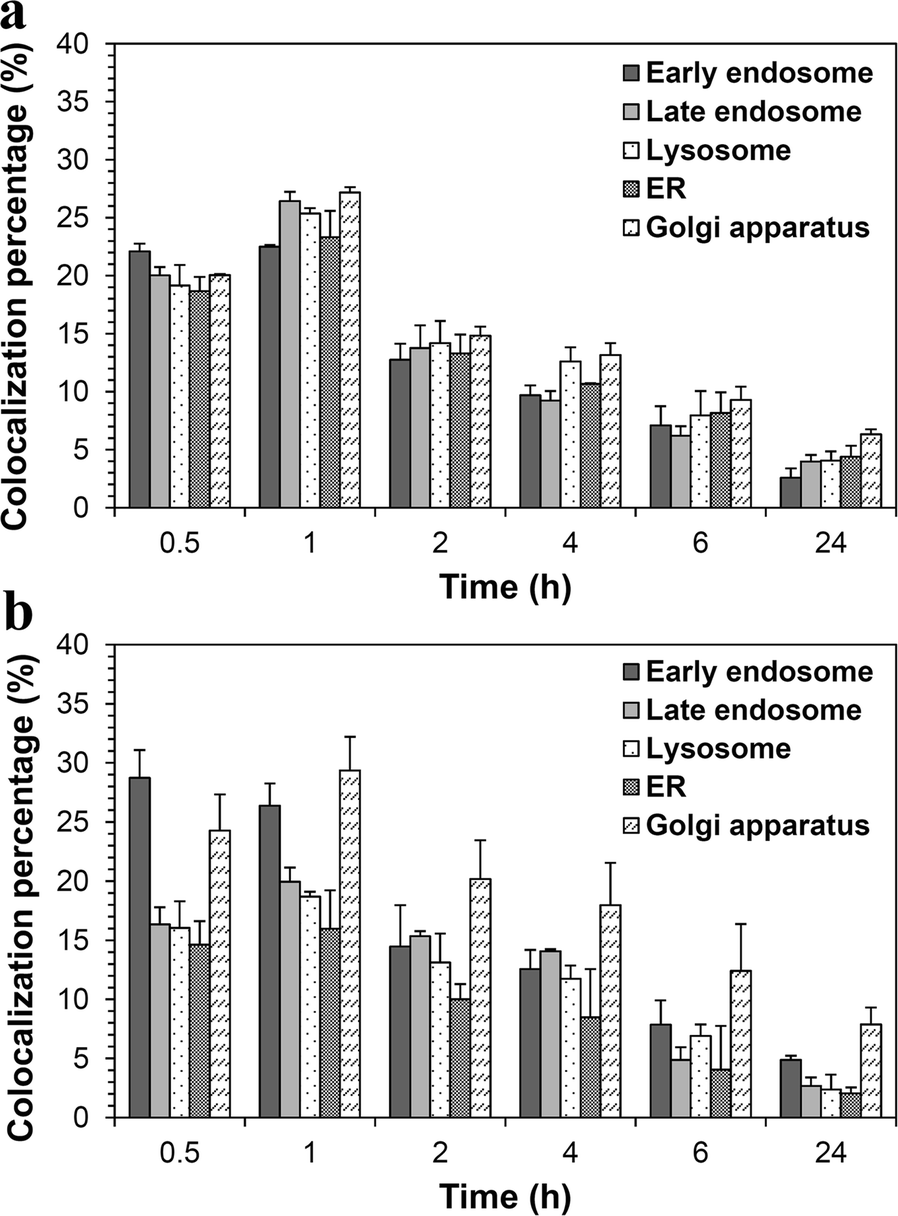
The intracellular fate of LDH-NPs-FITC of two different sizes (50 and 100 nm) was investigated, showing different trafficking pathways depending on particle size (Fig. 6) (Chung et al. Reference Chung, Park, Choy and Choi2012). Smaller particles, 50 nm, follow both a typical early endosome-late endosome-lysosome endocytic pathway and an exocytic pathway represented by early endosome-the Golgi-the ER-the Golgi (Fig. 6a). Whereas, 100 nm particles escape a typical endo-lysosomal degradation and are found massively in the exocytic organelles, including the ER and the Golgi complex (Fig. 6b). Hence, 100 nm LDH-NPs can be effective delivery carriers for genes, which are easy to break down in lysosome. Both differently sized LDH-NPs were localized in early endosome as soon as 0.5 h post-treatment and were retained inside the cells for more than 24 h. In any case, LDH-NPs were not found in nuclei, implying they have low genotoxicity potential.
Quantitative analysis of 50 nm (a) and 100 nm (b) LDH colocalization with intracellular organelles. Reproduced, in part, from Chung et al. (Reference Chung, Park, Choy and Choi2012) with the permission of Elsevier
Biokinetics of Clay Minerals
Absorption
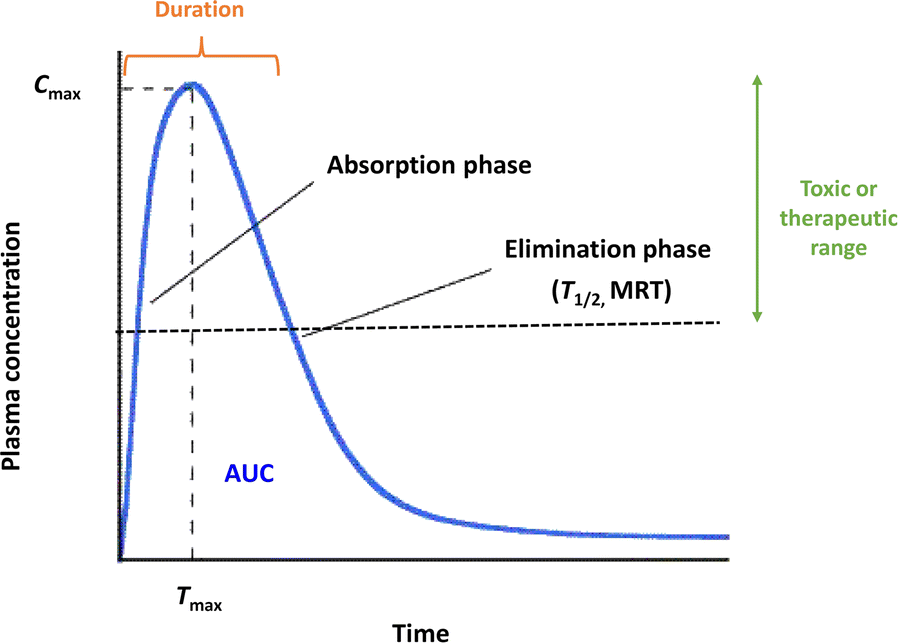
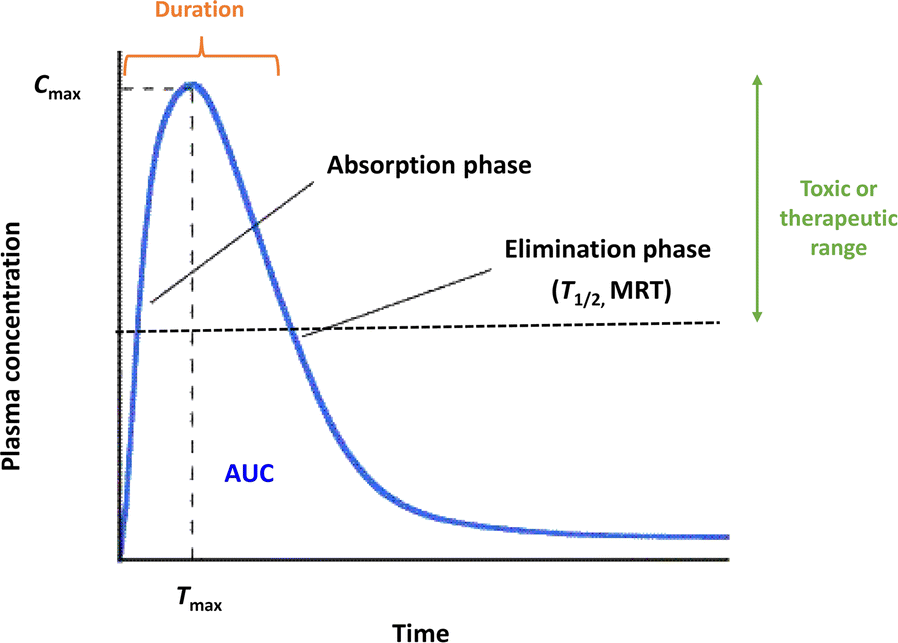
Biokinetics is a term similar to pharmacokinetics for drugs or toxicokinetics for toxic materials, but it is used for materials the physiological activity of which has not been determined. Biokinetic study is a branch of pharmacology and the quantification of the time line of biomolecules in the body during the process of absorption, distribution, metabolism, and excretion or clearance. In other words, biokinetics is a reflection of how the body treats biomolecules, as indicated by the plasma concentration-time curves after administration. Biokinetic parameters can be obtained from the plasma concentration vs. time profiles (Fig. 7). For example, the area under the concentration-time curve (AUC) represents the total amount of a molecule that reaches the circulation system in a given time, representing absorption or bioavailability. Other parameters, such as maximum concentration (C max), time for maximum concentration (T max), half-life (T 1/2), and mean residence time (MRT) can be obtained, which are used to predict the absorption or elimination phases. On the other hand, absorption (%) can be calculated from the AUC value divided by total administered dose.
Typical plasma concentration-time profile and biokinetic parameters of molecules following oral administration
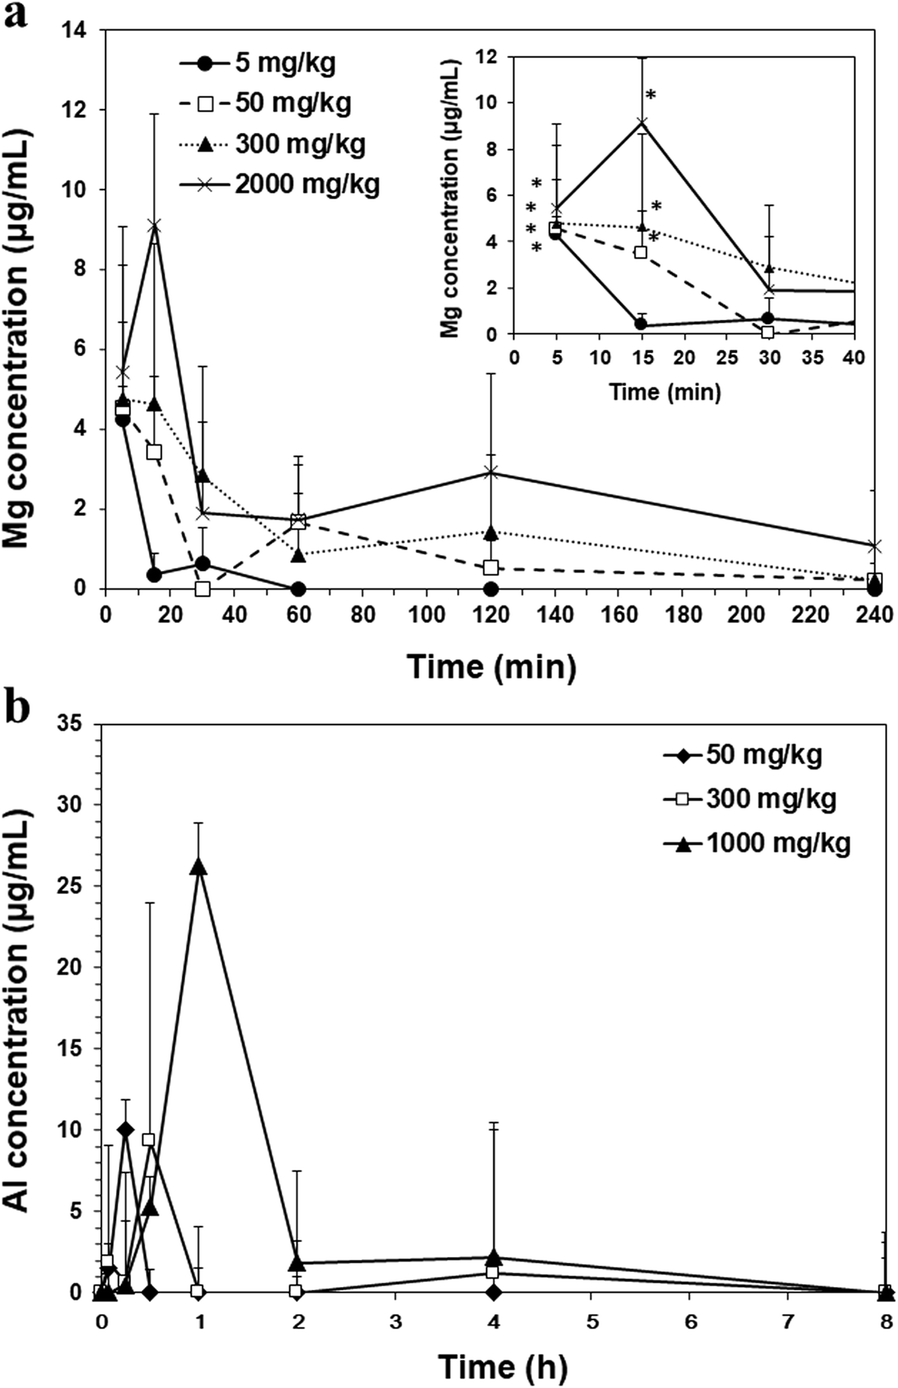
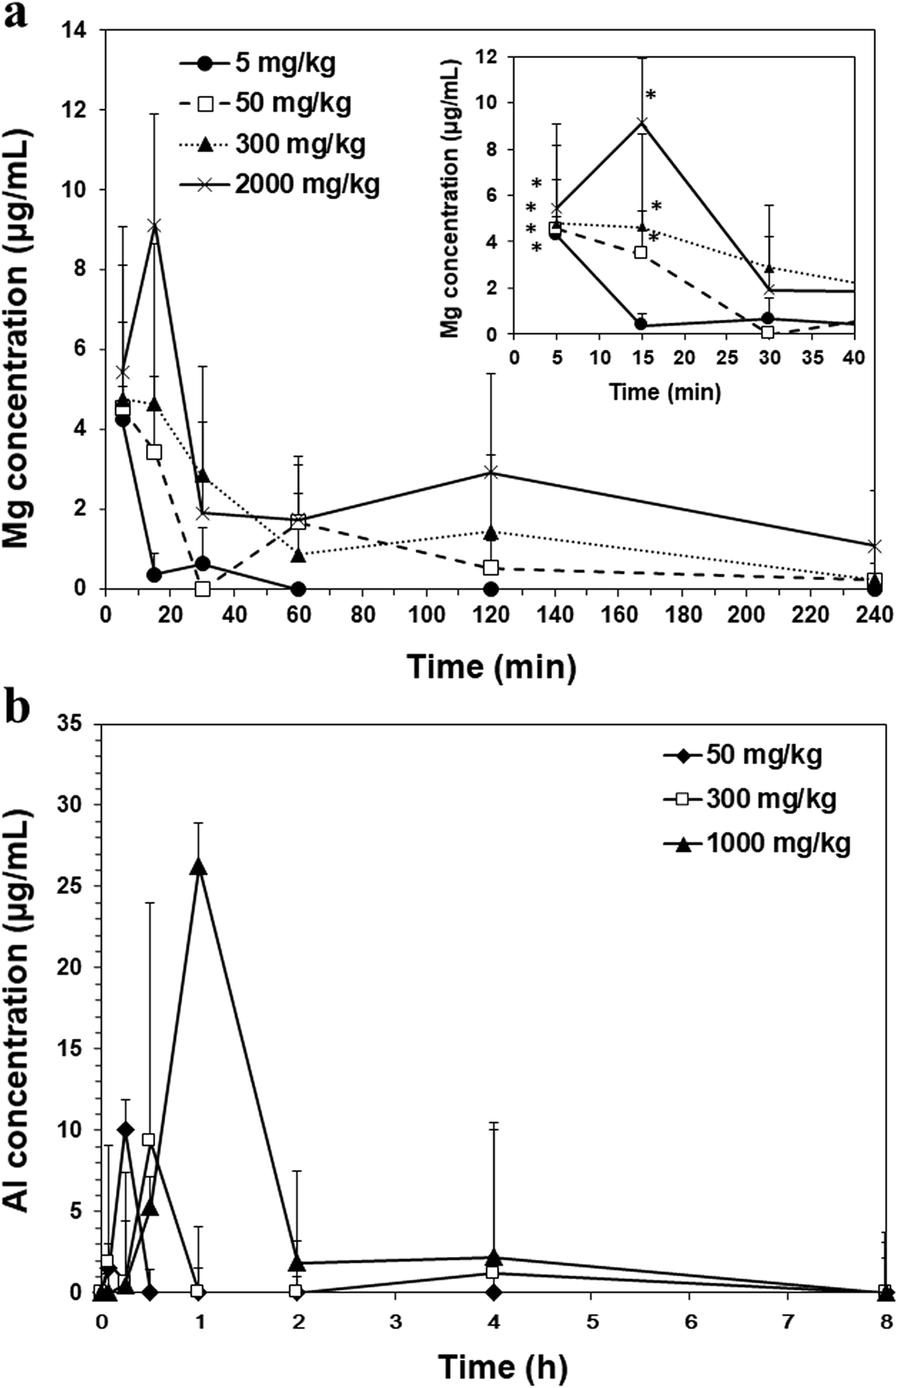
The biokinetics of LDH-NPs (100 nm) was evaluated after single-dose oral administration (5, 50, 300, and 2000 mg/kg) to mice (Fig. 8a) (Yu et al., Reference Yu, Chung and Choi2013). At least two different doses are generally recommended if biokinetic behaviors are not well determined. The plasma concentration-time curves of LDH-NPs show that NPs rapidly entered the bloodstream even at the highest dose of 2000 mg/kg and were not retained in the systemic circulation for a long time (Fig. 8a), as indicated by small T max, T 1/2, and MRT values (Table 1). Oral absorption of LDH-NPs was found to be extremely small, showing 2.85, 1.37, 0.40, and 0.14% for 5, 50, 300, and 2000 mg/kg, respectively. This result suggests that a small amount of orally administered LDH-NPs can be absorbed and eliminated from the body within 4 h, implying their low toxicity potential.
Plasma concentration vs. time curves for LDH-NPs (a) and MMT (b) after single-dose oral administration to mice. * denotes significant difference from the untreated control (p < 0.05). Reproduced, in part, from Baek et al. (Reference Baek, Lee and Choi2011) and Yu et al. (Reference Yu, Chung and Choi2013) with the permission of Springer Nature and Hindawi, respectively
Biokinetic parameters of different doses of LDH-NPs after single-dose oral administration to mice

Abbreviation: C max, maximum concentration; T max, time to maximum concentration; AUC, area under the plasma concentration-time curve; T 1/2, half-life; MRT, mean residence time. Includes data from Yu et al. (Reference Yu, Chung and Choi2013) which are reproduced with the permission of Hindawi
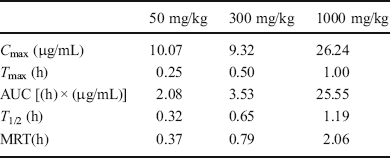
On the other hand, when a biokinetic study of MMT (50, 300, and 1000 mg/kg) was performed following single-dose oral administration to mice, similar plasma concentration-time profiles to those for LDH-NPs were obtained (Fig. 8b) (Baek et al., Reference Baek, Lee and Choi2012b). The peak concentrations of 50, 300, and 1000 mg/kg MMT reached at 0.25, 0.5, and 1 h post-oral administration and were retained in the body for 0.37, 0.79, and 2.06 h, respectively, as indicated by T max and MRT values (Table 2). Exact oral absorption could not be calculated, because the uncertainty of the molecular weight of the MMT formula (Na0.33Al2Si4O10(OH)2∙nH2O) used.
Biokinetic parameters of MMT after single-dose oral administration to mice
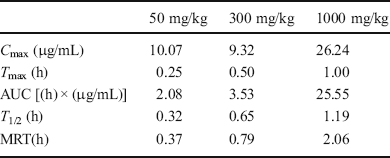
Abbreviation: C max, maximum concentration; T max, time to maximum concentration; AUC, area under the plasma concentration-time curve; T 1/2, half-life; MRT, mean residence time. Includes data from Baek et al. (Reference Baek, Lee and Choi2012b) which are reproduced with the permission of Springer Nature
Relatively little information about biokinetics or toxicokinetics of NPs is available. Oral absorption of ZnO-NPs of two different sizes (20 and 70 nm) was 10–30% depending on the dose administered (50, 300, and 2000 mg/kg), particle size (20 and 70 nm), and surface charge modification (positive and negative) (Baek et al., Reference Baek, Lee and Choi2012c; Choi & Choy, Reference Choi and Choy2014; Paek et al., Reference Paek, Lee, Chung, Yoo, Lee, Kim, Lee, Jeong and Choi2013). A total of 6–12% of colloidal silica NPs entered the bloodstream following oral administration to rats, depending on dose (500, 1000, and 2000 mg/kg) and particle size (20 and 100 nm) (Paek et al., Reference Paek, Chung, Lee, Kim, Lee, Kim, Kim, Maeng, Lee, Jeong and Choi2014). Although extremely small oral absorption (0.01–0.78% depending on dispersants used) of titanium dioxide (TiO2) was reported recently (Jo et al., Reference Jo, Yu, Kim, Song, Kim, Oh and Choi2016; Kim et al., Reference Kim, Lee, Jo and Choi2016), clearly the absorption of LDH-NPs is low compared to other inorganic NPs.
Tissue Distribution
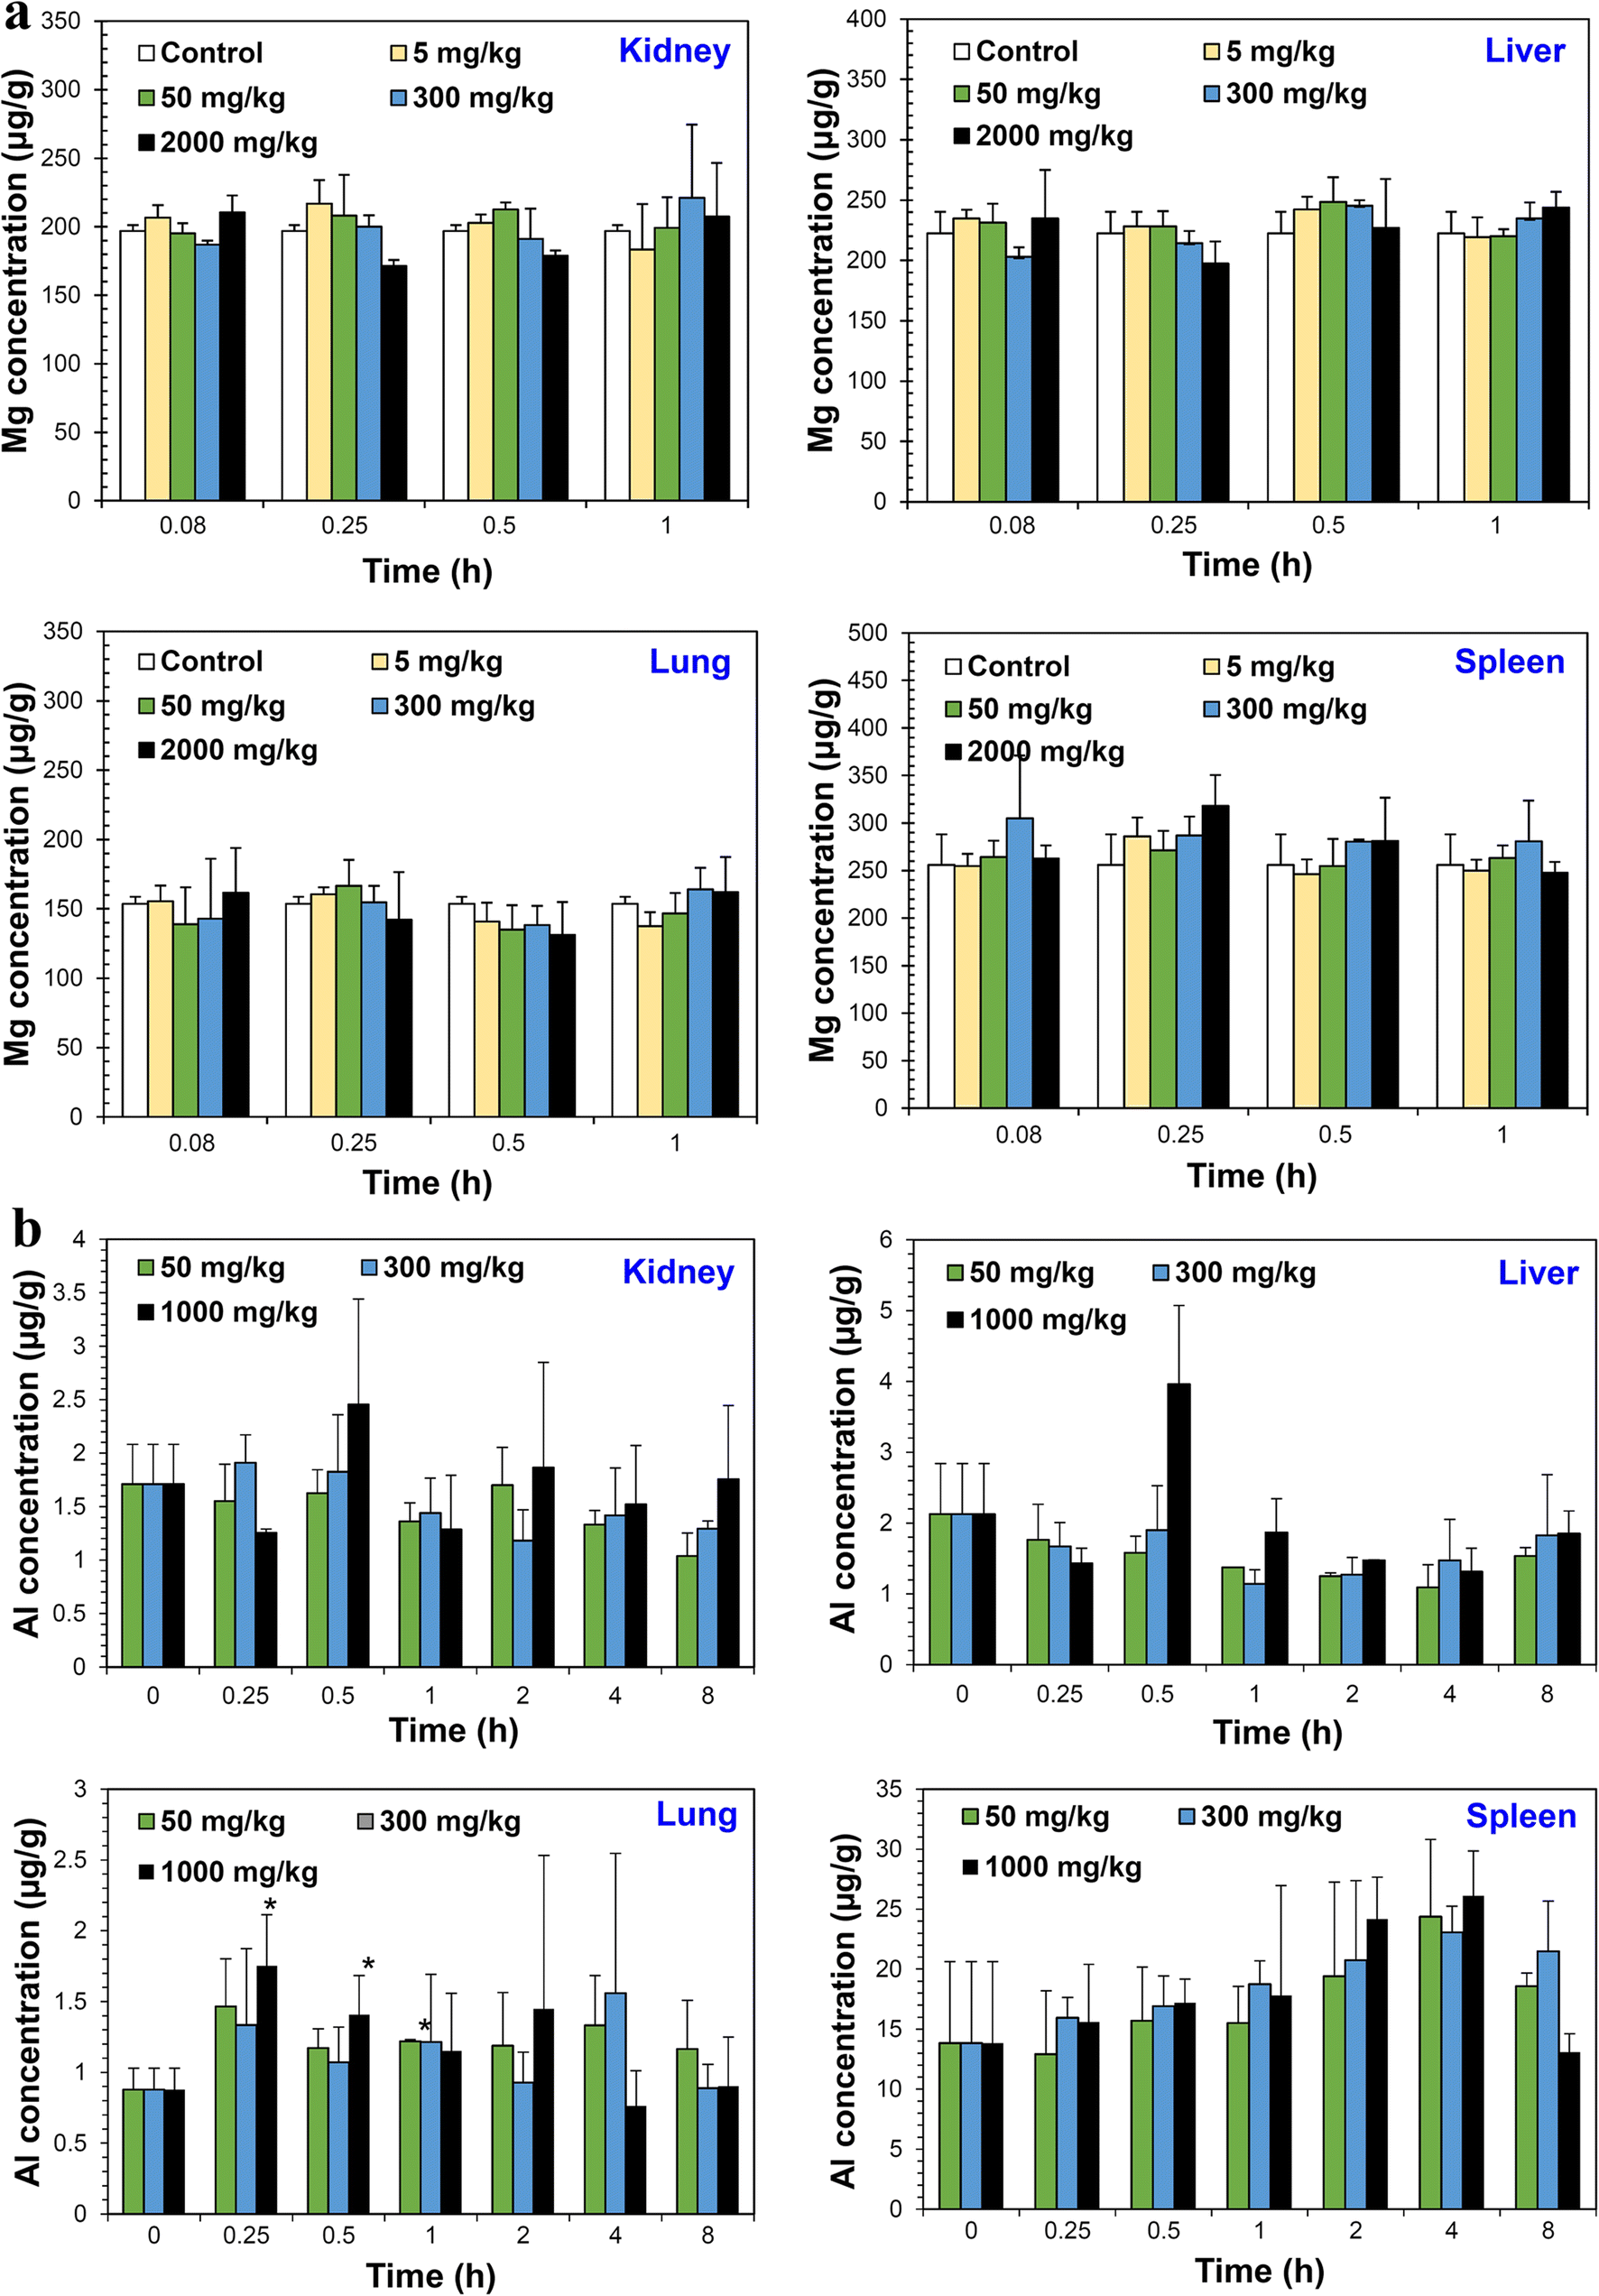
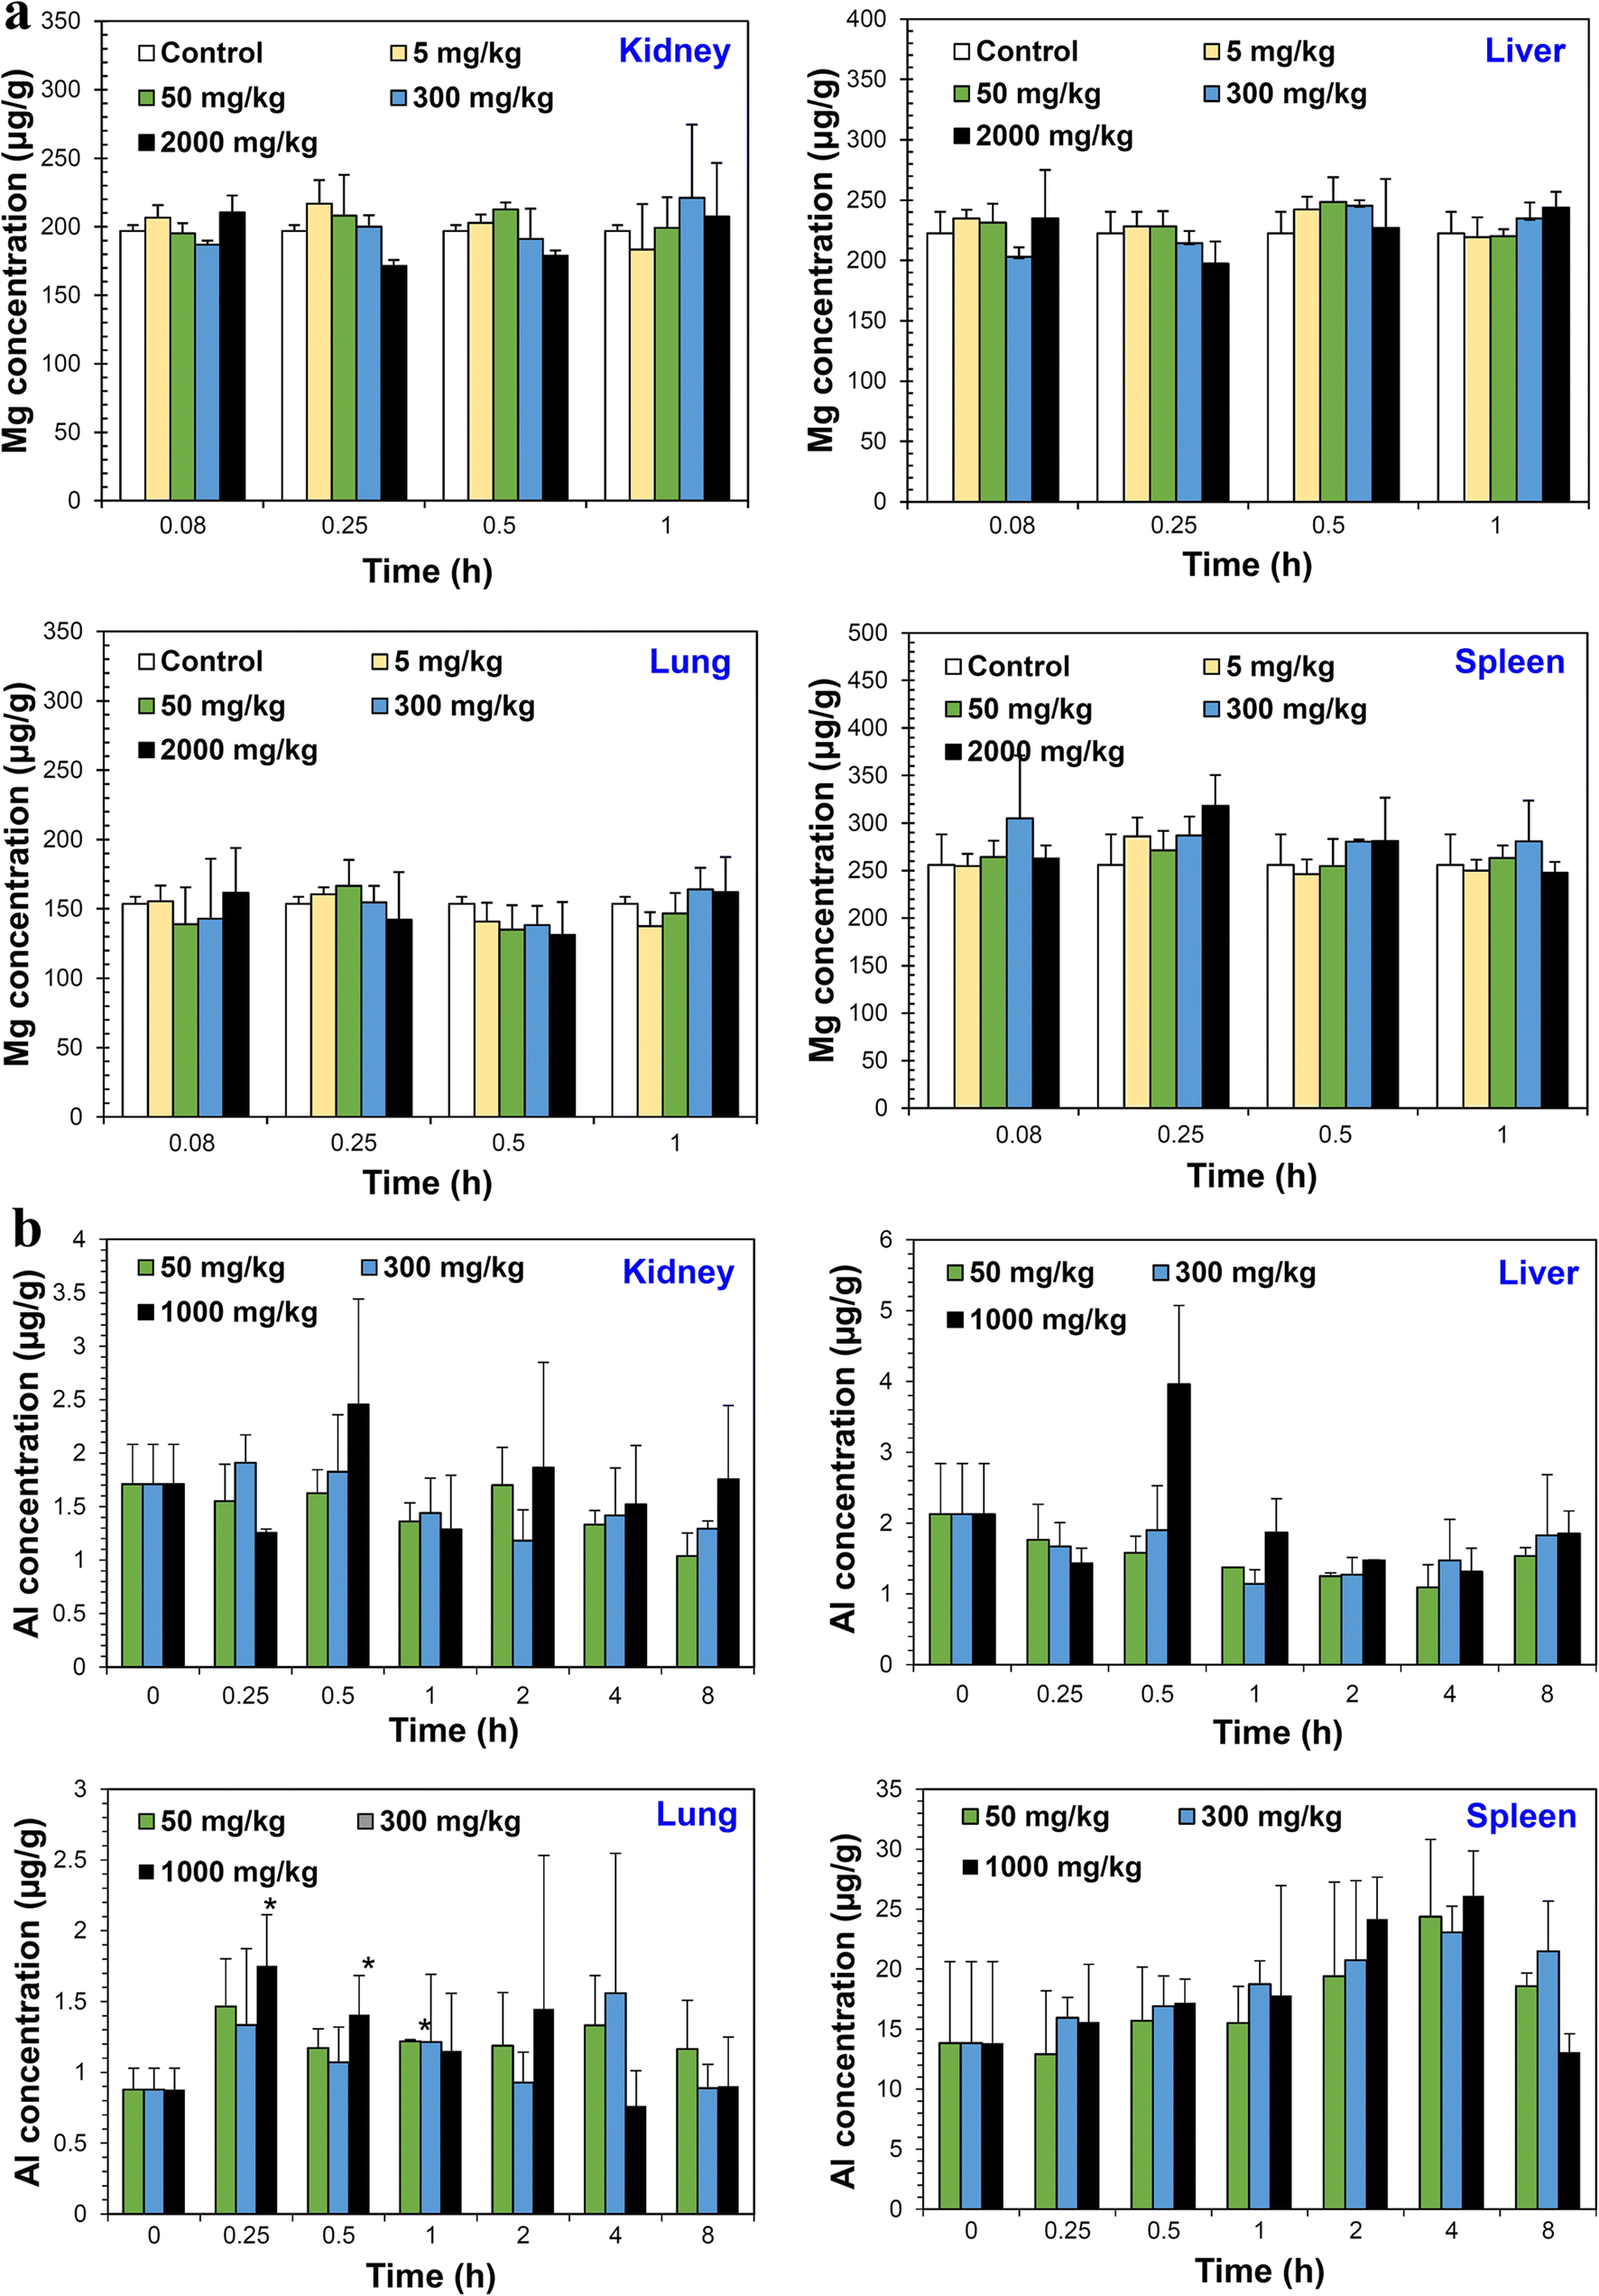
Tissue distribution kinetics can be investigated after single-dose oral administration and sampling of organs, such as kidneys, liver, lungs, and spleen at several time points. Figure 9a shows that LDH-NPs (100 nm) did not accumulate in any specific organ, even at the highest dose of 2000 mg/kg (Yu et al., Reference Yu, Chung and Choi2013). Significantly increased MMT levels were not found in kidneys, liver, or spleen, but were found in the in the lungs at 0.25–1 h post-oral administration (Baek et al., Reference Baek, Lee and Choi2012b). Taken together, orally administered LDH-NPs and MMT did not accumulate in the body, suggesting their low toxicity.
Tissue distribution kinetics of LDH-NPs (a) and MMT (b) after single-dose oral administration to mice. * denotes significant difference from the untreated control (p < 0.05). Reproduced, in part, from Baek et al. (Reference Baek, Lee and Choi2012b) and Yu et al. (Reference Yu, Chung and Choi2013) with the permission of Springer Nature and Hindawi, respectively
Also worth noting here is that quantitative analysis of LDH or MMT in plasma or organ samples was performed by measuring total Mg or Al levels using inductively coupled plasma-optical emission spectroscopy (ICP-OES). Optimization of the pre-treatment method is necessary for complete digestion of organic materials with nitric acid, hydrogen peroxide, or other solvents. Moreover, because basal mineral levels can be detected in plasma or organ samples, the data should be presented as increases in Mg or Al levels in treated groups by subtracting basal Mg or Al levels in untreated controls after statistical analysis.
Excretion
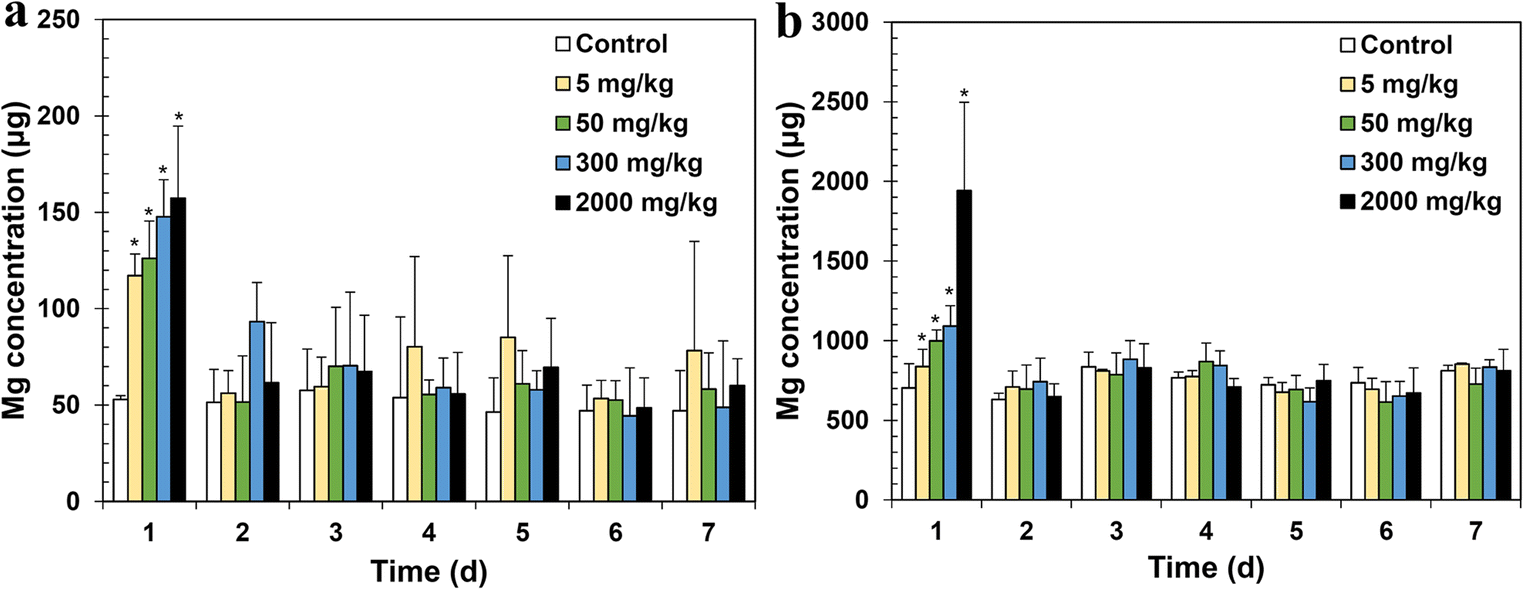
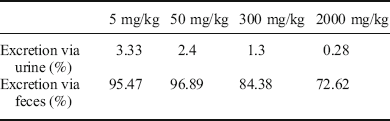
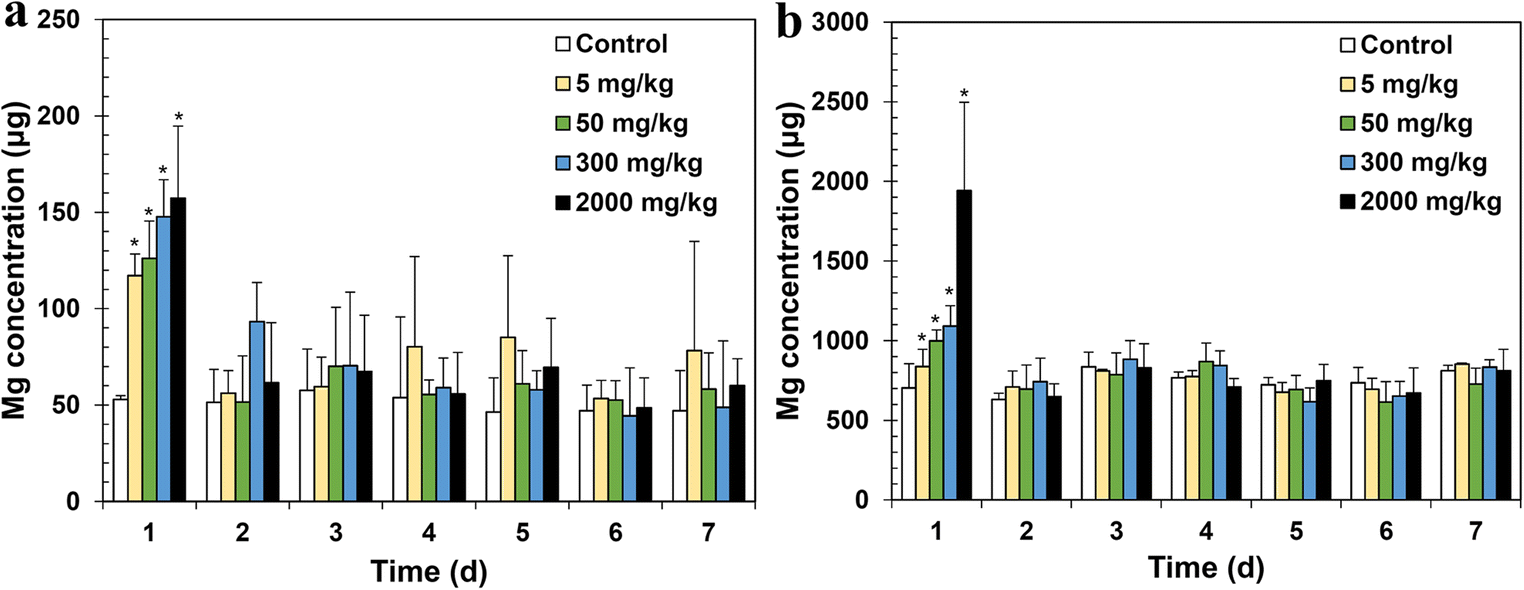
Excretion kinetics can be evaluated using metabolic cages that enable urine and feces to be collected at several time points after single-dose administration (Yu et al., Reference Yu, Chung and Choi2013). Figure 10 demonstrates that LDH-NPs (100 nm) were excreted from the body within 24 h via both urine and feces. When excretion amounts were calculated (Table 3), extremely small amounts of LDH-NPs were eliminated by urinary excretion, while most NPs were not absorbed, but excreted directly from the body via the fecal or biliary routes. Note that absorption amounts of LDH-NPs were very consistent with excretion amounts via urine. Orally absorbed LDH-NPs are very likely to be metabolized in organs and excreted via urine.
Excretion kinetics of LDH-NPs via urine (a) and feces (b) after single-dose oral administration to mice. * denotes significant difference from the untreated control. Reproduced, in part, from Yu et al. (Reference Yu, Chung and Choi2013) with the permission of Hindawi
Amount of LDH-NPs excreted via urine and feces after single-dose oral administration to mice
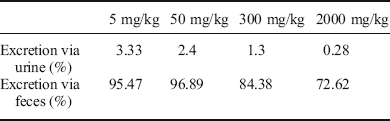
Includes data from Yu et al. (Reference Yu, Chung and Choi2013) which are reproduced with the permission of Hindawi
Acknowledgments
This work was supported by the National Research Foundation of Korea (NRF) grant funded by the Korea government (MSIT) (No. 2018R1A2B6001238).