


Introduction
The material properties of dense-flow avalanches, of snow, ice or rocks, are described by a simple Mohr-Coulomb criterion (Reference Savage and HutterSavage and Hutter, 1989,Reference Savage and Hutter1991). This provides sufficient information to determine the limiting normal pressures within the flowing avalanche but provides no information about the transition between these limiting states or which limiting state is associated with a given deformation. In this paper, a regularization process is introduced which provides smooth well-defined transitions between the various states.
Governing Equations
In the extended Savage-Hutter theory for granular free-surface flows over complex topography (e.g. Gray, in press), a slope-fitted curvilinear coordinate system Oxyz is generated by a reference surface that follows the “mean” down-slope chute topography. The x and y axes are oriented in the down-slope and cross-slope directions to the reference surface and the z axis is normal to it. The complex shallow three-dimensional chute topography over which the avalanche flows is then defined by its elevation z = b(x, y) above the reference surface.
To leading order, the depth-integrated mass balance reduces to

where h is the avalanche thickness, u and v are the depth-averaged velocity components in the down-slope and cross-slope directions and the total derivative  . The leading-order depth-integrated momentum balance components are

where g is the gravitational acceleration, ζ is the local slope-inclination angle, Kx and Ky are the down- and cross-slope earth-pressure coefficients and ∂b/∂x and ∂b/∂y are the basal-topography gradients. The gravity-acceleration and basal-drag terms are combined into net driving forces

in down- and cross-slope directions, respectively, where ∣u∣ = (u 2 + v 2)½ is the modulus of the velocity components, δ is the basal Coulomb dry-friction angle and K is the local curvature of the reference surface.
The earth-pressure coefficients Kx and Ky relate the limiting in-plane stresses to the normal stress within the avalanche. For avalanches whose motion is predominantly in the down-slope direction, Reference Hutter, Siegel, Savage and NohguchiHutter and others (1993) showed that


where ø is the internal angle of friction in the Mohr-Coulomb criterion. The subscripts act and pas denote active- and passive-stress states, respectively. Reference Greve, Koch and HutterGreve and others (1994) introduced the following ad hoc definitions to decide which of the stress states should be associated with a given deformation


Active-stress states are associated with a dilation of the material, whilst passive-stress states are associated with a compression. In Figure 1, the down- and cross-slope carth-prcssure coefficients are plotted as functions of the interna] angle of friction.
The down-slope (top panel) and cross-slope (bottom panel) earth-pressure coefficients are plotted as a function of the internal angle of friction ø. The various active and passive states are indicated by differing line styles. Note, that neither Kx nor Ky are defined for ø < δ = 30°

Regularization of the Theory
The earth-pressure coefficients jump from active to passive stales when either ∂u/∂x = 0 or ∂v/∂y = 0. It follows that there is a jump in the in-plane stress between convergent and divergent regions and that there must also be a corresponding jump in the avalanche velocity, and/or the thickness, in order to balance the tractions on either side of the interface. Such transitions where the variables jump are called singular surfaces (e.g. Reference ChadwickChadwick, 1976).
A proper integration of the Savage-Hutter theory requires the solution of jump conditions on multiple non-material moving boundaries between evolving regions of convergent and divergent motion. This is a truly formidable task. An alternative approach is to regularize the theory by introducing a smooth transition between the various limiting stress states. This is illustrated schematically in Figure 2 for the down-slope earth-pressure coefficient. For large down-slope convergence Kx approaches Kxpas and for large down-slope divergence Kx approaches Kxact . Between these two limiting states there is a smooth monotonically decreasing transition, which crosses the ∂u/∂x = 0 line at Kx = Kx0 .
The down-slope earth pressure is regularized by introducing a smoothly varying monotonically decreasing function of the down-slope divergence ∂u/∂x, which approaches the limiting values, Kxact and Kxpas ,for large divergence and convergence, respectively. At ∂u/∂x = 0 the down-slope earth pressure equals Kx0 .

To formalize the regularization of the Savage-Hutter model, new down- and cross-slope earth-pressure coefficients are introduced

where the functions F and G are now dependent on the down- and cross-slope velocity gradients ux = ∂u/∂x and vy = ∂v/∂y, respectively. The nature of these functions is somewhat subjective. For the purposes of this paper F and G are assumed to be the monotonically decreasing functions

where the parameter α determines the steepness of the transition. The constants ux0
and vy0
are chosen so that at the origin  , which implies that

where

The values at the origin are an important feature of the regularized Savage-Hutter model. A natural partitioning of the active- and passive-stress states is achieved when the down- and cross-slope earth-pressure coefficients cross the origin at

since  for all values of the internal and basal friction angles. In general, other models are possible and three situations are considered here

where ε is a small parameter that is introduced to ensure that the transition occurs close to the origin. The lirst of these models shall be referred to the naturally regularized model, the second as the active model and the third as the passive model.
Numerical Considerations
It is appropriate at this point to discuss briefly some of the finer points involved in a numerical algorithm to solve the two-dimensional regularized Savage-Hutter theory. In many respects, the algorithm adopted here is similar to that used in existing Lagrangian schemes to solve the standard Savage-Hutter model (e.g. Reference Koch, Greve and HutterKoch and others, 1994). The important difference arises in the way in which the earth-pressure coefficients at a gridpoint are calculated from the velocity gradients at a given time-step.
In existing schemes, the velocity gradients are computed for a triangular gridcell and the appropriate earth-pressure values for that gridcell are determined from relations (6) and (7). Once this has been performed for all gridcells the earth-pressure coefficients at a gridpoint are determined by volumetric gridcell averages


where the summations are performed over the set of adjacent gridcells to the point and V cell is the volume of the grid-cell. At gridpoints that lie close to singular surfaces, this scheme has the property that the volumetric mean earth pressure lies between the active and passive values. It follows that the earth-pressure coefficients are implicitly smoothed by the algorithm.
In the algorithm proposed here, the order of the operations is interchanged. First the velocity gradients (ux )point, and (vy )point are calculated by a volumetric average of ux )cell, and (vy )cell at adjacent gridcells and then the earth-pressure coefficients Kx )point, and (Ky )point are calculated directly. It follows that there is no implicit smoothing of the earth-pressure coefficients near a singular surface and this method is therefore appropriate for the regularized model.
Experimental Comparison
To test the regularized Savage-Hutter theory and the new numerical method, a comparison of the results is made with a carefully cont rolled laboratory experiment, which has already been successfully modelled using the standard method (Reference Gray and FleckGray, 1997).
The chute geometry consists of a channel, inclined at ζ = 40° to the horizontal, which is connected to a horizontal plane run-out zone by a smooth transition. This is illustrated in Figure 3. The channel profde is parabolic with a radius of curvature of 110 cm and the avalanche is released from a cap that has a spherical free surface and which is fitted to the basal chute topography. The cap radius is 32 cm and the maximum height of the cap above the free surface is 22 cm.
The basal-chute geometry consists of an the inclined section (white) with shallow parabolic cross-slope profile, which opens out on to a horizontal plane (dark grey). A smooth transition region (light grey) connects the two zones.

The experimental data in this paper are taken from experiment V02 (e.g. Reference Gray and FleckGray, 1997), which used quartz granules (mean diameter 2–4 mm) that are characterized by an internal angle of friction ø = 40° and a basal angle of friction δ = 27–30°. In numerical results presented in this paper, δ is assumed to equal 28° at the front of the avalanche and linear bed-friction angle reduction (Reference Gray and FleckGray, 1997) is used to obtain the correct tail speed.
The predicted avalanche thickness and a comparison with the experimental avalanche boundary is shown at a sequence of time-steps in Figure 4. The avalanche moves down-slope from left to right, starting on the inclined channel in the top panel and coming to rest on the flat run-out plane in the bottom panel. Initially, there is a strong cross-and down-slope expansion of the avalanche as the cap is raised but the cross-slope spreading is rapidly balanced by the cross-slope topography gradients in the channel and spreading continues predominantly in the down-slope direction. As the avalanche enters on to the run-out plane, the lateral confinement ceases and the avalanche develops a characteristic tadpole form at t = 1.51 s, before coming to rest at t = 1.79 s. At each time-step, the predicted and observed boundaries are in very good agreement, confirming that the regularized Savage-Hutter theory is at least as good if not better than the standard model.
Avalanche-thickness contours computed using the regularized Savage-Hutter model are plotted using slope fitted curvilinear coordinates at a sequence of time-steps and the thick line shows the position of the experimental avalanche boundary. The time is shown in seconds in each plot and all sizes are in centimetres. The solid lines at x = 175 and 215 cm indicate the position of the transition zone and the y = 0 cm line corresponds to the centre of the channel. The avalanche moves down-slope from left to right.

In the laboratory experiment V02, a constriction or necking of the avalanche is observed in the transition zone at t = 1.21 S, as shown in Figure 5. That is, the maximum width of the avalanche is smaller in the transition zone than in either the channel section or run-out plane. The reason for this behaviour is due to the complex interplay between the chute geometry and material properties of the avalanche as it moves from the channelized to unconfined flow regimes.
Necking of the avalanche as observed in experiment V02.

The necking problem provides an interesting test case for both the theory and the numerical methods. Four cases are considered here. The first model is the standard Savage-Hutter theory using the original numerical method, the second is the naturally regularized Savage-Hutter theory and the third and fourth models illustrate what happens with the standard Savage-Hutter theory when the new numerical method is used. It should be noted that in the ad hoc earth-pressure coefficient definitions, Equation (6) and (7), the cases when eil her ux = 0 or vy = 0, are not defined. Two possibilities are to define

The first of these cases is asymptotically similar to the active regularized model for large α and small ε, and the second is asymptotically similar to the passive regularized model, both of which are defined in Equation (13). These models shall therefore be termed the active-jump and passive-jump models, respectively.
In Figure 6 the results of the standard, naturally regularised, active-jump and passive-jump models are illustrated, at time t = 1.21 s when necking in the transition zone is observed. There is no sign of a constriction in the transition zone with the standard Savage Hutter model (top panel) but the naturally regularized theory is able to reproduce this phenomenon (upper middle panel). This provides further evidence that the regularization of the earth-pressure coefficients is at least qualitatively correct.
A sequence of four avalanche-thickness contours are shown for the standard model (top), the naturally regularized model (upper middle), the active-jump model (lower middle) and the passive-jump model (bottom) at t = 1.21 s.

The standard Savage Hutter model results were produced using the active-jump model (Equation (16)) and the old numerical method. When the passive-jump model is used instead, the results are almost identical. However, when the new numerical mel hod is used, the results for the active-jump model lower middle panel; are completely dificrent to those obtained with the passive-jump model (bottom panel). Indeed, the results for the passive-jump case are similar to experiments performed on unconfined chutes (Reference Koch, Greve and HutterKoch and others, 1994), where there is no cross-slope curvature. The reason for this is that for a large part of the avalanche motion the cross-slope basal-topography gradients are almost in exact balance with the cross-slope spreading terms in Equation (2) and that the cross-slope velocity and velocity gradients are zero to double precision accuracy. As a result

where the superscript a and p are used to denote active-jump and passive-jump models, respectively. It follows from this that

implying that the horizontal thickness gradients in the active-jump model are larger than those in the passive-jump model, since 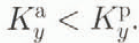 . The active-jump model therefore produces a much narrower avalanche than the passive-jump model in the channelized section of the chute. These results demonstrate the danger of using a jump function in numerical methods that implicitly assumes the existence of smooth differentiable solutions, as small changes to the nature of the jump can have a large effect on the solution.
Conclusions
The regularized Savage-Hutter theory provides a well-defined method of switching from one limiting stress state to another during the avalanche deformation and eliminates the jumps present in the original theory. A comparison of the model results with a carefully controlled laboratory experiment (V02) confirms the superiority of the method over previous schemes.
Acknowledgements
This research was supported by the DFG project SFB 298 “Deformation und Versagen bei metallischen und granularen Strukturen”.



