Introduction
Neuroangiostrongyliasis due to infection with Angiostrongylus cantonensis can be a serious and even fatal disease (Wang et al., Reference Wang, Lai, Zhu, Che and Lun2008, Reference Wang, Wu, Wei, Owen and Lun2012; Barratt et al., Reference Barratt, Chan, Sandaradura, Malik, Spielman, Lee, Marriott, Harkness, Ellis and Stark2016). Angiostrongylus cantonensis is a global parasite, and in the USA, a relatively high rate of infection in humans and other animals is documented in Hawai‘i (Alicata, Reference Alicata1964; Jarvi et al., Reference Jarvi, Quarta, Jacquier, Howe, Bicakci, Dasalla, Lovesy, Snook, McHugh and Niebuhr2017; Johnston et al., Reference Johnston, Dixon, Elm, Calimlim, Sciulli and Park2019; Niebuhr et al., Reference Niebuhr, Jarvi, Kaluna, Fischer, Deane, Leinbach and Siers2020). The parasite has also been reported in the US mainland, primarily in the southeastern states, with 12 human cases reported between 2011 and 2017 (Liu et al., Reference Liu, Schwarts, Hysmith, DeVinco, Larson, Maves, Palazzi, Meyer, Custido, Braza, Hammond, Rao, Qvarnstrom, Yabsley, Bradbury and Montgomery2018). It grows and reproduces in its definitive host, rats (Rattus spp.), and develops from L1 to L3 stage in its intermediate host, mollusks. It is the L3 stage that is infective to rats and accidental hosts including humans, dogs, horses, and other species.
Quantitative and real-time polymerase chain reaction (PCR) have been the primary method for detecting A. cantonensis DNA in gastropod tissue (Jarvi et al., Reference Jarvi, Farias, Howe, Jacquier, Hollingsworth and Pitt2012; Kim et al., Reference Kim, Hayes, Yeung and Cowie2014), in cerebrospinal fluid (CSF) samples from humans (Qvarnstrom et al., Reference Qvarnstrom, da Silva, Teem, Hollingsworth, Bishop, Graeff-Teixeira and da Silva2010, Reference Qvarnstrom, Xayavong, da Silva, Park, Whelen, Calimlim, Sciulli, Honda, Higa, Kitsutani, Chea, Heng, Johnson, Graeff-Texeira, Fos and da Silva2016), and in peripheral blood and other tissues from rats (Jarvi et al., Reference Jarvi, Pitt, Farias, Shiels, Severino, Howe, Jacquier, Shiels, Amano, Luiz, Maher, Allison, Holtquist and Scheibelhut2015, Reference Jarvi, Quarta, Jacquier, Howe, Bicakci, Dasalla, Lovesy, Snook, McHugh and Niebuhr2017). Quantitative PCR (qPCR) requires the use of specialized equipment, including a thermocycler, which provides the temperature changes necessary for DNA amplification to occur and is able to detect amplification in real-time. A thermocycler is an expensive piece of equipment that requires regular maintenance, 1–2 h to run, and trained professionals to operate and interpret results. The benefits of qPCR are more applicable to large scientific studies, where qPCR offers the ability for high throughput and automated systems to process many samples at once as well as the ability to quantify exact DNA concentrations of a sample. Field and clinical settings generally process few samples at a time and don't require quantitative analysis, thus, qPCR is not necessary and other available technology could offer options better suited for these non-laboratory environments.
Recombinase polymerase amplification (RPA) is an isothermal method for DNA amplification that uses either a fluorometer (RPA-EXO) or lateral flow test strip (RPA-LFA) for detection (Piepenburg et al., Reference Piepenburg, Williams, Stemple and Armes2006; Ghosh et al., Reference Ghosh, Kokane, Kokane, Warghane, Motghare, Bhose, Sharma and Reddy2018). The reaction is conducted at a constant temperature, with some studies recommending 37–42°C (Ghosh et al., Reference Ghosh, Kokane, Kokane, Warghane, Motghare, Bhose, Sharma and Reddy2018), but results can be achieved by using a heat block or even one's own body temperature (Crannell et al., Reference Crannell, Rohrman and Richards-Kortum2014). Results can be collected in 10–15 min, depending on the concentration of target DNA in the sample. RPA-EXO probes contain a tetrahydrofuran (THF) residue, a dT-fluorophore and a dT-quencher dye. When the probe attaches to the template, an exonuclease splits the fluorophore and quencher at the THF region, releasing fluorescence that is detected by a fluorometer (Piepenburg et al., Reference Piepenburg, Williams, Stemple and Armes2006). RPA-EXO does not use equipment such as a thermocycler, making it more adaptable to the field and smaller lab spaces with minimal equipment capacity. In addition, RPA-EXO can be semi-quantitative, where the approximate amount of A. cantonensis DNA can be inferred based on the amount of amplification observed, but the exact amount of DNA in a sample cannot be determined.
The recombinase polymerase amplification lateral flow assay (RPA-LFA) is an isothermal, DNA amplification method that does not require the use of a fluorometer or thermocycler. Lateral flow test strips are inexpensive to manufacture and are commonly used for patient diagnostics and screening for a wide range of disease-causing organisms, among many other applications (Koczula and Gallotta, Reference Koczula and Gallotta2016; Park et al., Reference Park, Oh, Jung, Choi, Seo, Kim, Lee and Seo2017). This method can be used to detect antigens, antibodies and products of DNA amplification. The two main categories of LFA's are lateral flow immunoassays and the nucleic acid LFA. LFA immunoassays have been developed for the detection of a 31 kDa specific antibody against A. cantonensis (Eamsobhana et al., Reference Eamsobhana, Prasartvit, Yong, Tungtrongchitr and Wanachiwanawin2019) and for the detection other excretory-secretory proteins of A. cantonensis (Chen et al., Reference Chen, Chen, Chen, Huang, Ai and Zhang2016). Nucleic acid-based LFA is used to detect the DNA amplification product of a recombinase polymerase reaction (RPA-LFA) (Ghosh et al., Reference Ghosh, Kokane, Kokane, Warghane, Motghare, Bhose, Sharma and Reddy2018). Instead of a fluorometer, a strip of absorbent membrane containing immobilized bands of anti-FAM antibodies captures DNA amplification products produced during isothermal DNA amplification. These bands are visualized by neutravidin-labelled carbon particles that bind specifically to a biotin-labelled nucleotide on the DNA amplification product. Additionally, RPA-LFA has the potential for partial quantitation if used in conjunction with an imaging system to document the intensity of the bands. This study describes the development of RPA-EXO and RPA-LFA assays for the detection of A. cantonensis in gastropod intermediate hosts, and compares the sensitivity and accuracy of these assays with a traditional qPCR assay using ITS1 gene plasmids and gastropod tissue.
Methods
Specimen collection and DNA extraction
Parmarion martensi (semi-slugs), Veronicella cubensis (Cuban slugs), Laevicaulis alte (tropical leatherleaf) and one Cornu aspersum (brown garden snail) were collected from east Hawai‘i Island in 2013–2014 from multiple sites in Hilo and the Puna district (n = 25), and additional semi-slugs were collected in 2017 on the University of Hawai‘i Hilo campus (n = 10). Slug weights were recorded and samples were stored frozen (−20°C/−80°C) until DNA was extracted. For slugs collected in 2013–2014, DNA extraction was completed as previously described (Jarvi et al., Reference Jarvi, Farias, Howe, Jacquier, Hollingsworth and Pitt2012) using a DNeasy Animal and Tissue Kit (Qiagen, Valencia, CA, USA) following the manufacturer's protocol. Dissection of tissues was completed using single-use sterile blades and tweezers decontaminated with bleach in between use. For the 2017 slug samples, excised slug tissue was placed into 180 μL of ATL buffer (Qiagen) containing six 3 mm Zirconium beads (OPS Diagnostics, Lebanon, NJ, USA) and homogenized (MP Biomedicals, Santa Ana, CA, USA) for 30 s at 6 m s−1, then for 40 s at 6.5 m s−1 followed by centrifugation at 8000 RPM for 3 min. Additional ATL buffer (180 μL) was added along with 40 μL of Proteinase K to each sample and incubated for 24 h at 55°C. Samples were transferred to a 1.5 mL microcentrifuge tube leaving behind the zirconium beads. Buffer AL (400 μL) was added, incubated at 70°C for 10 min, followed by the addition of 95% ETOH (400 μL). The remainder of the extraction procedure was then completed according to the manufacturer's protocols. DNA was eluted from the columns with two rounds of 200 μL of AE buffer each, resulting in DNA in a total of 400 μL buffer AE. The DNA concentration was measured for each sample (BioSpec-nano, Shimadzu Scientific Instruments, Columbia, MD, USA).
Quantitative PCR (qPCR)
All 35 genomic DNA samples were subject to qPCR to determine the presence and quantity of A. cantonensis DNA. All PCR reactions were run in triplicate as previously described (Jarvi et al., Reference Jarvi, Farias, Howe, Jacquier, Hollingsworth and Pitt2012; Howe et al., Reference Howe, Kaluna, Lozano, Fischer, Tagami, McHugh and Jarvi2019). Samples were determined to be positive if ⩾2 replicates within or between runs showed amplification with a cycle threshold standard deviation of ⩽1.0. Samples were considered equivocal if two or more replicates amplified with a standard deviation of ⩾1.0 or if a single replicate amplified and was not confirmed on repeat runs. Samples were considered negative if there was no amplification in any replicate.
Recombinant polymerase assay (RPA)
To design the primers and probes for both RPA-EXO and RPA-LFA development, published A. cantonensis sequences based on the ITS1 gene region were downloaded from GenBank (GU733321–23 and GU587750–62). Sequences were aligned, and the probe/primer sequence, placement and hairpin formation were evaluated using software Geneious 8.1.9 (Biomatters, Ltd., Auckland, New Zealand) following recommendations by the manufacturer for primer/probe design with the TwistAmp® exo kit (TwistDx, Cambridge, UK). The RPA-EXO assay was developed and tested first, and subsequently slightly modified for RPA-LFA (see below). Primers, described herein as cloning primers (27F and 815R), were also developed to amplify a 798 bp target region of ITS1 that spans each of the qPCR, RPA-EXO and RPA-LFA target regions. The cloning primers were subsequently used in comparative sensitivity tests using plasmid dilutions.
RPA-EXO development
An RPA-EXO probe and five forward and five reverse ITS1 primers with few or no hairpins were designed and synthesized (Integrated DNA Technologies, Coralville, IA; LGE BioSearch, Petaluma CA, USA). The performance of all combinations of each of the five forward and reverse primers (25 total) was evaluated using a genomic DNA template with a known high A. cantonensis DNA concentration. Isothermal reactions of 4 μL or ~100 ng genomic DNA were performed in 50 μL reactions using a TwistAmp® exo kit according to the manufacturer's protocol (TwistDX, Cambridge, UK) in an Axxin T8 isothermal instrument (Axxin, Fairfield, Victoria, Australia). A 2 mm steel micro mixing ball was added into each reaction tube with a Micro Ball Dispenser (TwistDx, Cambridge, UK). A nuclease-free H2O negative control was included in each run to monitor contamination. Magnesium acetate solution was added to the cap of each tube, and the reaction was initiated by simultaneous mixing of all tubes in a tube strip. Tubes were centrifuged and placed into the fluorometer, which held the tube strip at a constant temperature of 40°C. Four magnetic mixing cycles of 3 s each were performed by the fluorometer at the beginning of the amplification cycle. Cumulative fluorescence of the samples was measured at 10-s intervals for 15 min.
The best primer combination was selected based on the slope of the amplification curve at a fluorescence threshold of 2000 mV and the time required to pass the threshold. The threshold was arbitrarily chosen in a region of exponential growth of the amplification curve. The slope was measured by the change in fluorescence per unit of time (10 s). The best performing primer pairs had steep slopes that crossed the fluorescence threshold in a minimal amount of time.
RPA-EXO genomic DNA sample testing
The RPA-EXO assay with the best-performing primers was used to test the 35 genomic DNA slug samples using the methods described above. To determine whether the samples were positive or negative for A. cantonensis, negative control reactions were used to determine slope cut-off values and fluorescence threshold. The maximum baseline slope from individual negative control reactions was calculated by using T8 isothermal instrument software. These values were averaged, and a cut-off value was determined by adding three standard deviations to the mean maximum slope. Similarly, a cut-off fluorescence threshold was determined by averaging the highest fluorescence reading for all negative control reactions plus three standard deviations. Samples were considered to be positive if they exceeded the negative control maximum slope cut-off values and the negative control's highest fluorescence threshold. Samples were determined to be equivocal if one replicate did not pass the threshold or did not meet the maximum slope.
RPA-LFA development
The primer and probe sequences for the RPA-LFA were identical to the best-performing primers and probe used in the RPA-EXO with minor modifications to allow for amplicon detection in the lateral flow format (TwistAmp® nfo kit, TwistDx). In the probe design, the dT-quencher (BHQ-1) dye is removed from the sequence and a FAM label was added to the 5′-end, and the reverse primer is modified to add a biotin label at the 5′-end for binding and visualization of the amplicon on lateral flow test strips (PCRD, Abingdon Health, York, UK, 2017). The forward primer was not modified in any way and was identical to the RPA-EXO forward primer. As a positive control, the PCRD lateral flow test strips contain an anti-mouse antibody line which will bind to carbon particles coated with mouse serum included in the reaction.
RPA-LFA genomic DNA sample testing
The 35 genomic DNA samples tested by qPCR and RPA-EXO were also comparatively tested by RPA-LFA. Samples were amplified using the TwistAmp® nfo kit (TwistAmp, Cambridge, UK) using 100 ng of genomic DNA as per the manufacturer's protocol. Magnesium acetate was added to the lid of each reaction tube and the tubes were then capped, mixed and briefly centrifuged. Tubes were incubated at 40°C in a thermocycler (C1000 Touch, Bio-Rad, Life Science, Hercules, CA, USA) for 3 min, then briefly vortexed, centrifuged and incubated for another 17 min. The reaction tubes were put on ice to stop DNA amplification. Nuclease-free dH2O was used in one reaction to monitor for contamination in each run. Individual RPA-LFA reaction products (5 μL) were added to 70 μL PCRD lateral flow test strip rehydration buffer (Abingdon Health, York, UK), mixed by vortexing, and briefly centrifuged. The total volume (75 μL) was loaded onto a PCRD lateral flow test strip. The results were visually read by eye after 10 min and documented by photography.
Comparative sensitivity tests
To compare the sensitivity of the RPA-EXO and RPA-LFA assays developed in this study to the qPCR assay of Qvarnstrom et al. (Reference Qvarnstrom, da Silva, Teem, Hollingsworth, Bishop, Graeff-Teixeira and da Silva2010), we ran 2-fold serial dilutions of plasmids containing the 798 bp ITS1 target region (described above) on each assay. The cloning primers (27F and 815R) were tested by PCR on genomic DNA from a P. martensi that was previously confirmed positive for A. cantonensis infection using the Jarvi et al. (Reference Jarvi, Farias, Howe, Jacquier, Hollingsworth and Pitt2012) assay. For PCR, a master mix comprised of 2.5 μL 10× CoralLoad PCR buffer (Qiagen), 2 μL 10 mm dNTPs, 1.25 μL 10 μ m primers 27F and 815R, 16.50 μL dH2O and 0.5 μL Taq polymerase (5 U μL−1) (Qiagen) was produced. One microlitre of genomic DNA was added to 24 μL master mix and the reaction heated to 95°C for 4 min, then 34 cycles of 95°C for 30 s, gradient 50–60°C for 30 s, 72°C for 45 s, were completed and the reaction held at 72°C for 10 min in a C1000 Touch thermocycler. PCR products were then visualized as a single band by gel electrophoresis. PCR products were cleaned using the Monarch® PCR and DNA Cleanup Kit (New England Biolabs, Ipswich, MA, USA). PCR products were cloned following the manufacturer's protocols (Invitrogen TOPO TA Cloning Kit, Thermo Fisher Scientific, Waltham, MA, USA). Plasmid isolation was completed using the Monarch® Plasmid Miniprep Kit (New England Biolabs, Ipswich, MA, USA). The nucleic acid concentration was measured with a Bio-Spec Nano (Shimadzu). The plasmid stock solutions were aliquoted and stored frozen (−20°C) until use. Plasmid-derived primers were used for the sequencing of the full cloned product. Products from four plasmids were prepared and sequenced for verification (Applied Biosystems 3730 xl, Sequetech, Mt. View, CA, USA). Sequences were trimmed and evaluated for quality and aligned using Sequencher v. 5.4.6 and pairwise distance (variance estimated by bootstrap 1000 reps; Kimura 2-parameter model) and sequence comparisons completed in MEGA7: Molecular Evolutionary Genetics Analysis version 7.0 (Kumar et al., Reference Kumar, Stecher and Tamura2016).
Based on sequence homology to A. cantonensis, one plasmid was selected and used for comparative sensitivity testing. The concentration of plasmids per μL was determined based on molecular weight (Geneious 8.1.9) and DNA concentration. Eight 2-fold serial dilutions resulting in concentrations of ~1 copy μL−1 to 100 copies μL−1 were prepared before use, and 1 μL of each plasmid dilution was used in 50 μL reactions for testing by qPCR, RPA-EXO and RPA-LFA in triplicate as described above.
Results
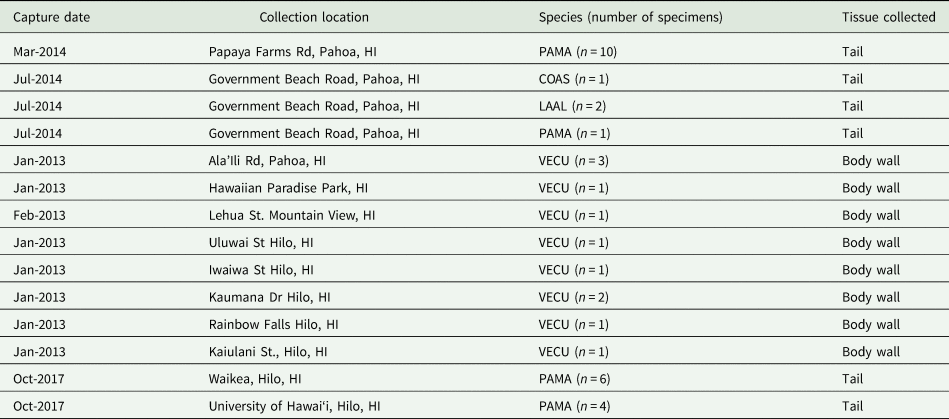
A total of 35 slugs were used in this study and were collected throughout 2013–2014, and in 2017 from multiple geographic locations on East Hawai‘i Island (Table 1). DNA from gastropods collected in 2013–2014 (P. martensi, V. cubensis, C. aspersum and L. alte) had been previously extracted and tested by PCR, so A. cantonensis infection status was established and selection of samples included known positives with multiple levels of infection and samples that previously tested negative. Sample collection in 2017 focused on P. martensi (semi-slug) due to the high level of infection previously documented in this particular species (Hollingsworth et al., Reference Hollingsworth, Kaneta, Sullivan, Bishop, Qvarnstrom, da Silva and Robinson2007; Jarvi et al., Reference Jarvi, Farias, Howe, Jacquier, Hollingsworth and Pitt2012; Kim et al., Reference Kim, Hayes, Yeung and Cowie2014), but infection status was not established prior to testing in these samples.
Specimens from Hawai‘i Island used for DNA extraction in this study*
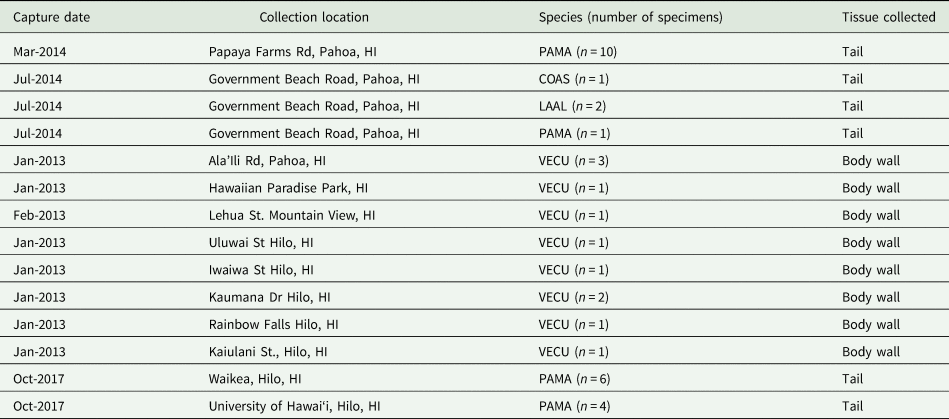
* Capture date and location, species and type of tissue collected for DNA extraction are included.
PAMA (Parmarion martensi), LAAL (Laevicaulis alte), VECU (Veronicella cubensis) and COAS (Cornu aspersum).
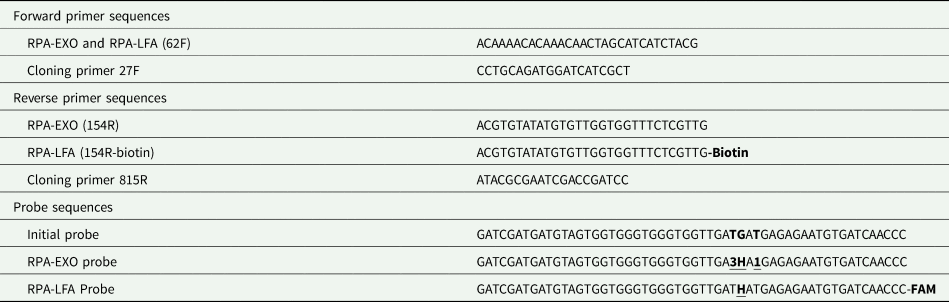
This study successfully developed a probe and one set of primers that were able, with modification, to accommodate both RPA-EXO and RPA-LFA applications for the detection of A. cantonensis (Table 2). Multiple probe sequences were evaluated for potential hairpin formation, and one sequence that fit TwistAmp® exo and nfo kit specifications (TwistDx) was selected, adapted and synthesized (LGC Biosearch Technologies, Novato, CA). Of the 25 primer pair combinations tested, one pair (62F/154R) was selected as the optimal primer pair. According to RPA-EXO testing, the primer pair produced the highest maximum slope in its amplification curve (105.6; overall range 21.9–105.6) with a relatively short time to cross the fluorescence threshold (240 s; overall range 230–360 s).
RPA-EXO and RPA-LFA primer and probe sequences (5′–3′)*
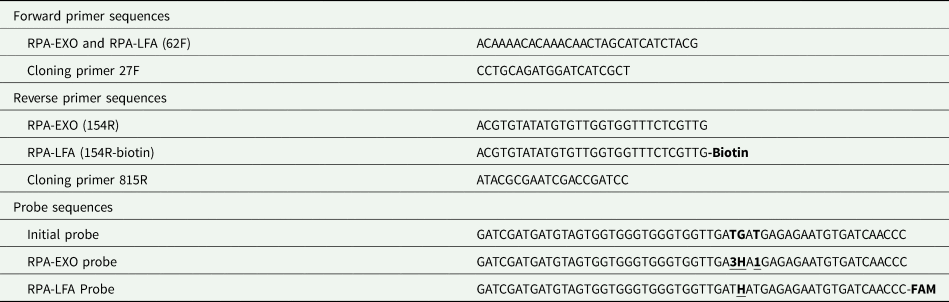
* Modified sites are shown in bold and underlined. For RPA-EXO, 3 indicates the dT-FAM fluorophore, H indicates THF residue (which replaces a G) and 1 indicates the dT-quencher BHQ-1. For RPA-LFA only the THF residue was incorporated along with the addition of FAM at the 3′-end. Cloning primers amplify an ITS1 region that includes the target regions of the qPCR, RPA-EXO and RPA-LFA assays.
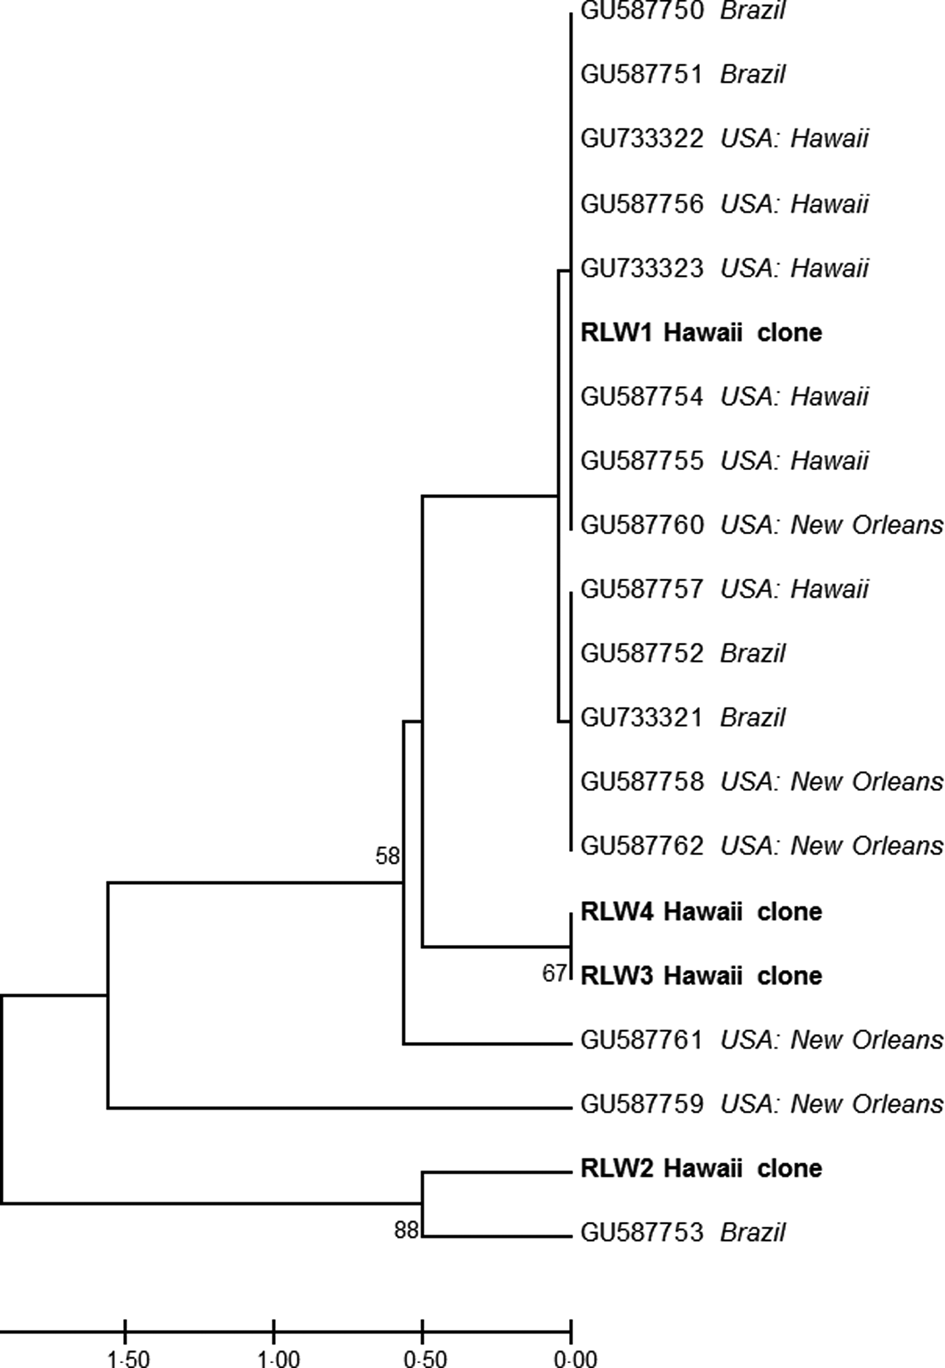
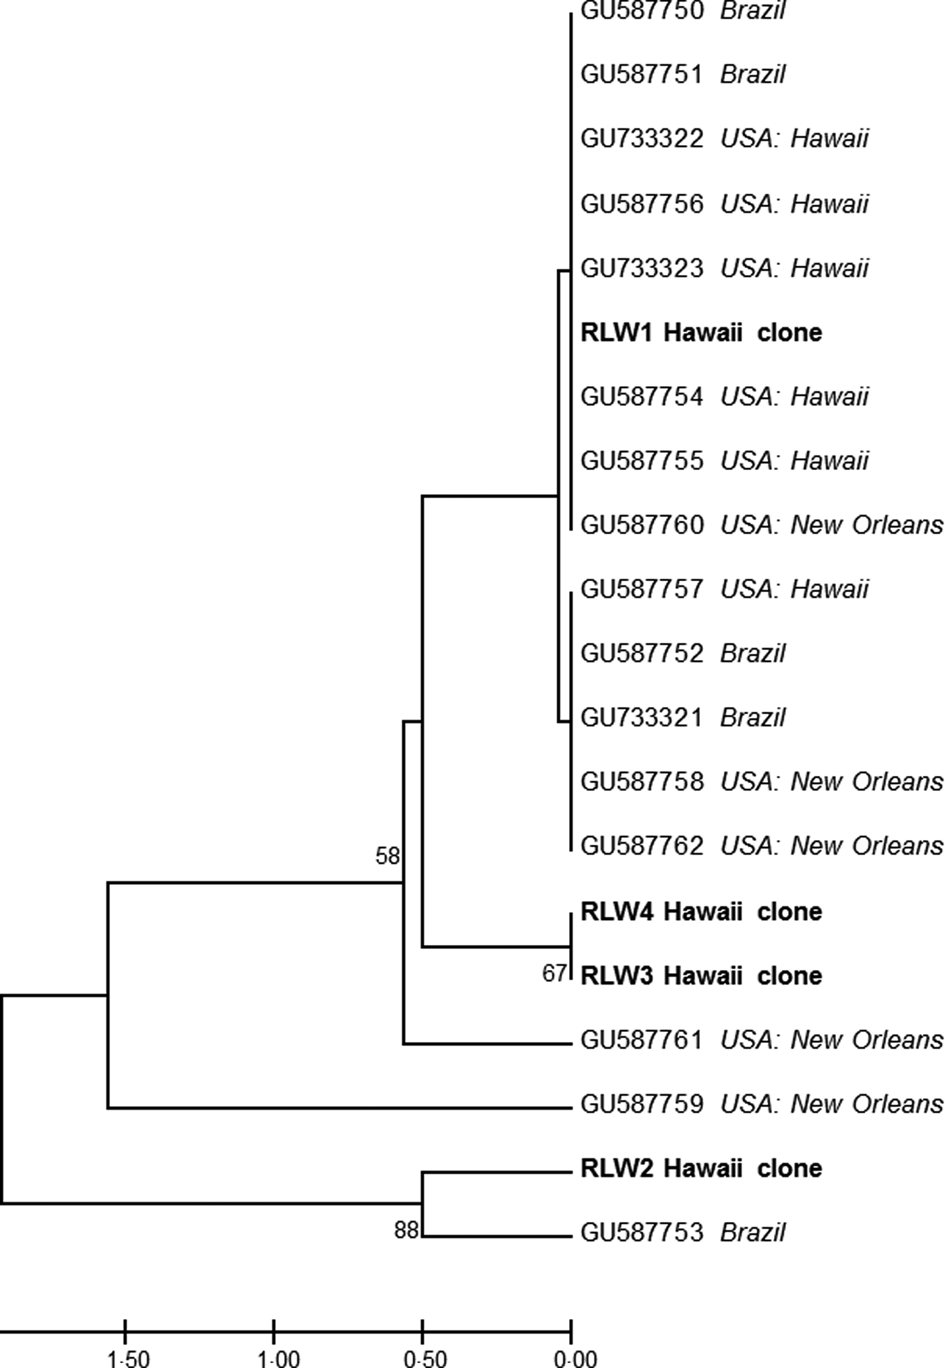
Sequence and alignment analysis of the 798 bp ITS1 region (758 bp after trimming primers) used for comparative assay sensitivity testing found all four clones had high sequence homology with previously published ITS1 sequences from A. cantonensis (Fig. 1) (Kumar et al., Reference Kumar, Stecher and Tamura2016). The four clones originating from a single P. martensi also showed low diversity levels, with only 5 of 758 variable nucleotide sites. Four of these variable sites occurred in clone RLW2, and one variable site was found in RLW3 and RLW4. Clone RLW1 was 100% identical to eight previously published ITS1 sequences confirming the sequence cloned originated from A. cantonensis. Sequences were deposited in GenBank (accession nos. MW024043–MW024046) (Clark et al., Reference Clark, Karsch-Mizrachi, Lipman, Ostell and Sayers2016). Pairwise distances between the four clones and two comparable sequences from Angiostrongylus mackerrasae (GenBank nos. KP776410 and KP776411) were also calculated in MEGA 7, and average d = 0.004315.
A UPGMA tree constructed in MEGA v. 7 showing the relationships of the four clones containing the target regions for both the qPCR and RPA assays with 16 previously published ITS sequences (GU733321–23, GU587750–62). Evolutionary distances were computed using the number of differences method with pairwise deletion. Bootstrap values (1000 replicates) greater than 50 are shown.
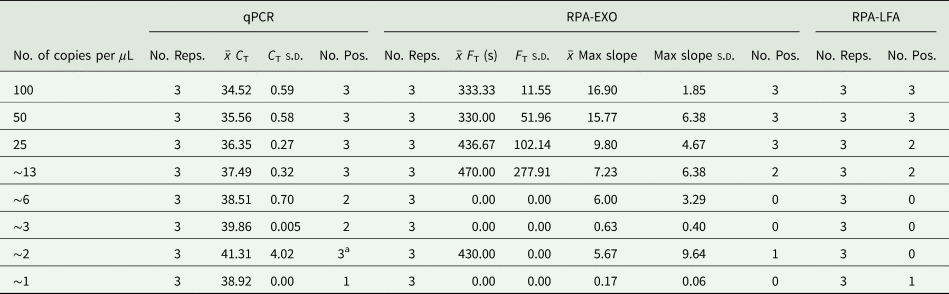
Based on identical sequence homology to many published ITS sequences, clone RLW1 plasmids were selected for comparative sensitivity testing. The sensitivity of the three assays evaluated in this study varied when testing plasmid dilutions (Table 3) with qPCR being the most sensitive assay. All plasmid concentrations were detected by qPCR, although the limit of consistent detection (in triplicate) was a plasmid concentration of ~13 copies μL−1 (C T of 37.49). RPA-EXO, on the other hand, showed consistent detection of 25–100 copies μL−1, some detection in 13 copies μL−1, and intermittent detection in lower concentrations. The RPA-LFA assay was the least sensitive assay with consistency seen in 50–100 copies μL−1, some detection of ~13–25 copies μL−1, and intermittent detection in lower concentrations. All negative control reactions were negative in each assay. For plasmid reactions to be considered positive by RPA-EXO, the maximum slope needed to exceed 8.89 and the fluorescence threshold was >371.929.
Sensitivity comparison tests based on serial dilutions of clone RLW1*
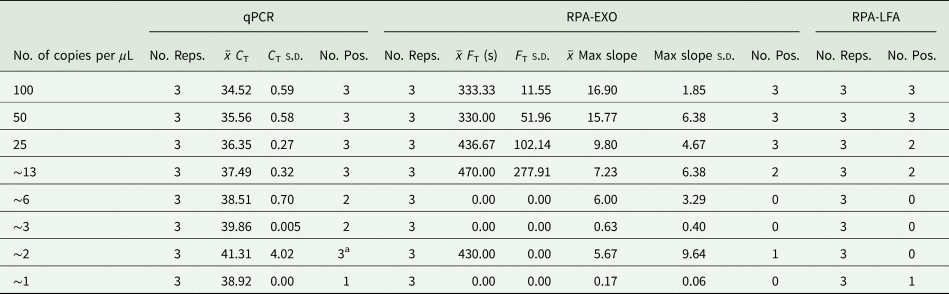
* For RPA, x̄ F T is the mean time in seconds to cross the fluorescence threshold (Reps., replicates; Pos., positive; s.d. standard deviation).
a Equivocal as the s.d. >1.0.
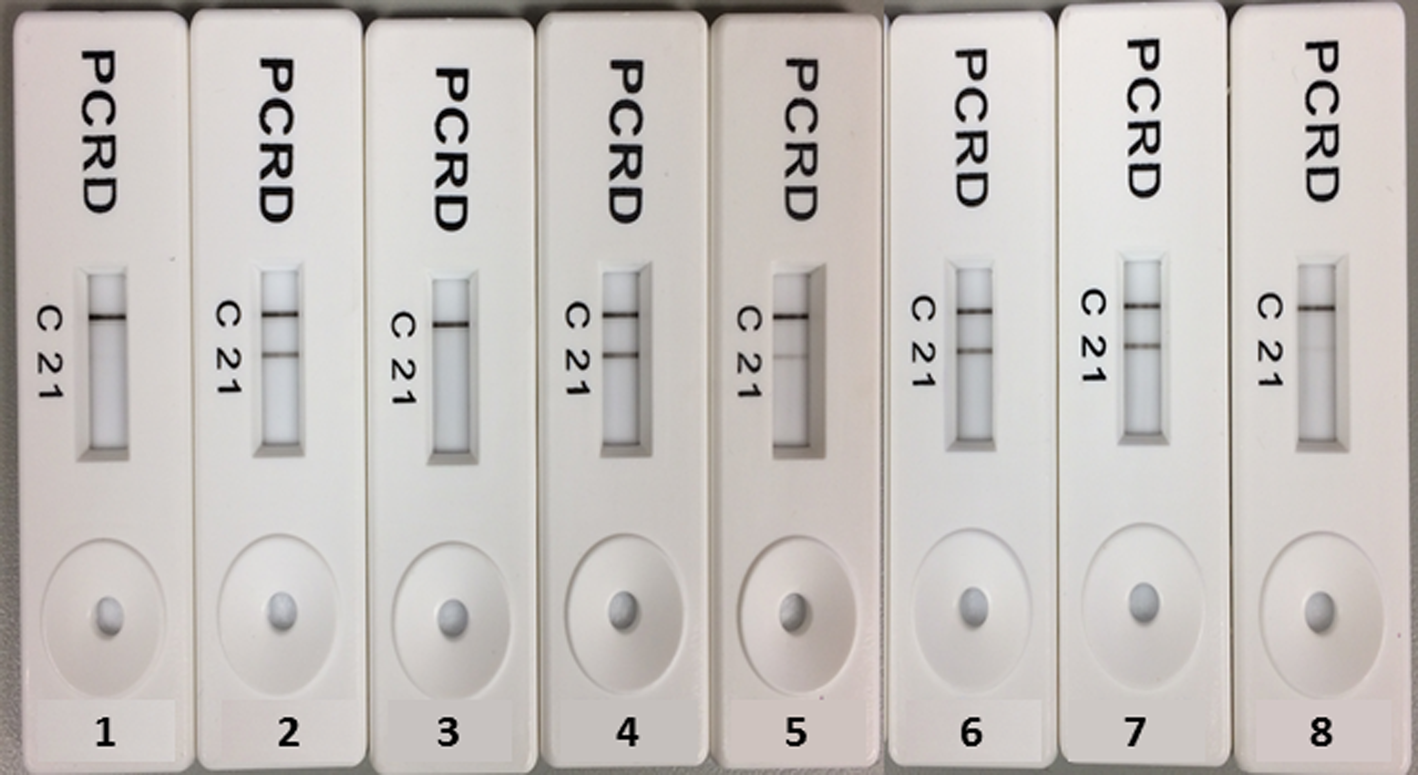
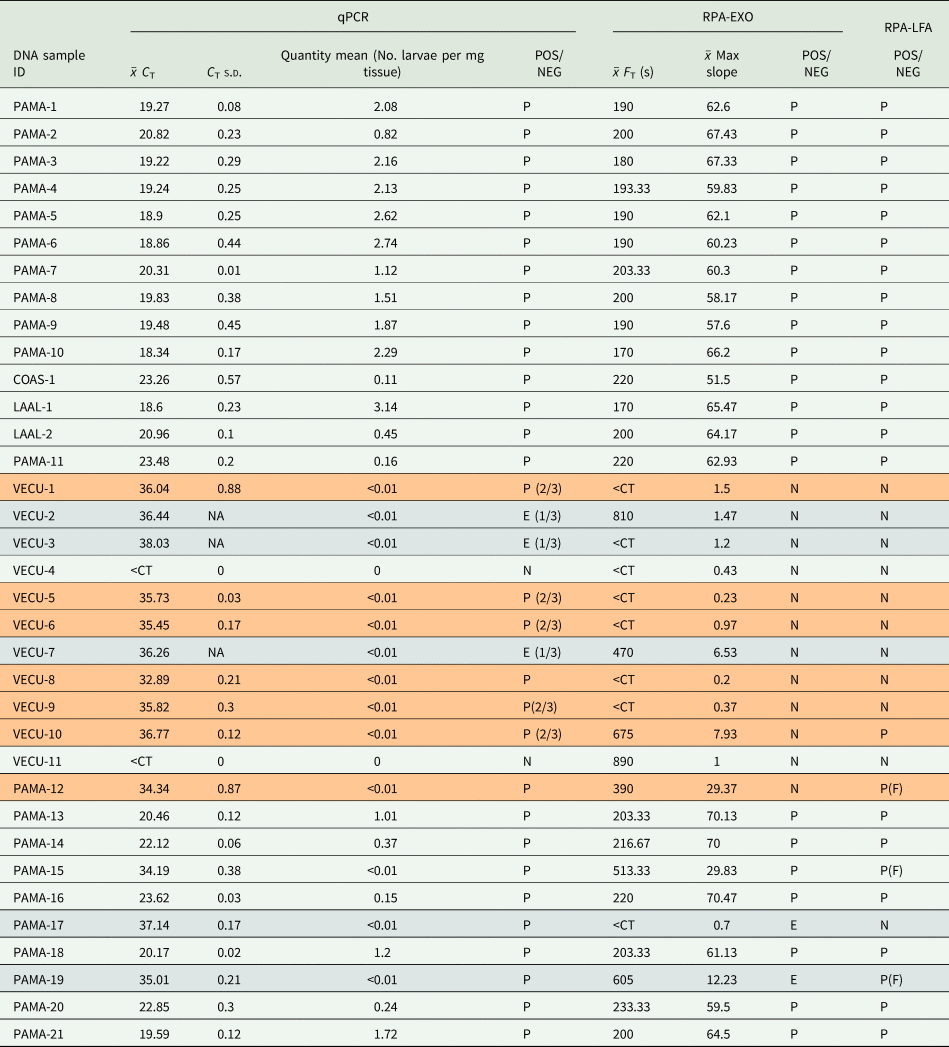
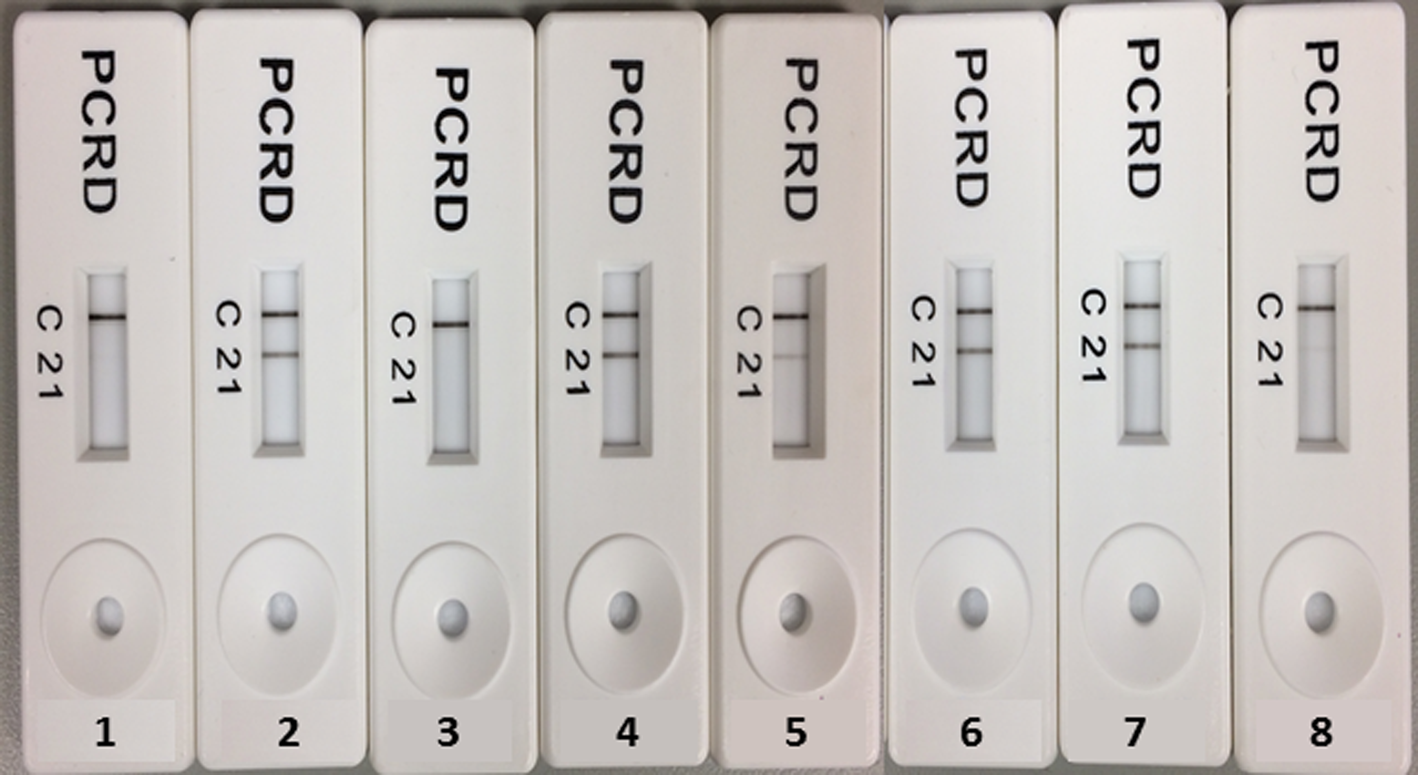
Application of each assay to 35 genomic DNA slug samples showed agreement across assays in 23 samples (65.7%), equivocal in five samples (14.3%) and disagreement in seven samples (20%) (Table 4). Of the 23 samples that agreed across assays, only two were found to be negative by all assays. Overall, RPA-EXO produced 12/35 negative results, and RPA-LFA produced 11/35 negative results. All equivocal samples were the result of qPCR or RPA-EXO results, as RPA-LFA results were categorical as either positive (two bands) or negative (one band) (Fig. 2) with consistent replication. The positive percent agreement between RPA-EXO and qPCR was 60% (21/35), and between RPA-LFA and qPCR was 65.7% (23/35). The negative percent agreement for RPA-EXO and qPCR and RPA-LFA and qPCR were each 5.7% (2/35). Control reactions were run with each sample and were all negative. For the RPA-EXO reactions, the slope needed to exceed 2.61 and fluorescence needed to exceed an 833.44 fluorescence threshold (F T) for samples to be considered positive.
Examples of lateral flow test results showing negatives as one control band (nos. 1and 3), positive as two bands (nos. 2, 4, 6 and 7) and faint positives indicating very low levels of DNA present (nos. 5 and 8).
Results from the 35 genomic DNA samples tested by qPCR, RPA-EXO and RPA-LFA*

* All tests run in triplicate, and triplicate means are provided. Results consistent for all three tests in triplicate are not highlighted, samples with equivocal (Equivocal qPCR samples did not repeat in triplicate, the number positive is shown in the POS/NEG column. For RPA, the equivocal sample either did not pass the cycle threshold or did not meet the maximum slope in every replicate.) results highlighted in grey, and sample results that were not consistent across tests in orange. PAMA (P. martensi), LAAL (L. alte), VECU (V. cubensis), COAS (C. aspersum). P = triplicate positive results, N = triplicate negative results, E* = equivocal. P(F) indicates a very faint RPA-LFA band was observed.
Discussion
Although PCR-based amplification of DNA from targeted pathogens or parasites is a common approach to disease diagnostics, it requires trained personnel, costly reagents and the use of specialized, expensive equipment generally not available outside of a laboratory setting. Here, we compare the sensitivity and accuracy of conventional qPCR with an RPA-EXO assay (Piepenburg et al., Reference Piepenburg, Williams, Stemple and Armes2006) and RPA-LFA assay (Ghosh et al., Reference Ghosh, Kokane, Kokane, Warghane, Motghare, Bhose, Sharma and Reddy2018) for the detection of A. cantonensis DNA in intermediate gastropod hosts.
We use the term ‘sensitivity’ based on the limit of detection in serial plasmid dilutions. Our RPA-EXO and RPA-LFA assays are not as sensitive at low DNA concentrations as the current qPCR assay, but are accurate and comparable for higher DNA concentrations. Neither of our RPA-EXO nor RPA-LFA assays could consistently detect ~13 copies μL−1 as found in qPCR. The ability of our RPA-EXO and RPA-LFA assays to consistently detect 50–100 copies μL−1 in triplicate and ~13 copies μL−1 in duplicate suggests that our RPA assays are a promising alternative for the current qPCR assay for samples expected to have higher concentrations of A. cantonensis DNA.
Twenty-three out of the 35 genomic DNA samples that were tested showed consistent results among qPCR, RPA-EXO and RPA-LFA, suggesting that RPA-EXO and RPA-LFA are at least 65.7% accurate when compared to highly sensitive qPCR. The majority of discordant samples testing negative by RPA-EXO or RPA-LFA were either considered equivocal or not consistent by qPCR. These were all samples containing <0.01 larvae per mg tissue based on qPCR estimates, thus were extremely low-level infections. Three samples resulted in very faint bands by RPA-LFA, which was consistent with very low levels of DNA present based on qPCR-based quantification. Therefore, although qPCR did show some level of detection in these extremely low concentration genomic samples, even qPCR results were not optimal.
Determining if the primers and probe cross-react with other closely related species of Angiostrongylus is an important step in the development of the assays. It has been seen with other regions of A. cantonensis DNA sequences that the primers and probe were cross-reactive with A. mackerrasae (reviewed in Barratt et al., Reference Barratt, Chan, Sandaradura, Malik, Spielman, Lee, Marriott, Harkness, Ellis and Stark2016). Minimal average pairwise genetic distance among two A. mackerrasae sequences and our four clones suggests a strong likelihood that these primers and probe could also be used for detection of A. mackerrasae DNA. Based on NCBI Blast searches, the forward primer is a 100% match to A. cantonensis, but a 90–93% match with A. mackerrasae, while the reverse primer and probe are 100% match with both species. Angiostrongylus mackerrasae is not known at this time to be in Hawai‘i, which provides confidence that the sequences we report originate from A. cantonensis.
The RPA-EXO and RPA-LFA assays developed in this study could be utilized as low-cost alternatives to qPCR for spatial or temporal monitoring to assist in control A. cantonensis prevalence in slugs and snails of a region. In Hawai‘i, there is growing interest by homeowners, land managers, government officials, and other stakeholders to know if snails in and around their properties or communities are infected. Infection in gastropods across the state of Hawai‘i is widespread, with at least 16 gastropod species from five of the main Hawaiian islands found to be positive for A. cantonensis (Kim et al., Reference Kim, Wong, Curry, Yeung, Hayes and Cowie2019). Relatively low-cost assays such as RPA-LFA could be utilized by a much broader population to assist in widespread monitoring throughout the state, both in regions with known high A. cantonensis infection levels such as east Hawai‘i Island as well as in regions with relatively low infection levels. In such scenarios, untrained users could freeze collected snails to neutralize the risk of infection (Alicata, Reference Alicata1967), then perform simple DNA extraction techniques (Atkinson et al., Reference Atkinson, Watcher-Weatherwax, Roy, Heller and Keith2017; Zou et al., Reference Zou, Mason, Wang, Wee, Turni, Blackall, Trau and Botella2017), and RPA-LFA for A. cantonensis detection in a non-laboratory environment.
In a clinical setting, RPA-EXO or RPA-LFA technology could be applied to many aspects of the diagnosis and control of A. cantonensis. Real-time PCR testing of CSF is currently considered the definitive method for human diagnostics, but in the USA lumbar punctures are only performed at a hospital, and results usually take days to weeks to receive due to the shortage of labs that currently conduct this test. The minimal amount of equipment needed for conducting RPA-EXO and RPA-LFA would allow reactions to be completed in the field or a clinician's office for point-of-care diagnostics, within minutes rather than days. LFA has already been adapted to human diagnostics for many diseases (Koczula and Gallotta, Reference Koczula and Gallotta2016). Neuroangiostrongyliasis diagnosis or A. cantonensis parasite detection has been reported using antibody-based methods on human CSF and blood samples (Eamsobhana et al., Reference Eamsobhana, Yong, Mak and Wattanakulpanich1997, Reference Eamsobhana, Yoolek and Punthuprapasa2003, Reference Eamsobhana, Tungtrongchitr, Wanachiwanawin and Yong2018; Jarvi et al., Reference Jarvi, Eamsobhana, Quarta, Howe, Jacquier, Hanlon, Snook, McHugh, Tman, Miyamura, Kramer and Myers2020), and an effective LFA immunoassay has been developed for the detection of A. cantonensis antibodies (Eamsobhana et al., Reference Eamsobhana, Tungtrongchitr, Wanachiwanawin and Yong2018). Although the RPA-EXO and RPA-LFA assays developed in this study are not sensitive enough to detect the low levels of A. cantonensis typical in most CSF and blood samples, with the right target region they could be quick, reliable, inexpensive alternatives to qPCR. The assays developed here could, however, be used in a clinical setting by doctors or veterinarians for detection of A. cantonensis in slug or snail samples following a known exposure event, which might inform treatment decisions. Thus, the RPA-EXO and RPA-LFA assays developed here have potential applications in both field and clinical settings.
Conclusion
Our RPA-EXO assay is comparable to our RPA-LFA assay in terms of both accuracy and sensitivity, but the current A. cantonensis traditional qPCR assay appears more sensitive than either of these tests when testing low infection level samples (<0.01 larvae per mg tissue). However, in situations where a rapid, inexpensive detection method is needed for A. cantonensis, our RPA-EXO and RPA-LFA assays provide reliable alternatives to qPCR with samples expected to have higher target DNA concentrations.
Acknowledgements
The authors thank Dr Carter Atkinson, U.S. Geological Survey, Pacific Island Ecosystems Research Center, for providing guidance and mentorship during the study and for offering fundamental background information.
Financial support
Funding for this study was provided by the Hawai‘i State Legislature, and the University of Hawai‘i at Hilo Daniel K. Inouye College of Pharmacy.
Conflict of interest
The authors declare there are no conflicts of interest.