Introduction
There were 243 laboratory-reported cases of Escherichia coli O157 in Scotland in 2006 (or 4.8 per 100 000, of which 37% were phage type (PT) 21/28) (Health Protection Scotland, http://www.hps.scot.nhs.uk/ewr/article.aspx, last accessed 16 August 2007). This compares with an EU average of 1.2 per 100 000 (European Centre for Disease Prevention and Control, 2007) and it is clear that Scotland is a hotspot for this disease within the EU.
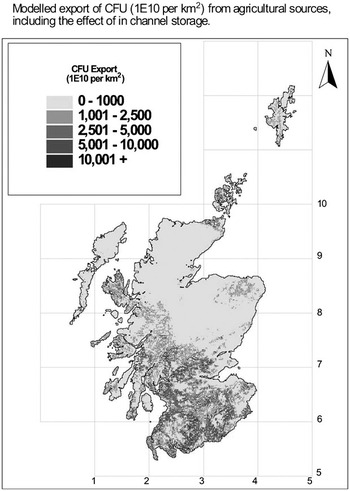
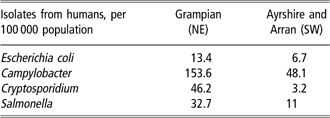
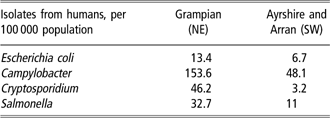
The incidence of this and other human gastrointestinal infections caused by zoonotic pathogens shows significant spatial heterogeneity within Scotland, with North-East (NE) Scotland having a high incidence. Table 1 illustrates this point for the four main zoonoses (derived from Reilly and Browning, Reference Reilly and Browning2002), comparing NE and South-West (SW) Scotland. Both of these areas are strongly agricultural, but the stocking density in SW Scotland, where dairy farming predominates, is actually much higher than that in NE Scotland where mixed arable/livestock farming is prevalent. A model of faecal coliform loss from farmland to surface water (SNIFFER, 2006) has shown that the predicted loads of faecal coliforms to surface waters are much higher in SW than in NE Scotland (see Figure 1). This high loss of faecal indicators to surface water makes coastal recreational bathing waters in SW Scotland vulnerable to microbial contamination, and causes failure to meet EU Bathing Water standards designed to protect human health and ensure aesthetic standards for beaches (Curriero et al., Reference Curriero, Patz, Rose and Lele2001; Crowther et al., Reference Crowther, Kay and Wyer2002; Scottish Environment Protection Agency (SEPA), 2002; Vinten et al., Reference Vinten, Lewis, McGechan, Duncan, Aitken, Hill and Crawford2004; Kay et al., Reference Kay, Aitken, Crowther, Dickson, Edwards, Francis, Hopkinds, Jeffrey, Kay, McDonald, McDonald, Stapleton, Watkins, Wilkinson and Wyer2007). The public health issue has been demonstrated with a number of outbreaks of E. coli O157 that have been clearly linked with recreational water (e.g. Ihekweazu et al., Reference Ihekweazu, Barlow, Roberts, Christensen, Guttridge, Lewis and Painter2006).
Predicted export of faecal coliforms from agricultural sources to surface waters using PAMIMO-C (SNIFFER, 2006). Reproduced with permission.

Incidence of four zoonoses in isolates of human faeces (Reilly and Browning, Reference Reilly and Browning2002) in North-East (NE) and South-West (SW) Scotland
In NE Scotland, although bathing waters generally pass EU standards, microbial pathogen-contaminated private water supplies (PWS) pose a potential threat to human health. Reid et al. (Reference Reid, Edwards, Cooper, Wilson and McGaw2003) point out that the region has a very high density of PWS (11% of the population, compared with an average of 1%). This is due to the presence of permeable soils and shallow phreatic aquifers, making small-scale pumping or spring-fed wells cost effective compared with mains water supply to rural households and small communities. Strachan et al. (Reference Strachan, Dunn, Locking, Reid and Ogden2006) have summarised the causes of outbreaks of E. coli O157 infection in Scotland over the period from 1994 to 2003, and show that PWS are implicated in about 50% of the environmental outbreaks. Others (e.g. Licence et al., Reference Licence, Oates, Synge and Reid2001) have documented individual cases of PWS contamination. Halliday et al. (Reference Halliday, Chase-Topping, Pearce, McKendrick, Allison, Fenlon, Low, Mellor, Gunn and Woolhouse2006) have also found a strongly significant correlation between the presence of the highly virulent PT 21/28 in faecal pats on E. coli O157 positive farms in Scotland, and the presence of a PWS. Northerly farm location was also a risk factor for PT 21/28 presence. Whilst eating contaminated food and direct contact with livestock are also both highly significant factors in disease incidence, the water ingestion route is clearly an important infection pathway.
In this paper, we investigate the extent to which the incidence of E. coli O157 presence in human faeces (Table 1) in NE and SW Scotland can be explained by estimated risk of infection due to the intake of contaminated water in these two areas. As the soils of SW Scotland are generally derived from imperfectly drained glacial till and discharge rapidly through surface horizons and artificial drainage to surface waters, there are far fewer PWS than in NE Scotland, where sandy, freely drained soils are often found. We therefore simplified the regional comparison by assessing only the risks of E. coli O157-related illness from bathing at designated bathing waters in Ayrshire, and only risks of consuming water from PWS in Aberdeenshire. Such a comparison does not constitute a full quantitative risk assessment, but provides a framework for future work to assess the role of the waterborne route in human infection and hence the cost-effectiveness of mitigation measures.
Material and methods
Risk of infection
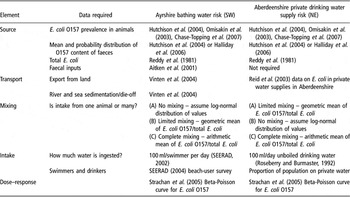
Table 2 summarises the approach taken to assess the risk of infection by E. coli O157 via bathing water and drinking water. The daily risk of infection has been estimated using the approximate Beta-Poisson relationship, with coefficients as in Strachan et al. (Reference Strachan, Doyle, Kasugac, Rotariu and Ogden2005):

where P is the probability that an exposed person will become infected given a specific dose, D is the daily dose (cells), β is the fitting parameter related to dose for 50% infection (β = 15.86 in Strachan et al., Reference Strachan, Doyle, Kasugac, Rotariu and Ogden2005), and α is the coefficient (0.162 in Strachan et al., Reference Strachan, Doyle, Kasugac, Rotariu and Ogden2005).
Elements of risk assessment used to compare risk of Escherichia coli O157 infection from bathing in Ayrshire (SW) and drinking from private water supplies in Aberdeenshire (NE)

SW = South-West; NE = North-East.
For a population at risk of exposure to doses of E. coli O157, the value of D for a particular water source on a given day is assumed to depend on the intake of water during bathing in SW Scotland, or of drinking water from a PWS in NE Scotland. It is given by

where E SW/NE (c) is the E. coli content, c, of water (cells/ml), R SW/NE (r) is the ratio of E. coli O157 (r)/total E. coli in intake water, W SW/NE is the daily water intake (ml), and the subscripts refer to bathing water intake in SW Scotland (SW) or drinking water intake in NE Scotland (NE).
The value of E SW/NE (c) is assumed to vary according to the flow conditions in the case of bathing water and to vary across different water supplies in the case of drinking water.
We assume that the function R(r) can be estimated from literature data on the probability distribution of E. coli O157 in fresh cattle faeces, combined with a deterministic estimate of total E. coli content of cattle faeces (we used the log value per gram faeces of 5.36 (Reddy et al., Reference Reddy, Khaleel and Overcash1981)), and the value of R(r) is assumed to have an upper bound of 1. The E. coli O157 content of cattle faecal pats on 88 E. coli O157-positive Scottish farms (18% of farms sampled) has been quantified by Halliday et al. (Reference Halliday, Chase-Topping, Pearce, McKendrick, Allison, Fenlon, Low, Mellor, Gunn and Woolhouse2006). Both highly virulent (PT 21/28 strain) and low virulence strains were included. The value of animal prevalence in this dataset has been estimated from the data of Chase-Topping et al. (Reference Chase-Topping, McKendrick, Pearce, MacDonald, Matthews, Halliday, Allison, Fenlon, Low, Gunn and Woolhouse2007). We also consider two other estimates of E. coli O157 content of faeces. Hutchison et al. (Reference Hutchison, Walters, Avery, Synge and Moore2004 and Reference Hutchison, Walters, Avery, Munro and Moore2005) sampled faecal material from cattle, sheep, poultry and pigs across the UK, and determined the prevalence, arithmetic mean and geometric mean of the E. coli O157 contents. Omisakin et al. (Reference Omisakin, MacRae, Ogden and Strachan2003) determined the frequency distribution of E. coli O157 content in samples at both herd and individual animal scales, on a limited number of samples (n = 44). These three will be referred to as Halliday, Hutchison and Omisakin datasets.
We make three alternative assumptions about the probability distribution R(r) in the daily intake of contaminated water from private supplies:
(A) The probability distribution of R(r) in water samples is given by the distribution of E. coli O157 for single faecal deposits divided by the estimate mean of the total E. coli content. It should be noted, however, that as we have used a deterministic estimate of the total E. coli, this will not give the true distribution of this ratio. The probability distribution of E. coli O157 content (estimated to be log-normal) from individual faecal deposits in the Halliday or Omisakin datasets was used to describe the distribution of R(r) in the water sample. The geometric s.d. of the E. coli O157 contents from the samples taken by Hutchison et al. (Reference Hutchison, Walters, Avery, Synge and Moore2004) was estimated on the basis that if the data are lognormally distributed, the natural logarithm of the geometric s.d. (σ) is given by σ 2 = 2[ln(arithmetic mean) − ln(geometric mean)]. The probability of infection (P) was multiplied by the prevalence.
(B) The value of R(r) in water samples is given by the geometric mean values of E. coli O157 divided by the estimated total E. coli in faecal deposits. This is based on the assumption that E. coli from faecal sources are not fully mixed before entering water. The geometric mean was for positive isolations only and the probability of infection (P) was therefore multiplied by the prevalence of E. coli O157 in animal wastes. As the dose–response function is concave, use of the geometric mean may result in either over- or under-estimation of the population risk (Crump, Reference Crump1998).
(C) The value of R(r) in water samples is given by the arithmetic mean values of E. coli O157 divided by the estimated total E. coli in faecal deposits. The arithmetic mean for positive isolations was multiplied by the prevalence to give the mean across all livestock. This is based on the assumption that complete mixing of E. coli from all faecal sources occurs before entering water. If complete mixing does not occur, use of the arithmetic mean will overestimate the population risk if the dose–response function is concave (Crump, Reference Crump1998).
Risk assessment of E. coli O157 contamination of Ayrshire bathing waters (SW)
The form of the probability distribution E SW (c) depends on transport to bathing waters from land. We have used the model of Vinten et al. (Reference Vinten, Lewis, McGechan, Duncan, Aitken, Hill and Crawford2004) to estimate this for the River Irvine catchment in Ayrshire. The flow percentile values for the River Irvine at Shewalton (tidal limits) were obtained from daily summer flow data for the years 1989 to 2002, provided by Scottish Environmental Protection Agency (E. Jow, personal communication). We have used die-off and export coefficients for faecal coliforms assuming these indicator bacteria behave similarly to E. coli O157 in the environment.
Table 3 summarises estimated geometric and arithmetic mean summer daily deposition rates in the Irvine Catchment in Ayrshire, using Hutchison et al. (Reference Hutchison, Walters, Avery, Munro and Moore2005) data for sheep and cattle, or using Hutchison et al. (Reference Hutchison, Walters, Avery, Munro and Moore2005) data for sheep and Halliday et al. (Reference Halliday, Chase-Topping, Pearce, McKendrick, Allison, Fenlon, Low, Mellor, Gunn and Woolhouse2006) data for cattle, with catchment stocking densities estimated by Aitken et al. (Reference Aitken, Merrilees and Duncan2001). Animal-level prevalences for the Halliday dataset were estimated from Chase-Topping et al. (Reference Chase-Topping, McKendrick, Pearce, MacDonald, Matthews, Halliday, Allison, Fenlon, Low, Gunn and Woolhouse2007) and the geometric and arithmetic means were estimated from data supplied by personal communication from this group.
Estimated geometric and arithmetic mean inputs/ha per day based on livestock densities for the River Irvine catchment in Ayrshire (SW)

SW = South-West.
The value of W SW depends on the period of time spent swimming. The Scottish Executive Environment and Rural Affairs Department (SEERAD, 2002), estimated 100 to 200 ml/swim is ingested, and we used the lower value of 100 ml. We assume this value is deterministic.
The overall probability of infection is obtained by calculating the expected probability of infection over the range of flows. This overall probability of infection is multiplied by a value that depends on beach use by the population. We assume that this value is deterministic. The number of bathers exposed has been estimated from a SEERAD (2004) aerial survey of beach use in Scotland. This survey flew over all designated and non-designated bathing beaches in Scotland on six fine weekend days in the summer of 2003 and photographed beach use. As a worst case, we assumed that these data were applicable to all days during the bathing water season. We assumed each survey fly-past represented 25% of the beach visits for any one day, and that the ratio of swimmers to total visitors observed represented the overall ratio on any one day. We have assumed that each person bathes only once, and that the annual number of infections per 100 000 can be calculated by multiplying the daily risk by the estimated number of bathers over a bathing season of 120 days, with each bathing event behaving independently. This was then rescaled by multiplying by 100 000 and dividing by the population of Ayrshire and Arran. The SEERAD (2004) beach-use survey, combined with our assumptions, gives about 40 000 bathing events per season on the six designated bathing waters in Ayrshire.
Aberdeenshire PWS (NE)
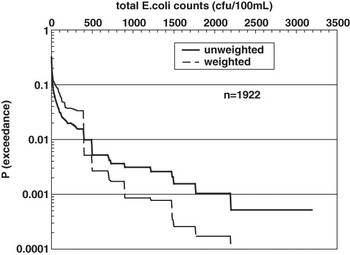
The form of the probability distribution E NE (c) is determined by the data of Reid et al. (Reference Reid, Edwards, Cooper, Wilson and McGaw2003), who report the incidence of failure of PWS in Aberdeenshire to reach the public health standard of no detectable E. coli/100 ml. We have calculated the probability distribution of E NE (c) using the original data (supplied by A. Lilly, personal communication). Figure 2 shows the probability of the exceedance curve for E. coli in the 1922 samples in the database. Curves are shown for the raw data, and for the data weighted by the size of the supply according to its classification under the PWS (Scotland) Regulations 1992. Table 4 summarises the frequency distribution of E. coli or faecal coliform counts in PWS for several areas of Scotland derived from the database from Reid et al. (Reference Reid, Edwards, Cooper, Wilson and McGaw2003). Distributions are given both taking equal weight to each PWS data point and also weighting the data according to expected water consumption at the site. However, it should be noted that the larger supplies are over-represented in the database because these are subject to statutory testing, whereas only a sample of those supplies serving a single dwelling was tested. The distributions are similar across Scotland, although there is a higher proportion of low-quality PWS in the Inverclyde area.
Probability of exceedance of given Escherichia coli counts in private water supply samples from Aberdeenshire (dataset from Reid et al., Reference Reid, Edwards, Cooper, Wilson and McGaw2003, supplied by A. Lilly, personal communication). Distributions are based on equal weighting to each sample, or weighted according to the size of the supply.

Frequency distribution of Escherichia coli or faecal coliform counts for private water supply survey of Reid et al. (Reference Reid, Edwards, Cooper, Wilson and McGaw2003)

NE = North-East; SW = South-West; cfu = colony-forming units.
Unweighted data uses all sample data equally, weighted data allows for expected consumption rate of the supply, using Private Water Supply (Scotland) Regulations 1992 classification.
The value of W NE depends on the daily intake of water by humans. This has been assumed to be deterministic, and has been estimated as the balanced population 50 percentile of 957 ml (Roseberry and Burmaster, Reference Roseberry and Burmaster1992). We assume that only 10% of this is taken as raw tap water without boiling or cooking.
For drinking water, we assume that the annual risk of infection can be calculated using the binomial distribution, assuming that each person is exposed to the same daily risk on 365 days per year, and that the same person cannot become infected more than once during the year as immunity is built up. The annual risk of infection from a particular water supply is therefore estimated as 1 − (1 − P)365, and the expectation of this over the range of E. coli counts is then calculated to give the overall annual risk of infection.
Since the number of infections is small, we assume that infections are completely independent. We further assume that all infections are symptomatic, that no secondary infections occur and that the proportion of the population using PWS in Aberdeenshire is 11% (www.aberdeenshire.gov.uk/statistics/area/aberdeenshire.asp#physical). Under these assumptions, we estimate the annual infection rate per 100 000 population by multiplying the annual risk of infection by 100 000 × 0.11.
Results
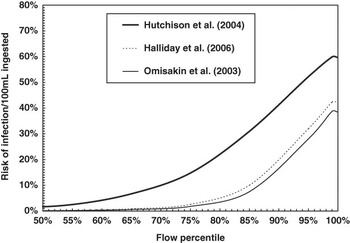
Figure 3 shows the probability of E. coli O157 infection from swimming at Irvine beach (assuming the arithmetic mean value of R) during summer as a function of the percentile of summer flow in the River Irvine. Risk of infection below the 80 percentile flow is negligible, but significant at higher flows (28% to 52% per bather at 95 percentile flow depending on the dataset used). Table 5 summarises the predicted annual infection rate per 100 000 head of population per year for both the NE private water supply case and the SW bathing waters case, compared with the observed incidence of E. coli O157 infection in the human population. For the NE PWS, use of the log-normal probability distribution for R NE (assumption (A) in Material and methods) gives larger than observed human infection incidence, although for the Halliday dataset, differences were small. Using the geometric mean values for R NE (assumption (B) in Material and methods) gives predictions of the same magnitude as observed, for the Halliday and Omisakin datasets, but there is an over-prediction with the Hutchison dataset. Using the arithmetic mean (assumption (C) in Material and methods) gives very large discrepancies with observations. The results are not very sensitive to the weighting of the PWS data according to the size of the supply.
Probability of infection by Escherichia coli O157 per 100 ml of water ingested while swimming at Irvine beach, Ayrshire, as a function of mean 1989–2001 summer flow percentile. Curves presented use arithmetic mean values of the ratio of E. coli O157/total E. coli content of faecal inputs from three literature sources.

Predicted annual infection rate per 100 000 head of population associated with (a) Aberdeenshire private water supplies (NE) and (b) bathing in Ayrshire (SW)

NE = North-East; SW = South-West; PWS = private water supplies.
Mixing assumptions for E. coli O157 inputs: (A) = no mixing (uses log-normal probability distribution of faecal E. coli O157 content); (B) = geometric mean; (C) = arithmetic mean. *The arithmetic mean E. coli O157 counts for positive animals in the Hutchison et al. (Reference Hutchison, Walters, Avery, Synge and Moore2004) study are more than the assumed total E. coli, so a ratio of arithmetic mean E. coli O157/total E. coli = 1 has been assumed for these calculations.
For SW bathing waters, the log-normal distribution for R sw (assumption (A)) derived from the Hutchison dataset gives higher incidence than observed, but both the log-normal and the geometric mean assumptions for the Halliday and Omisakin datasets give incidences close to observed. The arithmetic mean value gives much higher incidence than observed for all datasets.
Discussion
The risk-assessment results suggest that animals shedding high counts of E. coli O157 do pose a significant threat to human health via both waterborne routes, and that there is a higher risk per 100 000 population from NE PWS than from SW bathing waters.
Role of mixing
However, the appropriate mixing assumptions may be very different for the two cases, and since there are a number of different components to the risk of infection besides the waterborne route, including direct contact with animal faeces, person-to-person contact and foodborne infection (Strachan et al., Reference Strachan, Dunn, Locking, Reid and Ogden2006), we would expect to see lower predicted infection risk than observed, given that our calculations do not take these sources into account. Although mixing efficiencies for neither case are available, one might a priori expect the arithmetic mean of the E. coli O157 content of faecal material (assumption C, complete mixing), to describe the frequency distribution of R at least for the bathing water case, but this assumption led to predicted risks of infection much higher than observed data. Systematically high predictions of population risk, using an arithmetic mean estimate of dose, are to be expected where a concave dose–response curve occurs and mixing is incomplete. Crump (Reference Crump1998) and Strachan et al. (Reference Strachan, Dunn, Locking, Reid and Ogden2006) found that incorporating both variability and uncertainty in the dose–response model reduced the number of predicted infections.
Our results therefore suggest that mixing is incomplete at the scales of both PWS protection zones and river catchments discharging near coastal bathing waters. Clearly a better understanding of the amount of mixing of pools of E. coli O157 from different animals in the environment is needed. Strachan et al. (Reference Strachan, Dunn, Locking, Reid and Ogden2006) used a Markov chain Monte Carlo method to predict intake by sampling appropriate probability distributions for the parameters in the existing model. Using the probability distributions from individual faecal pat samples (assumption (A)) reduced predicted infection risk markedly. This might be appropriate if strong and permanent clumping of cells in faecal flocs during transport took place, so that each daily intake of water could be linked to an individual faecal pat, but infection rates were still larger than expected. Coleman and Marks (Reference Coleman and Marks2000) note that sublinear or convex curves may be more appropriate where clumping or quorum sensing of bacteria occur. Teunis et al. (Reference Teunis, Ogden and Strachan2008) found that heterogeneity considerably influences the shape of the dose–response relationship and increases uncertainty in predicted risk. The geometric mean assumption (B) provides the best agreement with observed incidence, but the physical significance of this assumption is unclear.
Other sources of bias and uncertainty
(a) Uncertainty in the appropriate values for the Beta-Poisson model parameters. This arises because of the paucity of data points (n = 8) in the curve fitting exercise carried out by Strachan et al. (Reference Strachan, Doyle, Kasugac, Rotariu and Ogden2005). These data should be further analysed, with appropriate weighting given according to sample size and uncertainty of response for each outbreak, and consideration of the expected form of the dose–response curve.
(b) Topp et al. (Reference Topp, Welsh, Tien, Dang, Lazarovits, Conn and Zhu2003) found considerable strain-dependent variation in survival of E. coli in soils and manures. If survival of E. coli O157 in the soil and water environments were poorer than for the whole E. coli population, it would affect the value of R used to determine the dose received for both bathers and drinkers. Mubiru et al. (Reference Mubiru, Coyne and Grove2000) found that E. coli O157:H7 survival could be modelled in the same way as non-pathogenic E. coli, but it had a slightly higher mortality rate.
(c) Beach use as a function of river flow conditions has not been considered. The SEERAD (2004) survey was biased in favour of days with expected high usage, whereas it is days with high river flow (and probably low usage because of poor weather) that constitute the higher risk. The adoption of signage, on bathing beaches, to warn against swimming on high-risk days has probably further reduced the risk of infection (SEPA, 2002).
(d) Estimates of R SW strongly affect the estimation of risk from the PWS samples. It is likely that the total E. coli counts in faeces from animals shedding large numbers of E. coli O157 are also higher. None of the studies used measured total E. coli as well as E. coli O157, and this should be introduced into all epidemiological studies of pathogen strains, so that linkage with the much wider datasets for commensal E. coli or faecal coliforms can be done.
(e) Reduction in infectivity of E. coli O157 may occur in samples that have been exposed to the soil and water environment, compared to fresh material. The dose–response curve of Strachan et al. (Reference Strachan, Doyle, Kasugac, Rotariu and Ogden2005)is based on outbreak data for food and contact pathways as well as water, and the cells transmitted by these routes may be more viable. Another study, using rabbits (Haas et al., Reference Haas, Thayyar-Madabusi, Rose and Gerba2000), gave much higher infective doses. Infection of the human host by E. coli O157 requires the formation of attaching and effacing lesions in a complex sequence of interactions involving the bacterial protein, initimin, a translocated receptor, and eukaryote actin pedestals. The early stages of attachment are much less specific, and the various diarrheagenic strains of E. coli may involve intimin attachment to nucleolin in host cells, fimbrial adhesions such as bundle-forming pili and long polar fimbriae, as well as agglutinating adhesions and the formation of mucosal biofilms (Torres et al., Reference Torres, Zhou and Kaper2005). It is likely that both stages of attachment are affected by exposure to environmental colloids such as clay minerals and colloidal organic matter, which may attach to the bacterial cell surface, affecting the ability of the organism to re-infect.
(f) The presence of acquired immunity (e.g. Soderhall et al., Reference Soderhall, Normark, Ishikawa, Karlsson, Teneberg, Winberg and Mollby1997; Frost et al., Reference Frost, Roberts, Kunde, Craun, Tollestrup, Harter and Muller2005) in rural populations is relevant to the comparison of risk of infection from bathing waters and PWS. This would be expected to reduce infection risk for people drinking private water but not for bathers – because the bathing cohort would have a higher proportion of children and city dwellers that are unlikely to have been exposed to E. coli O157 previously.
Approaches to mitigation
The mitigation of this threat can potentially be achieved by increasing the approach to storage of manures on the farm (e.g., by composting and improved slurry storage), by minimising livestock access to watercourses and by the use of farm ponds to promote retention and UV-assisted die-off of pathogens. These can potentially be incorporated into a quantitative risk-assessment framework as described above.
Storage method
The method of storage has a strong effect on survival time. Nicholson et al. (Reference Nicholson, Groves and Chambers2005) found that E. coli and Salmonella survived for long periods (93 days) in slurry at 2% dry matter, but were undetectable at 4 and 8 days, respectively, in unturned cattle manure. Campylobacter disappeared more quickly. However, the value of the disappearance time is highly dependent on the initial inoculum and detection limits, so although this information is useful for comparing treatments, the absolute disappearance time should not be relied on for assessing the sanitary condition of wastes. Larney et al. (Reference Larney, Yanke, Miller and McAllister2003) investigated the effect of composting and found that beef cattle manure composted with either straw or woodchip bedding showed a 6 log cycle reduction in E. coli content (from 7.57 to 1.24 colony-forming units (cfu)/g dry weight (DW) manure) over 14 days. The standard for compost used in Canada is 103 cfu/g DW; hence, this treatment was sufficient to achieve good sanitary conditions. Hutchison et al. (Reference Hutchison, Walters, Avery, Synge and Moore2004) found that the decimal reduction time for pathogens decreased markedly for inoculated manures left at the surface, compared to those incorporated into the soil. This occurred in both summer and winter, and they conclude that leaving the manure at the surface is a good way of reducing the risk posed. However, this work and the study of Nicholson et al. (Reference Nicholson, Groves and Chambers2005) both use inoculated pathogens, and these may be more susceptible to inactivation than those present in the manures naturally. Moreover, manure at the surface of the soil is more susceptible to surface runoff.
Protection of watercourses
A quantitative assessment of mitigation measures (principally stream-bank fencing), designed to reduce faecal coliform fluxes at the catchment scale, commenced in the Brighouse Bay catchment in Scotland in the 2003 bathing season (Kay et al., Reference Kay, Aitken, Crowther, Dickson, Edwards, Francis, Hopkinds, Jeffrey, Kay, McDonald, McDonald, Stapleton, Watkins, Wilkinson and Wyer2007). This study showed that fencing streams to produce a vegetated riparian zone and prevent stock access can have an effect in reducing faecal coliform fluxes to bathing waters, by between 66% and 81% at high flow. The improvements observed were not, however, sufficient to allow observed bathing water quality to comply with EU guidelines or mandatory standards. Others have shown buffer strips along field margins to be effective at mitigating faecal microbial pollution (Tate et al., Reference Tate, Atwill, Bartolomew and Nader2006).
Use of farm ponds
In a farm scale study in SW Scotland, Vinten et al. (Reference Vinten, Lewis, McGechan, Duncan, Aitken, Hill and Crawford2004) estimated that farm faecal coliform loads likely to cause bathing water failure were 8.4 × 10⁸ cfu/ha per day (guideline standards) and 1.7 × 10¹⁰ cfu/ha per day (mandatory standards). In 2005, the guideline exceedance risk (43%) was associated equally with both field and steading sources, whereas the mandatory exceedance risk (11%) was mainly due to steading sources. The pond/wetland below the farm reduced these exceedance risks to 20% and <1%, respectively, and functioned well at high flows, but it was, occasionally, a source of faecal streptococci at high flows.
Conclusion
The risk analysis has shown significant risk of human infection by E. coli O157 arising from both bathing water use in SW Scotland and PWS use in NE Scotland. In this study, we have obtained deterministic estimates of risk of infection. Predicted risks are very sensitive to mixing assumptions, but generally higher than the observed incidence of E. coli O157. The reasons for this may include bias and uncertainty in die-off kinetics, E. coli O157/total E. coli ratios, mixing rates and the potential infectivity of environmentally exposed pathogens. Further work will consider both the predicted variability and uncertainty in the number of predicted cases. This can be done using a Monte Carlo model by sampling appropriate probability distributions for the parameters in the existing model (e.g. Strachan et al., Reference Strachan, Dunn, Locking, Reid and Ogden2006). This will yield an output distribution for predicted infection risks, giving appropriate confidence intervals.
Potential approaches to mitigation of the risk from farm zoonoses infecting humans by the water route include improved methods and time of storage of wastes on farm, use of fencing to protect watercourses and use of farm ponds to collect lightly contaminated discharges at high flows. Recent farm scale studies have identified benchmark levels of mitigation associated with a range of 44 practical measures, many of which have an impact on faecal pollution (e.g. Dickson et al., Reference Dickson, Edwards, Jeffrey, Merrilees and Kay2005; Cuttle et al., Reference Cuttle, Macleod, Chadwick, Scholefield, Haygarth, Newell-Price, Harris, Shepherd, Chambers and Humphrey2007; Vinten et al., Reference Vinten, Sym, Avdic, Crawford, Duncan and Merrilees2008). Follow-up work should also explore the effects of the various mitigation strategies across appropriate regions of Scotland to predict the effect on infection risks, in conjunction with cost benefit analysis.
Acknowledgements
We thank the Scottish Government Rural Environment and Rural Affairs Department for funding the study.