Introduction
How have women contributed to the history of US invention? Answering this question requires having accurate data on inventions by women, but these data are difficult to construct. Our most common source of data on inventions, the patent record, does not contain information on inventors’ gender; instead, US patents only contain each inventor’s name and location of residence. Any attempt to quantify patenting by women must rely on this information to infer gender. While seemingly simple, making these inferences requires researchers to make several non-trivial choices that can dramatically affect their conclusions. In this article, we discuss these choices, compare several different methods to determine inventors’ gender in patent data covering 1845–1924, and discuss how these different methods shape our conclusions about the contributions of women inventors in history. Using two automated methods to infer gender, we identify many more patents by women inventors than have been found in prior historical studies, in some cases almost 100 percent more patents. We then use these automated methods to produce a set of stylized facts on the characteristics of patents and inventors by gender and over time.
Understanding the role of women inventors has long been of interest to policymakers, evidenced by official studies both recent (Pairolero et al. Reference Pairolero, Toole, Pappas, De Grazia and Teodorescu2025; United States Patent and Trademark Office 1990, 1999, 2019) and historical (Rossman Reference Rossman1927; United States Patent and Trademark Office 1888, 1892, 1895). These official reports, along with numerous academic studies (Ding et al. Reference Ding, Murray and Stuart2006; Giczy et al. Reference Giczy, Pairolero and Toole2024; Kahler Reference Kahler2011; Marx Reference Marx2024; Whittington and Smith-Doerr Reference Whittington and Smith-Doerr2008), rely on inventors’ reported first names to determine gender.Footnote 1
This seemingly straightforward exercise involves several choices that researchers must make that can substantially affect outcomes. First, how should a gender be assigned to each name? Researchers typically use other sources that contain genders for each first name, such as the population census, to assign a gender probability to each name. Because the probability that a person with a particular name is a woman changes over time and space, we find that using sources of names from times that are distant from the filing date of the patent can lead to substantial differences in the estimated share of patents from women.
A second question is what “counts” as a valid name. For example, should a researcher attempt to assign a gender when an inventor only reports a first initial instead of their full first name, given that initials are much less informative about gender than the full name? A given first name rarely belongs to only women or only men, and so a related question is how to draw conclusions about gender when the first name is not perfectly informative. We show how the share of patents by women inventors changes when we count an inventor as being a woman if the probability that a person with the same first name is a woman exceeds various threshold values, from 25 percent to 95 percent. We also assign an “expected” gender to each inventor equal to the probability that a person with that first name is a woman and calculate the share of patents with women inventors when summing over those probabilities. Our conclusions about patenting by women are sensitive to these seemingly innocuous choices about how to count the first names of women, in some years changing our calculations of the share of patents by women inventors by a factor of four.
A second approach to determining an inventor’s gender is to link patentee information – names and locations of residence – to a comprehensive source of individuals in a population, most commonly a population census (Akcigit et al. Reference Akcigit, Grigsby and Nicholas2017; Sarada et al. Reference Sarada, Andrews and Ziebarth2019).Footnote 2 These automated linking procedures also involve several choices by researchers: what names should be used when linking to the census (and in particular, how to handle inventors who only report first initials); what counts as a match between a patent record and a census record; and how to handle cases of non-unique matches?
While determining an inventor’s gender using either first names or census linking can and has been done “by hand,” the automated methods we describe in this article have two advantages. The first is simply that they can be done at a scale unavailable to earlier work (e.g., Schmookler Reference Schmookler1957; Sokoloff Reference Sokoloff1988; Sokoloff and Khan Reference Sokoloff and Zorina Khan1990; Khan and Sokoloff Reference Khan and Sokoloff1993). Indeed, our automated methods uncover a larger number of patents by women inventors than were found in the most comprehensive studies yet conducted (Reference JonesJones 1962; Khan Reference Khan1996; Merritt Reference Merritt1991; Rossman Reference Rossman1927; United States Patent and Trademark Office 1895). Second, automated methods require researchers to be explicit about the choices they make to determine inventors’ gender, as these choices can have significant implications for the number and share of patents attributed to women inventors.
Using our preferred set of choices to determine gender, we show that both the first name and census-linking approaches produce similar results about the evolution of the number and share of patents by women inventors. But when we check whether the two approaches draw the same conclusion about the gender of individual patentees, we find that they reach opposite conclusions a non-negligible fraction of the time; about 35 percent of the inventors classified as women with the first name approach are classified as men using the census-linked approach, while about 16 percent of the inventors classified as women with the census-linked approach are classified as men using the first name approach. Thus, whether or not one’s results will be sensitive to the method of inferring gender depends on whether one is interested in describing broad patterns or in leveraging the gender of individual patentees. In general, we recommend that researchers ensure that their results are robust to multiple methods of inferring gender, especially in contexts when the two methods tend to give different predictions about inventors’ genders.
We then investigate how patents by women inventors differ from patents by men inventors, using the automated methods to infer gender and the richness of the patent- and inventor-level data to produce a new set of stylized facts. We find that women are more likely to patent in “domestic” technologies than are men, namely those in technology classes related to human necessities (which includes technologies related to foodstuffs, apparel, and hygiene) and textiles (which includes technologies related to sewing, knitting, and laundering), although less than half of all patents by women are in those two classes over our entire sample period. Women and men patent in chemistry and physics at comparable rates. Even though women tend to produce different technologies than men, we find that they produce “breakthrough inventions” (Kelly et al. Reference Kelly, Papanikolaou, Seru and Taddy2021) at nearly identical rates. Finally, we show that patents by women are less likely to be assigned at the time they are issued than patents by men, suggesting both that women are less likely to be employees when they invent and perhaps that they are less likely to quickly commercialize their inventions. While scholars have documented similar facts about technology classes (Akcigit et al. Reference Akcigit, Grigsby and Nicholas2017; Gozen 2024; Khan 1996, 2000) and breakthrough inventions (Gozen Reference Gozen2024), as well as providing qualitative historical studies of patenting by women (Macdonald Reference Macdonald1992; Pilato Reference Pilato2000; Vare and Ptacek Reference Vare and Ptacek1988), to the best of our knowledge we are the first to document these patterns with the near-universe of patentees and automated methodologies to identify gender.
As a final exercise, we take advantage of the fact that, when linking inventors to the census, we obtain information on many demographic characteristics in addition to gender. We show how women and men inventors differ along various dimensions. Non-white inventors make up a larger share of patents by women than they do of patents by men. In the Supplementary material, we also find that women inventors are less likely to be in the labor force, are more likely to be unmarried or widowed, are less likely to have children living in the household, and tend to be younger than men inventors.
While our work provides the most accurate count of patents by women and highlights how this count varies with researchers’ choices, it is worth noting the contributions of women inventors that are not captured in our analysis. In several cases, women were known to patent under their husbands’ names; Macdonald (Reference Macdonald1992: xix–xx) provides multiple examples, although in most cases these inventors are impossible to identify without detailed biographical data.Footnote 3 In other cases, inventors may have intentionally reported their names to the Patent Office in such a way as to appear as men, for instance, by reporting “Christine” as “Chris” or by using a pseudonym; this phenomenon, known as passing, makes it difficult to link inventors to other sources and can give misleading conclusions based on recorded first names (Swanson Reference Swanson2022). Finally, patent law may be structured in such a way as to obscure the contributions of women inventors. This could occur because, for instance, at a time when most women were not involved in the labor market outside the home, improvements in many domestic activities were not considered patentable subject matter (Burk Reference Burk2011; Swanson Reference Swanson2015). These considerations imply that our results are likely an underestimate of the contributions of women to the history of American invention.
Patent data
We use the Comprehensive Universe of US Patents (CUSP; Berkes Reference Berkes2018) as our source of historical patent data. Several large-scale historical patent datasets are available for researchers. After comparing several of the most common along many dimensions, Andrews (Reference Andrews2021: 24) concludes that in most contexts “the CUSP is currently the gold standard both in terms of completeness and scope of the types of patent information it contains.” In particular, the CUSP has most accurately isolated two pieces of information necessary to determine inventors’ demographic information: the patentees’ name and location of residence. While we use the CUSP data for the results below, we stress that the issues with identifying inventors’ gender will be common to any historical patent dataset containing inventors’ names.
Both of our methods of inferring inventors’ gender – using the gender probabilities of the inventors’ first name and linking inventors to US census records – require accurate identification of each inventor’s name. Inventors’ names appear at three locations in a patent: in the header at the top of the first page, in the first sentence that declares who the inventor is and what they have invented, and at the bottom of the patent when they attest to the accuracy of the contained information. To construct the CUSP, optical character recognition (OCR) algorithms are run on high-quality scans of the historical patent documents, and then the page structure is reconstructed so that the inventors’ name is parsed from one of these locations. Patents may have more than one inventor. In these cases when a patent has M inventors, we assign a weight of
 $\frac{1}{M}$
to each inventor when calculating the number of patents with inventors of a particular characteristic.Footnote
4
In addition to the inventor’s name, it is important to parse the inventor’s location. This is true even when using gender probabilities of first names to determine gender, since the gender probability of each name may vary geographically. When linking inventors from the patent records to the census, the inventors’ location is used in addition to their names to find candidate matches. One challenge with patent data is that there is nothing to discipline what location an inventor reports on their patent. For instance, an inventor may report their location as “Charlestown, MA” even after Charlestown was annexed by the city of Boston in 1874. Conversely, an inventor may report their location as “Boston, MA” even if they live in a nearby suburb, like Brookline. For this reason, the CUSP data assigns a latitude and longitude to each inventor’s location, rather than relying on their reported location name.Footnote 5 Since both methods of determining inventor gender use US censuses (either to infer genders for each first name or to link a patent record to a census record), we restrict attention to inventors who resided in the US.
For most of our results below, we plot time series showing how patenting by women inventors has changed for patents filed in different years. While a patent’s date of issuance is always reported in the patent’s header, issued patents did not report the patents’ filing dates prior to 1873. For patents issued before 1873, we assume that each patent underwent the same average examination lag as in 1873, approximately six months. Therefore, for patents issued before 1873, if a patent was issued after June, we assume that it was filed in the same calendar year; if the patent was issued in June or earlier, we assume it was filed in the previous calendar year. Results using issue dates are similar to our preferred results using filing dates and are available upon request.
Finally, for several results we include information on additional features of patents. We incorporate patent-level information from other sources by linking on the patent number.Footnote 6 Namely, we incorporate data on patents’ technology classifications from the USPTO’s PatentsView database (United States Patent and Trademark Office 2024), patent importance from Kelly et al. (Reference Kelly, Papanikolaou, Seru and Taddy2021), and assignment of patents from the CUSP data.
Methods to identify women inventors
Using inventors’ first names
The first method to infer an inventor’s gender uses the gender probability of the inventor’s first name. To implement this, researchers typically compare first names from the patent with first names from another source for which the probability that a particular first name belongs to each gender is known. However, this approach involves several choices by the researcher, each of which may affect conclusions about patenting by women.
The first choice a researcher must make is what to use as their source of data for which the gender probability of names is known. A standard approach is to use names from full-count population censuses, which are unclassified, transcribed by IPUMS and Ancestry.com, and hosted by the NBER. Because these population censuses contain first names along with each individual’s gender, it is possible to calculate the probability that a person with any given first name is a woman by dividing the number of women with that first name by the total number of people with that first name.
Even in this case, it is still necessary to identify the relevant population. For instance, one could define the population to be the set of names in each state in each decennial census; alternatively, one could aggregate names over all states in each decennial census, or aggregate names over all decennial censuses. In Figure 1 Panel (a), we plot the expected number of patents by women inventors using each of these choices, which we obtain by summing up the probability that a first name belongs to a woman for all inventors in our sample. In general, aggregating names across states or censuses means that more first names from patents will be found in the census, leading to a larger number of patents by women. A name may fail to appear in the census for the inventor’s own state but appear in another state or another census if the inventor moved between when their patent was filed and the census was enumerated, if people with their name were erroneously missed by the enumerator in a particular state and census, or if the name was transcribed with error in a particular state and census but was transcribed correctly in others. But names may have different probabilities of belonging to men and women depending on when and where the probability is calculated, and so aggregating over states or censuses raises the risk that the assigned gender probability will be incorrect. For example, the name “Andrea” is a name predominantly given to men in Italian cultures but predominantly given to women in Spanish cultures; if different regions of the US had different shares of people of Italian or Spanish ethnicity, then aggregating over these areas may provide inaccurate information about an inventor’s gender relative to using the name probability only from their own state.
The number and share of patents by women inventors when using various name sources to determine the gender of each name. Patents are weighted by the probability that the inventor’s name belongs to a woman.

Figure 1. Long description
Panel A: A line graph shows the number of patents filed by women inventors from 1840 to 1920. The x-axis represents the filing year, and the y-axis represents the number of patents. Multiple lines represent different data sources: Each State & Census, Each Census, All Censuses 1850-1920, and Social Security 2020 Births. The graph shows a general upward trend in the number of patents over time, with notable increases around the late 1800s and early 1900s. Panel B: Another line graph shows the share of patents with identifiable first names from 1840 to 1920. The x-axis represents the filing year, and the y-axis represents the share of patents. Multiple lines represent different data sources: Each State & Census, Each Census, All Censuses 1850-1920, and Social Security 2020 Births. The graph shows a gradual increase in the share of patents with identifiable first names over time, with a significant rise around the early 1900s.
To further illustrate the risks in calculating gender probabilities from populations that are more distant from the time and place of a particular patent, in Figure 1 we also plot results using names from the Social Security Administration for 2020. Since the popularity of names changes over time, some inventor names from the nineteenth century are not given to anyone born in 2020, and so the Social Security data assigns a gender to fewer inventors than do the contemporaneous censuses.
Figure 1 Panel (b) shows the share of patents with women inventors out of all patents for which we are able to locate the first name in another source.Footnote 7 As in Panel (a), we often find a larger share of patents by women inventors when aggregating names over geographic distances or time, suggesting regional and temporal variation in the gender probability of names. Using the 2020 Social Security names always predicts a larger share of patents from women inventors, and in many years, this difference is as large as two percentage points, almost doubling the share of patents by women inventors.Footnote 8 This is driven by the fact that several names that were fairly common names for men during the nineteenth century are now names predominantly given to women. For instance, the name “Leslie” is 14.5 times more likely to belong to a woman in 2020 than in the historical censuses; there are more than 3,000 patents by inventors named Leslie during our sample period. Several other names, including “Sidney”/“Sydney,” “August,” “Ira,” “Addison,” “Emery”/“Emory,” “Jules,” “Taylor,” “Morgan,” “Alva,” “Perry,” “Monroe,” “Charley,” and “Harley,” underwent substantial shifts in gender probability and accounted for more than a thousand patents each during our historical sample period. In light of this, our recommendation is to use a population of first names as close as possible to the time and place of the patent of interest.
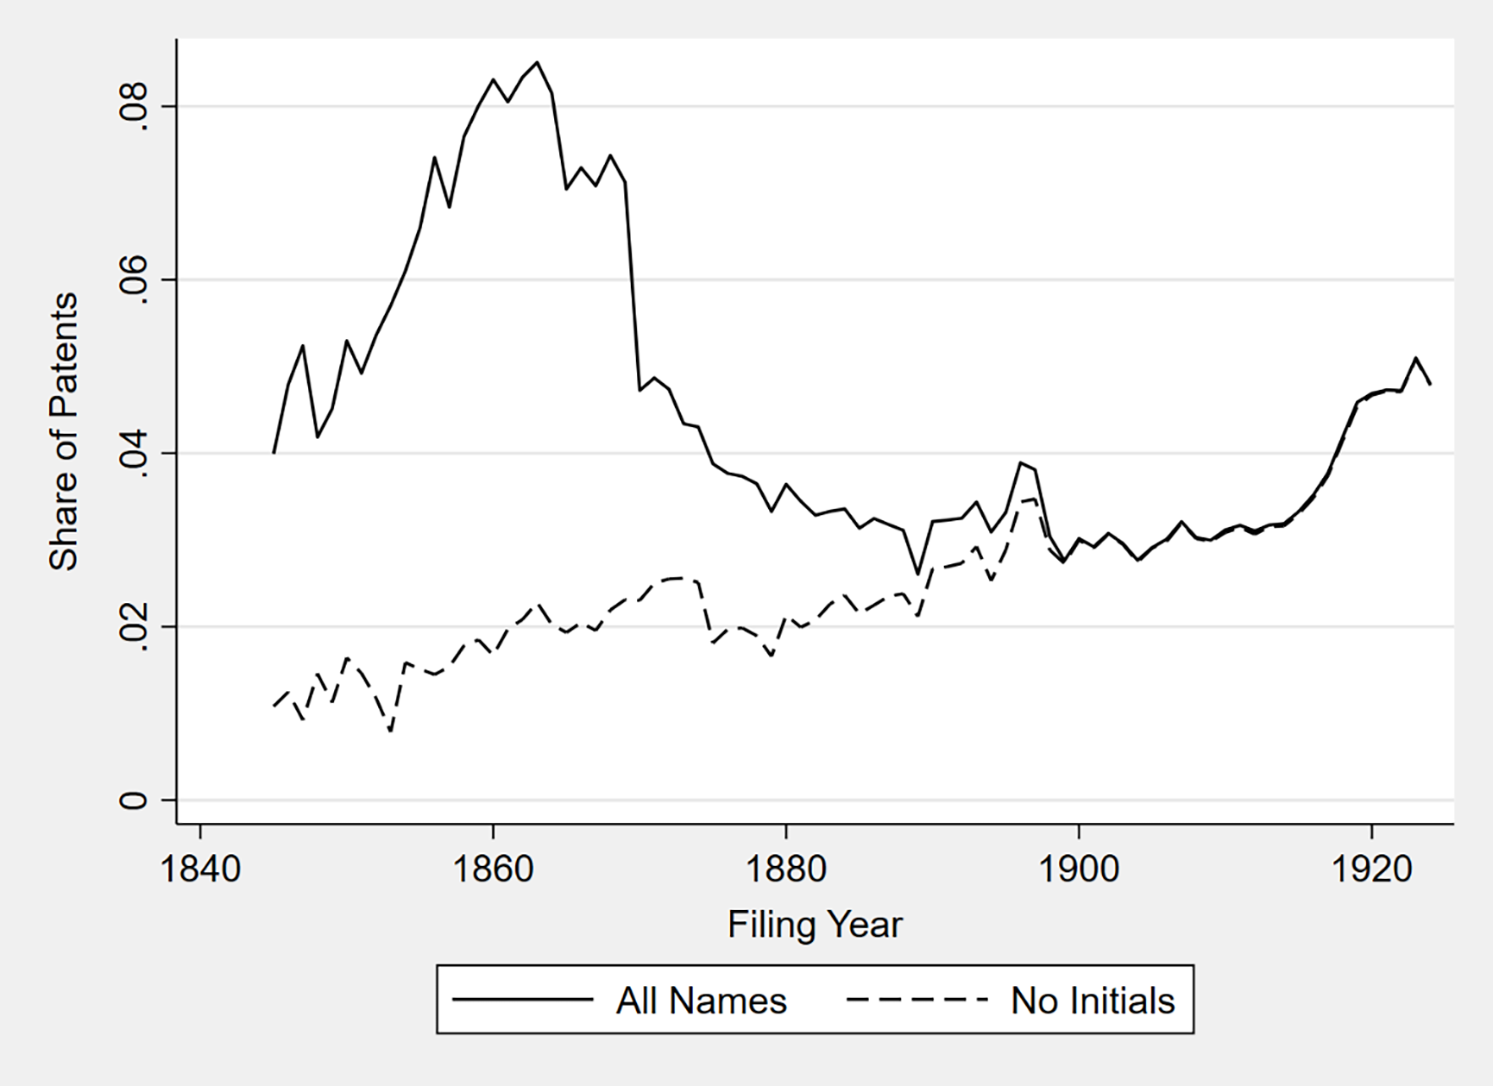
Even after selecting a source to calculate the gender probability of first names, the researcher must decide which set of names from that source make up the name population. In other words, what should “count” as a name? In the early years of our sample, inventors often report only their first initial in patent documents.Footnote 9 Should we use first initials when drawing inferences about first names? As we show in Figure A3 in Supplementary materials, about 17–35 percent of individuals who report only a first initial in the census are women. If the true share of patents from women inventors is less than 17–35 percent, as seems likely from our evidence using longer first names, then using first initials will mechanically inflate our calculation of the share of inventors that are women. In Figure 2, we show that the difference when including or excluding first initials can be substantial.Footnote 10 In fact, the handling of first initials is not only quantitatively important; it qualitatively alters the evolution of women’s share of patents over time. When we include inventors who list only a first initial, the share of patents by women inventors is highest around 1860 at more than 8 percent of all patents, then falls to about 3 percent by 1900 before climbing again to reach about 5 percent by the end of our sample period. When we discard inventors who only report a first initial, the share of patents by women inventors grows nearly monotonically over our sample period. By the turn of the twentieth century, our results are very similar regardless of whether or not we include first initials; as we show in Figure A5 in Supplementary materials, the share of individuals in the census who report only a first initial declines over the second half of the nineteenth century to less than 2 percent of the population by 1900. While women inventors may be more likely than men to list only their first initial, perhaps in an attempt to pass as men (Swanson Reference Swanson2022), the base level of patenting by men is so high relative to women that it is unlikely that almost a third of all inventors listing an initial are women.Footnote 11 Given how uninformative first initials are about inventors’ true gender, we recommend discarding inventors who only report their first initial.Footnote 12
The share of patents by women, including and excluding inventor names listed with initials only. Patents are weighted by the probability that the inventor’s name belongs to a woman.

One final choice that researchers must make is, given the gender probabilities of each first name, how to count the number of women inventors. In Figures 1 and 2, we calculate the expected number of patents by women inventors. This is the approach taken in, for instance, Berkes and Nencka (Reference Berkes and Nencka2026). An alternative approach is to count an inventor as a woman if the probability that the inventor’s first name belongs to a woman exceeds a certain threshold. This is the approach taken in Gozen (Reference Gozen2024) and Andrews (Reference Andrews2024), which count an inventor as a woman if at least 75 percent or 60 percent, respectively, of individuals with the same name in the same census are women.
Figure 3 plots the share of patents with women inventors using several different threshold values.Footnote 13 We first plot the share of patents with women inventors when counting an inventor as a woman if at least 25 percent of individuals within the same state and census year with the same first name are women; next we plot the share if at least 50 percent of individuals with the same name are women; then we plot the share if at least 75 percent with the same name are women; and finally we plot the most conservative case, in which an inventor is counted as a woman only if 95 percent with the same name are women. Unsurprisingly, the share of patents by women inventors declines as we use increasingly restrictive cutoffs.
The share of patents by women inventors based on varying probability thresholds for gender assignment using first names. Inventors are classified as women if the probability of being a woman in each state census exceeds a given cutoff. Expected patents are weighted by the probability that the inventor’s name belongs to a woman.

We also plot the expected share of patents with women inventors, calculated as the sum over all the inventors of the probability that a first name belongs to a woman divided by the total number of inventors (the same approach used in Figures 1 and 2). When using the expected share of patents with women inventors, we find a similar share of patents with women inventors as when using the very liberal 25 percent cutoff. In Figure A8 in Supplementary materials, we show that there are a large number of inventors whose first names have a small probability of belonging to women; summing over this large number of inventors, each with a small probability of being a woman, results in a large overall number of expected patents by women inventors.
Linking to census records
A second method links inventors’ identifiable information from each patent, namely their name and place of residence, to other data sources that contain demographic information, for instance the US decennial population censuses. For this exercise, we use the patent census links created by Enrico Berkes and Christian Fons-Rosen. Linking records involves several choices by the researcher, and different studies of census-linked inventors have created these links in different ways.Footnote 14 We describe the algorithm used to link patents to the census in Appendix B in Supplementary materials. Figure B1 in Supplementary materials shows the share of patents that have at least one inventor that we are able to link to the census. Figures B2 and B3 in Supplementary materials show the sensitivity of our results to altering the linking algorithm.
Census linking presents further challenges when inventors provide only their first initial. If the first name is only one letter, then our algorithm matches to all individuals within each search distance in the census with the same family name and first initial (so, for instance, an inventor named “J Smith” would match to “John Smith,” “Jane Smith,” “Jessica Smith,” etc., within a certain radius from their reported place of residence). As with the first name-based approach in Figure 2, including individuals who only report first initials greatly inflates the number and share of patents by women inventors; we show this in Figure B4 in Supplementary materials. We therefore again recommend against attempting to link inventors who only report their first initial.
Another concern with census-linkage approaches is the so-called “Jane Smith” problem. If an inventor has a common name, then that inventor is likely to match multiple records in the census. Which of these plausible matches actually belongs to the inventor? In Figure 4, we use the broadest set of candidate links and follow the procedure proposed in Sarada et al. (Reference Sarada, Andrews and Ziebarth2019) to construct bounds on the number of patents with women inventors. For each patent that links to multiple candidate individuals in the census, we calculate the expected number of women inventors by adding up the number of candidate matches that are women and dividing by the total number of candidate matches; the maximum number of women inventors, which is equal to one if any candidate match is a woman; and the minimum number of women inventors, which is equal to zero if any candidate match is a man. We also calculate the number of patents with women inventors when we restrict attention to the cases in which there is only one plausible match, so inventors match uniquely to the census. By construction, we identify the fewest patents with women inventors when examining only unique matches, followed by our minimum bound, the expected number of women inventors, and the maximum bound. In most cases, either all candidate matches are women or none of them are, and hence, the maximum and minimum number of patents by women tend to be similar. Differences occur, however, in the cases of androgynous names or in the cases when an inventor of one gender has a name commonly given to the other gender (and a common enough last name that there are multiple matches). We find broadly similar numbers and shares of patents when using the expected or minimum approaches; we also find similar shares of patents by women when using only inventors that match uniquely to the census. The maximum approach, however, finds a much larger number and share of patents by women in most years; in some years, the difference in shares is as large as three percentage points. Given the volatility when using maximums, we caution researchers against using this approach. In Figure B5 in Supplementary materials, we similarly plot these bounds for patents with inventors that are men.
The number and share of patents by women inventors based on different methods to handle inventor names that match multiple census records. Expected patents are weighted by the probability that the census match belongs to a woman.

Figure 4. Long description
Panel A: A line graph shows the number of patents by women inventors from 1840 to 1920. The x-axis represents the filing year, and the y-axis represents the number of patents. The graph includes multiple lines representing different methods to handle inventor names that match multiple census records: Max, Unique Matches, Expected, and Min. The number of patents increases over time, with notable peaks around 1900 and 1920. Panel B: Another line graph shows the share of census-linked patents by women inventors from 1840 to 1920. The x-axis represents the filing year, and the y-axis represents the share of patents. This graph also includes multiple lines representing different methods: Max, Unique Matches, Expected, and Min. The share of patents fluctuates over time, with peaks around 1860, 1880, and 1900.
Figure 4 plots maximum and minimum bounds for the number of patents by women inventors, but we can also use different probability thresholds as cutoffs to determine whether a particular inventor is a woman or not, as in Figure 3 when using the first name-based approach. More specifically, we consider an inventor to be a woman if a certain percentage of candidate links are women. We present results for the share of patents by women inventors in Figure 5 (with results for the number of patents by women inventors in Figure B6 in Supplementary materials), using the 25 percent, 50 percent, 75 percent, and 95 percent cutoffs used in Figure 3. Note that if a patentee matches to a unique individual in the census, that patentee will have either a 0 percent or 100 percent chance of being a woman, depending on the gender of the unique match. Differences across these cutoffs occur only when a patent matches to multiple individuals in the census. Because multiple matches are often the same gender, the differences between these various cutoffs are reasonably small, especially relative to the differences in Figure 3. In other words, the additional information provided by surnames and more fine-grained geographies in census records allow us to infer gender with more precision than when using first names alone.
The share of patents by women inventors based on varying probability thresholds for gender assignment using census links. Inventors are classified as women if the probability that a match in the census is a woman exceeds a given cutoff. Expected patents are weighted by the probability that the census match belongs to a woman.

Comparing first name-based and census-linked results
This section analyzes whether our conclusions about patenting by women are sensitive to the method used to determine gender. We begin by summarizing the results from the previous sections by plotting female patenting using both first names and census linking in the same plot. We show results in Figure 6. Panel (a) plots the total number of patents by women inventors using both methods. Panel (b) plots the share of patents by women inventors using both methods. For each panel, we show results using both the expected number of patents by women inventors and the 75 percent threshold probability to determine if an inventor is a woman.
Comparison of the first-name and census-linking methodologies, showing the number and share of patents by each method. Each panel shows results both when weighting by the probability that the inventor is a woman and when using a 75 percent threshold that the inventor is a woman.

Figure 6. Long description
Two line graphs depict the number and share of patents over time using different methodologies. Panel A: Number of Patents. The line graph shows the number of patents filed from 1840 to 1920. The x-axis represents the filing year, and the y-axis represents the number of patents. Four lines are plotted: solid line for Census-Linked Expected, dotted line for Census-Linked 75% Threshold, dashed line for First Names Expected, and dash-dotted line for First Names 75% Threshold. The number of patents increases over time, with noticeable rises around the late 1800s and early 1900s. Panel B: Share of Patents. The line graph shows the share of patents filed from 1840 to 1920. The x-axis represents the filing year, and the y-axis represents the share of patents. Four lines are plotted: solid line for Census-Linked Expected, dotted line for Census-Linked 75% Threshold, dashed line for First Names Expected, and dash-dotted line for First Names 75% Threshold. The share of patents fluctuates over time, with a general upward trend starting around the late 1800s.
In Panel (a), when using the expected number of patents by women, the first name method identifies a higher number of patents by women for nearly all years. This is not surprising, since the first name method only requires finding an inventor’s first name in the census, whereas the census-linkage method requires finding a similar first name, last name, and location. The fact that the first name method also finds a larger share of patents by women inventors for nearly all years, shown in Panel (b), is more surprising; while the first name method assigns a gender for more patents by women, it also assigns a gender to more patents by men, so it is ambiguous whether the first name-based or census-linked method would lead to a larger share of patents by women than the other.
When we use the 75 percent threshold to determine if an inventor is a woman in Panel (a), we see a different story. Now, both methods find a similar number of patents by women for most years, and between 1880 and 1900, the census-linked method actually finds a larger absolute number of patents by women. Only after the late 1910s does the first name method find a substantially larger number of patents by women inventors than the census-linked method. Panel (b) shows that, when using the 75 percent threshold, the census-linked method also attributes a slightly larger share of patents to women inventors for most years, although the difference is usually modest in magnitude.
Why are the results for the first name method so different when using the expected number of patents with women inventors versus using a 75 percent threshold relative to the census-linked method? Figures 3 and 6 collectively provide the answer. Figure 3 shows that there are a large number of first names that have a low (but non-zero) probability of belonging to women; summing up over this large number of patents that each has a low probability of belonging to a woman gives a much larger expected number of women inventors than one obtains when using the 75 percent threshold; in fact, the expected number of women inventors is closer to the number one would get using only a 25 percent threshold. Figure 6 shows that, when using the census-linked method, the expected number and the number using a 75 percent threshold produce very similar results because, conditional on matching to an individual in the census, most matches have the same gender. The first name method therefore seems to be more sensitive to how one actually counts women inventors.
This raises the question of whether it is better to use the expected number of patents by women inventors or to count women inventors using a threshold cutoff rule when using the first name method. We do not think our results point to one being clearly “better,” and the best approach likely depends on the circumstances. For example, in the next section, we compare our counts of women inventors to lists compiled by others; these other sources usually make a determination of the gender for each inventor (rather than assigning an expected gender), and so we use the 75 percent threshold rule to determine whether each inventor is a woman. Later, we use the expected number of patents by women inventors to make the case that, even when we use methods that deliver very different numbers of patents by women inventors, they show similar patterns about the characteristics of patents by women relative to patents by men.
Are the differences in Figure 6 due to the fact that different methods assign different genders to the same patents, or do the different methods identify the gender on different samples of patents? To shed light on this question, we next examine the patent numbers for which both methods are able to infer gender.
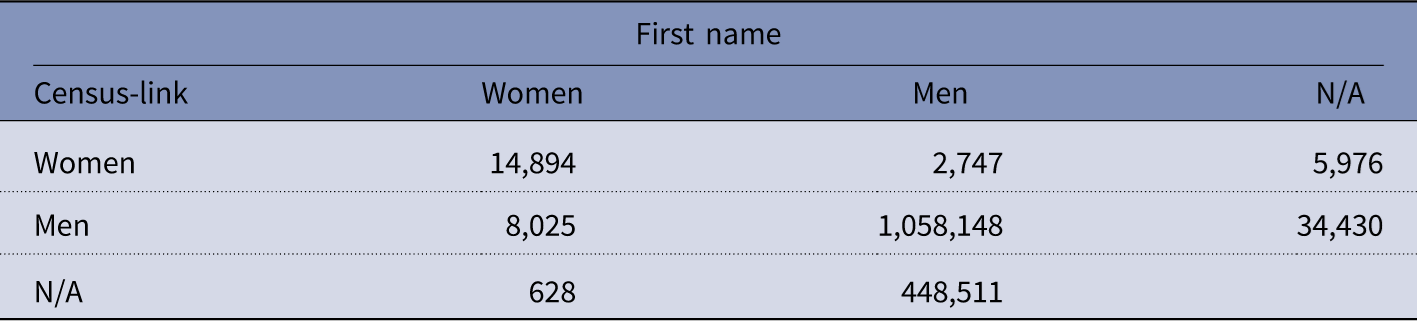
Table 1 uses the 75 percent threshold to assign a gender to each inventor and then checks how frequently the first name and census-linked methods make the same gender determination. The three columns list the number of patents for which we are able to identify a woman inventor, identify a man inventor, and are not able to identify gender using the first name method. The three rows do the same for the census-link method. For the vast majority of patents, we determine the inventor is a man using both methods. For 14,894 patents, we identify a woman inventor using both methods. There are 8,025 patents for which the first name method determines the inventor is a woman, while the census-link method determines the inventor is a man. Conversely, there are 2,747 patents for which the census-link method determines the inventor is a woman, while the first name method determines the inventor is a man.
Comparing the number of patents with women inventors using the first name and census-linked methods. Columns show the number of patents by gender using the first name method. Rows show the number of patents by gender using the census-linked method. “N/A” means the method is unable to determine an inventor’s gender. Inventors are classified as women if the probability that the inventor is a woman exceeds 75 percent.

Table 1. Long description
A table with four rows and three columns comparing the number of patents by gender using first name and census-linked methods. The columns are labeled Women, Men, and N/A. The rows are labeled Women, Men, and N/A. Row 1: Women, 14,894; Men, 2,747; N/A, 5,976. Row 2: Women, 8,025; Men, 1,058,148; N/A, 34,430. Row 3: Women, 628; Men, 448,511; N/A, 0.
We next consider why the two methods often reach different conclusions about an inventor’s gender. First, we stress that the set of women inventors using one method is not a proper subset of the set of women inventors found using the other method. There is a sense in which the census linking is more conservative, because it requires more information to be the same between patent and census records in order to determine gender. Any issue that causes an individual’s last name or location to be different between when a patent is filed and when the census is enumerated will cause the census-linking method to fail to find a match for that patentee. This issue is especially important when linking women, since in the US women tend to change their names after marriage. If a marriage occurs between when a patent is filed and a census, this will result in failure to find that inventor in the census. One final reason why the census may fail to identify a woman inventor is if the inventor patents under a pseudonym. As one example of this, aeronaut pioneer Mary Myers filed her patents on hot air balloon control systems using her performer name “Madame Carlotta” Myers (Macdonald Reference Macdonald1992: 157–59). Since “Carlotta Myers” is not the name of an actual person in the census, the census-linked approach is unable to find Myers’s patents. Notice that in this case, however, both Mary and Carlotta are predominantly women names, and so the first name approach would determine that Myers’s patents likely belonged to a woman inventor.
There are also, however, cases in which the census-linkage approach will identify patents by women inventors that are missed by the first name approach. One instance is when an inventor has an androgynous name. If an inventor has a name that is given to women less than 75 percent of the time, the first name-based approach will not assign this patent to a woman. With the census-linked approach, if all the individuals with this first and last name in a close geographic distance are women, then we determine that the inventor is a woman even if the name is commonly given to men in the rest of the state. Another instance in which the census-linkage approach may find a woman inventor while the first name approach does not is when OCR errors or typos occur in the inventor’s first name. The first name approach requires the inventor’s first name to match exactly to a first name in the census; conversely, because the census-linking approach uses last names and locations to further discipline candidate matches, our census-linking algorithm allows for a degree of fuzziness in the first name match.Footnote 15
We close this section by asking whether it is better to use the first name approach or the census-linked approach to determine an inventor’s gender. In light of the above discussion, it is clear that neither approach is unambiguously better in all circumstances. For some subsets of inventors, however, it may be clear which approach is preferable. For example, if an individual’s first name is fairly androgynous and so the first name is not especially predictive, but the individual matches to a unique individual in the census, then the census-linked approach would be more useful to determine that inventor’s gender. In Appendix C in Supplementary materials, we develop an algorithm that uses each approach in the contexts when it is likely to be the most predictive.Footnote 16 This “combined” approach is able to determine gender for a larger number of patents, since it uses the first name approach when the census-linked approach fails to determine gender, and vice versa. The “combined” approach finds that the share of patents by women inventors lies in between the shares found when using only the first name approach and only the census-linked approach.
Comparing automated methods to lists of women inventors compiled by others
While sometimes drawing different conclusions about the gender of a particular inventor, both of the automated methods we describe identify a larger number and share of patents by women inventors than are identified in any other large-scale study of which we are aware. Most historical sources conclude that women held about 1 percent of US patents through the middle of the twentieth century (Jones Reference Jones1962; Rossman Reference Rossman1927), only 50–65 percent of the share of patents by women inventors found using either of our automated methods.Footnote 17
The most comprehensive historical count of patents by women inventors of which we are aware was assembled by the USPTO in 1888, with updates added in 1892 and 1895 (United States Patent and Trademark Office 1888, 1892, 1895). Macdonald (Reference Macdonald1992: 141–42) provides extensive background on this 1888 PTO list. As she describes it, “Four clerks, who spent ten days and were paid about three hundred dollars to cull women’s names from the almost half a million patentees, relied on their sense of what sounded like women’s names. By comparing the official, cumulative 1888 list to annual lists, one can find a good many omissions, even when the inventors bore such obvious first names as Mary and Sarah. But one can only be grateful that this record, flawed though it is, exists.” [Emphasis in original.] Macdonald (Reference Macdonald1992: 412), citing Stanley (Reference Stanley and Wright1987), also identifies false positive patents in the PTO list, like those by Mildred Blakely, who, despite having a first name predominantly given to women, was a man. Like Macdonald, we are grateful that this record exists, as it provides a benchmark against which we can compare our automated methods. Two other more recent studies, Merritt (Reference Merritt1991) and Khan (Reference Khan1996), use the women inventors in the PTO list as the starting point and supplement with additional women inventors that they identify.
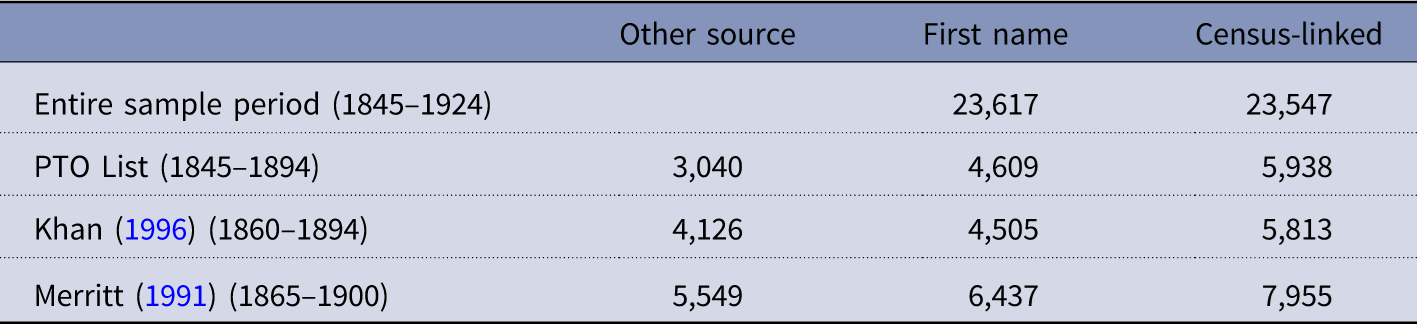
Table 2 compares the total number of patents with at least one woman inventor found in these prior sources to our automated methods. Row 1 shows the total number of patents with a woman inventor over our entire sample period of 1845–1924, Row 2 shows the number of patents from the time period covered by the PTO list, Row 3 shows the number of patents from the period covered by Khan (Reference Khan1996), and Row 4 shows the number of patents from the period covered by Merritt (Reference Merritt1991).Footnote 18 Column 1 shows the number of patents with at least one woman inventor from each prior source. Columns 2 and 3 show the total number of patents using the first name and census-linked methods, respectively, when using the 75 percent threshold to determine if an inventor is a woman over the same set of years.Footnote 19 We find 52–95 percent more patents by women inventors than were identified in the PTO list for the same set of years, 9–41 percent more patents by women inventors than in Khan (Reference Khan1996) for the same set of years, and 16–43 percent more patents by women inventors than were identified in Merritt (Reference Merritt1991) over the same set of years. The fact that our automated methods find that women inventors were responsible for an even larger share of US patents than previously recognized underscores research showing that the US patent system was highly democratic throughout history (Khan Reference Khan2005; Sokoloff and Khan Reference Sokoloff and Zorina Khan1990). In fact, one interpretation of our findings is that the patent system was substantially more democratic, than previously believed, at least when it comes to gender, with women accounting for up to 95 percent more patents than previously recognized, depending on the source and time period.
Comparing the number of patents with women inventors using automated methods to other sources. The first column reports the number of patents by women inventors reported in the source displayed in each row. The second and third columns report the number of patents by women inventors identified with the first name and census-linked methods, respectively. For the first name and census-linked methods, inventors are classified as women if the probability that the inventor is a woman exceeds 75 percent
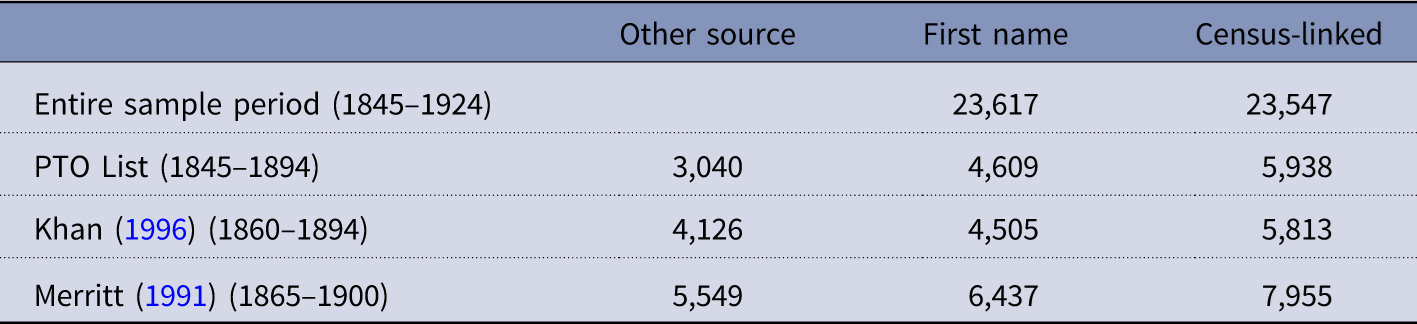
Table 2. Long description
The table has four rows and three columns. The columns are labeled ‘Other source’, ‘First name’, and ‘Census-linked’. The rows are labeled ‘Entire sample period (1845-1924)’, ‘PTO List (1845-1894)’, ‘Khan (1996) (1860-1894)’, and ‘Merritt (1991) (1865-1900)’. Row 1: Other source, 3040; First name, 23617; Census-linked, 23547. Row 2: Other source, 4609; First name, 23617; Census-linked, 23547. Row 3: Other source, 4126; First name, 4505; Census-linked, 5813. Row 4: Other source, 5549; First name, 6437; Census-linked, 7955.
As an additional exercise, we use the patent numbers in the published PTO list to see whether we make the same determinations about the gender of an inventor as the PTO when examining the same patents, similar to the exercise conducted in Table 1; we present these results in Table D1 in Supplementary materials. For the patents in the PTO list, our automated methods agree that inventors are women 77 percent of the time when using first names and 93 percent of the time when using the census-linked approach. But, as shown in Table 2, our methods also find many patents by women inventors that were overlooked in the PTO list, with the first name-based approach identifying about 52 percent more patents with a woman inventor than did the PTO clerks and the census-linked method identifying about 95 percent more patents with a woman inventor. For example, both the first name and the census-linked approach find Betsey Ann Worden’s “Improvement in Car-Couplings” (US Patent #126122), Ellen Mitcheson’s “Improvement in Mustache-Spoons” (US Patent #135141), Helen Blanchard’s “Improvement in Sewing-Machines” (US Patent #141987), Julia French’s “Improvement in Bedsteads” (US Patent #152357), or Myron Baxter’s “Spittoon-Cane” (US Patent #240806), all of which were missed in the PTO list. While many of these patents are for improvements in household items, some, such as the Worden’s improved car-couplings, represent technological advances that improved manufacturing or transportation; we further investigate the technologies of patents by women below.
We also use a second source to compare to our determinations about patenting by women: the list of women inventors found in the appendix of Macdonald (Reference Macdonald1992). In contrast to the PTO lists, this was not intended to be a comprehensive accounting of women inventors; instead, Macdonald lists all the women inventors that she discusses in her book. Because Macdonald has done the difficult biographical work of figuring out the backgrounds of all the inventors she reports, her list is very unlikely to contain false positive entries of patents erroneously attributed to women. Conditional on being able to infer gender with the automated method, the first name-based method identifies a woman inventor for 71 percent of the patents in the Macdonald list, while the census-linkage method identifies a woman inventor for 90 percent of the patents in the Macdonald list. While the Macdonald list likely contains no false-positive women inventors, this kind of detailed biographical work is difficult to conduct at scale, and so the Macdonald list contains more than an order of magnitude fewer patents by women inventors than do our automated methods. Because the Macdonald data contain so few inventors relative to the PTO list, Khan (Reference Khan1996), and Merritt (Reference Merritt1991), we do not include these results in Table 2. We provide more information on these patent-level comparisons to the PTO list and the Macdonald list in Table D2 in Supplementary materials.
Taken together, we view these results as suggesting that our automated methods are quite accurate and find the vast majority of patents by women that were identified in previous studies. Moreover, because these methods are automated, we are able to identify many more patents by women inventors that were missed in other sources.
Characteristics of patents by women inventors
This section explores differences in patent characteristics by women and men using first name and census-linkage methods to determine gender. While earlier sections highlighted varying patterns in the number and share of patents with women inventors, we demonstrate that both methods yield similar stylized facts about the types of patents women invent.
Technology classes
We first present the share of patents that fall into each first-level Cooperative Patent Classification (CPC) Code by gender. In Figure 7, we present the shares of patents in each of the eight first-level technology codes averaged over the entire sample period. Much of the prior literature finds that women tended to produce patents related to domestic activities or woman-focused fashions like corsets (Khan Reference Khan2000; Macdonald Reference Macdonald1992; Swanson Reference Swanson2011).Footnote 20 This is also consistent with a growing body of research on the direction of innovation that finds that individuals produce new ideas in the areas that they are most familiar with (Cao et al. Reference Cao, Koning and Nanda2021; Koning et al. Reference Koning, Samila and Ferguson2021; Michelman and Msall Reference Michelman and Msall2024; Truffa and Wong Reference Truffa and Wong2025). We show that, while women are more likely to patent in the CPC codes relating to “Human Necessities” (which includes foodstuffs, personal and domestic articles including apparel, hygiene, and games and amusement) than any other first-level CPC code, Human Necessities account for less than half of patents by women inventors.Footnote 21 Additionally, women and men produce a comparable fraction of patents in chemistry, physics, and electricity, similar to the findings in Gozen (Reference Gozen2024). Moreover, both the first name and census-linked methods yield similar results on average regarding the technology classes of inventions by gender. In Figure E1 in Supplementary materials, we plot time series of the shares of patents in each of the first-level CPC codes for both men and women.
The share of patents by gender and CPC code, using the first-name and census-linking methodology. Patents are weighted by the probability that the inventor is a woman.

Breakthrough patents
Even though women tend to patent in different technologies than men, they appear to produce important patents at a similar rate. We use data from Kelly et al. (Reference Kelly, Papanikolaou, Seru and Taddy2021) on breakthrough patents, which measure the textual similarity of each focal patent to patents that came before and after. Patents that are very different from patents that came before are highly novel, while patents that are very similar to technologies that come after are highly impactful. Kelly et al. (Reference Kelly, Papanikolaou, Seru and Taddy2021) define important innovations to be those that are both highly novel and impactful; they define patents in the top 10 percent of this importance measure as “breakthrough” patents. Women account for few breakthrough patents overall (shown in Figure E2 in Supplementary materials), which is unsurprising given that they produce relatively few patents compared to men. We show in Figure 8, however, that women and men produce breakthrough patents at a nearly identical rate.
The share of breakthrough patents (defined as in Kelly et al. Reference Kelly, Papanikolaou, Seru and Taddy2021) by gender, using both the first name and census-linking methodology. Patents are weighted by the probability that the inventor is a woman.

Assignment
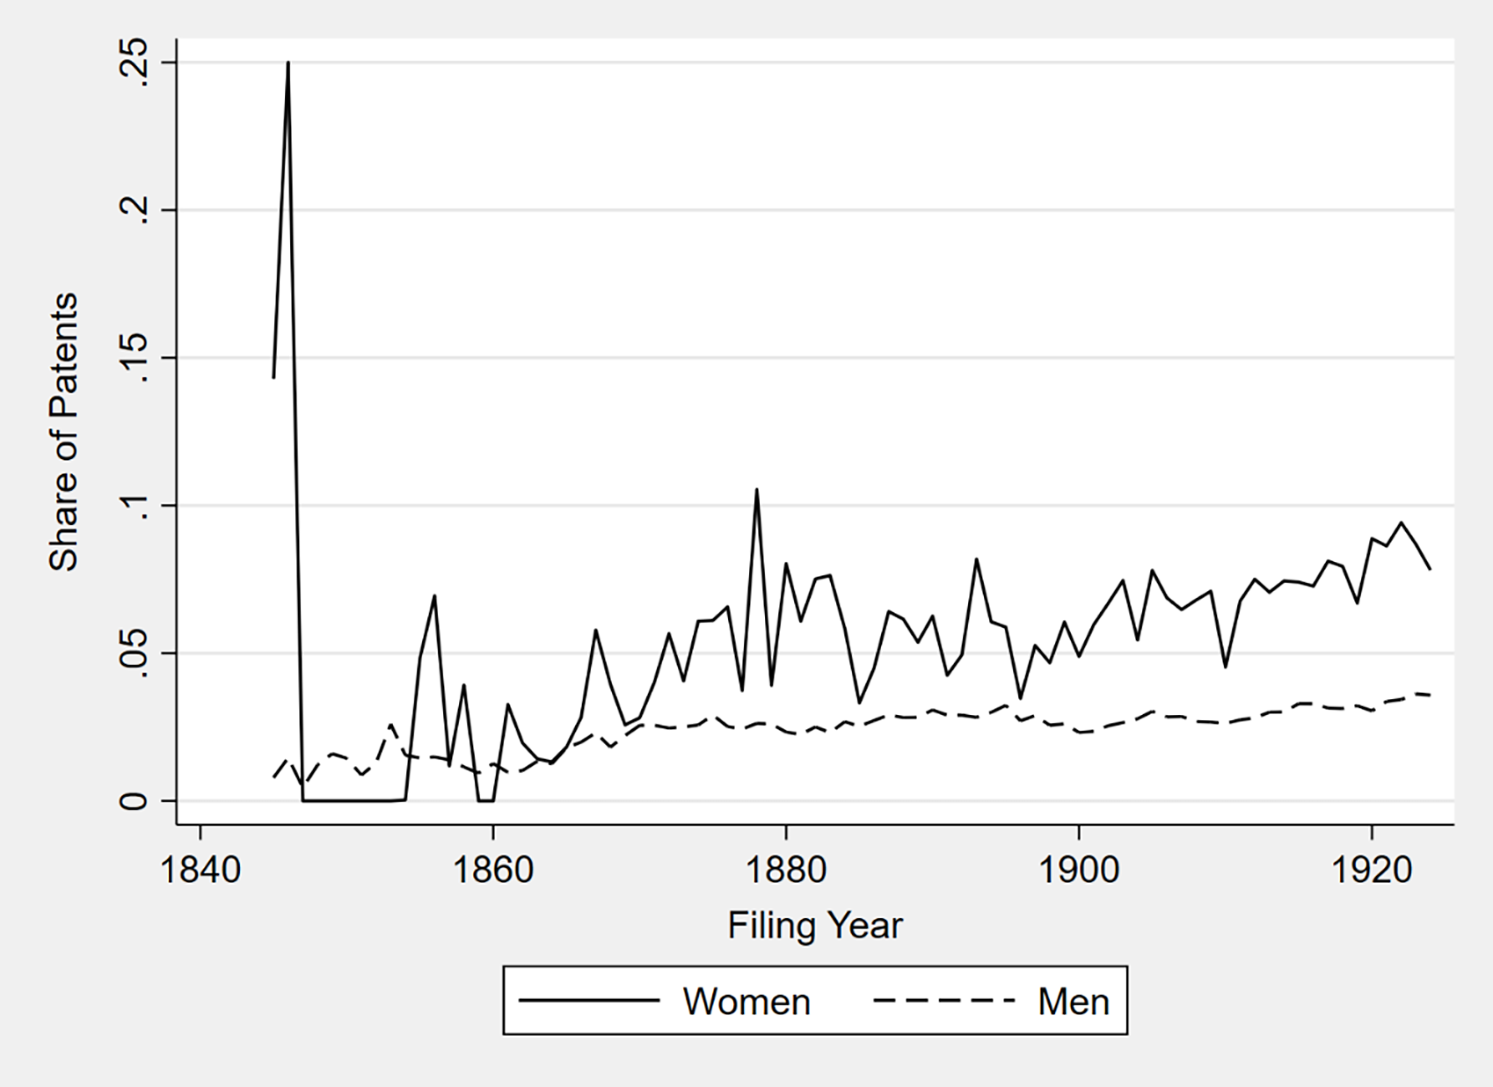
While women produce breakthrough patents at the same rates as men, they are less likely to place those inventions into the hands of others that can potentially commercialize these patents, at least at the time of issuance. The CUSP data contain information on whether or not a patent is assigned at the time the patent is issued. An assigned patent reflects both employment relationships between the inventor and the assignee (Fisk Reference Fisk1998; Lamoreaux and Sokoloff Reference Lamoreaux and Sokoloff2005; Nicholas Reference Nicholas2010) and the sale of a patent to another entity between the time the patent is filed and when it issues (Lamoreaux and Sokoloff Reference Lamoreaux and Sokoloff2001; Lamoreaux et al. Reference Lamoreaux, Sokoloff and Sutthiphisal2013). In Figure 9, we plot the share of patents by inventors of each gender that are assigned at issue. For both genders, assignment is rare throughout our sample, although it becomes increasingly common over time, with about 40 percent of patents invented by men being assigned at issuance in 1920. The share of patents by women that are assigned at issue is similar to that for men until about 1870, after which the rate for men continues to increase linearly, while for women it increases at a much lower rate. By 1920, only 20–30 percent of patents by women inventors are assigned at issue.Footnote 22
The share of assigned patents by gender, using the first name and census-linking methodology. Patents are weighted by the probability that the inventor is a woman.

Characteristics of women inventors
For the inventors linked to the US censuses, we can use the Ruggles et al. (Reference Ruggles, Flood, Sobek, Backman, Chen, Cooper, Richards, Rodgers and Schouweiler2024b) census data to learn additional demographic information about each linked inventor. In the interest of space, we focus on differences between men and women inventors on the basis of race. Results are presented in Figure 10. For every year after 1865, women inventors are more likely than men to be non-White. Since the end of the Civil War, the share of women inventors that are non-White has tended to increase from around 3 percent to almost 8 percent; the share of men that are non-White increased from about 3 percent to less than 5 percent over the same time period.Footnote 23 In Figure F3 in Supplementary materials, we plot the share of inventors of each gender that belong to other racial categories, namely Asian and American Indian and Alaskan Natives; these groups are very rare among inventors during our sample period.
The share of patents by non-White women. Patents are weighted by the probability that the census match belongs to a woman.

In Appendix F in Supplementary materials, we present several additional stylized facts on the difference between women and men inventors. Figure F4 in Supplementary materials shows that women inventors unsurprisingly have lower labor force participation rates than men inventors. With the exception of the earliest years in our sample, however, the labor force participation rate of women inventors is substantially higher than the overall labor force participation rate for women in the entire population until at least the 1920s (Costa Reference Costa2000).
Figure F5 in Supplementary materials plots patenting by men and women inventors by marital status as reported in the decennial censuses. Women are substantially less likely to be married than men, raising the possibility that it is difficult for women to both invent and take on traditional within-household gender roles of supporting a husband and (potentially) family, whereas inventing is more common among unmarried women because it is a way to earn income.
Figure F6 in Supplementary materials presents suggestive evidence that one reason women are more likely to patent when younger and unmarried is a child penalty, which reduces the ability of women to invent relative to men; women inventors are less likely than men to have a child in the household, and the difference is especially stark for young children.
Finally, in Figure F7 in Supplementary materials, we plot the average age of men and women inventors. For most years, men inventors are about 1–3 years older than women inventors on average. For both genders, the average age increases over the sample period.
Conclusion
US patent data do not provide information about gender. Consequently, researchers must make choices when inferring inventors’ gender. In this article, we show how conclusions about patenting by women are sensitive to these choices. In particular, we compare two automated methods for determining gender: using first names and linking to censuses. Both methods identify more patents by women inventors than have been identified in even the most comprehensive of previous studies, in some cases finding almost twice as many patents by women inventors than previously recognized.
Our results allow us to provide some advice on best practices for researchers attempting to infer inventors’ gender. For instance, when using first names to infer gender, we recommend using a source close in time and space to the patent data to assign a probability that each name belongs to a woman. We also recommend excluding patents that only report inventors’ first initials. In other cases, best practices are unclear. For instance, is it better to use first names to infer gender, or to link patents to the census? Should one assign an expectation of the gender for each inventor, or count an inventor as a woman if the probability is above a certain threshold? Broadly speaking, census-linking methods are less sensitive to these choices than the first name-based method, although challenges in record linkage often result in a smaller number of identifiable inventors with the census-linked approach. Overall, these methods produce similar aggregate patterns about the time series of patenting by women and about average technologies and quality of patents produced by women inventors. At the level of individual patents, however, the first name and census-linked methods often make different predictions about the gender of a particular inventor. Hence, in many settings such as conducting causal inference when the identifying variation comes from a relatively small number of patents, results may be very sensitive to the method used to infer gender. In cases where best practices are unclear, and especially when results are likely to be sensitive to these choices, we recommend that researchers ensure their conclusions are robust to multiple methods of inferring inventor gender.
Supplementary material
The supplementary material for this article can be found at https://doi.org/10.1017/ssh.2026.10146.