


Introduction
At the New York branch of Christie’s Auction House in December 2010, a Bronze Age Cycladic figurine, measuring less than 30 centimeters in height, sold for $16,882,500.Footnote 1 An exceptionally well-preserved example of the Late Spedos variety, this figurine has been attributed to the “Schuster Master,” an alleged ancient craftsman identified by Pat Getz-Preziosi on the basis of her highly contentious attribution analysis.Footnote 2 This analysis identified recurring technical and artistic traits across groups of figurines within the known corpus and assigned them to the hands of specific prehistoric “masters,” largely following Renaissance art-historical stylistic conventions.
According to the accompanying lot information, this figurine has a traceable and secure provenance: it was acquired sometime before 1965 and first appeared in the collection of Madame Marion Schuster in Lausanne. This figurine then changed hands to the British antiquities dealer Robin Symes in London during the 1990s, before being purchased by a “US private collection.” It was finally acquired by Phoenix Ancient Art in Geneva.Footnote 3 The fee commanded for this object is a record for Cycladic sculpture, and, prior to its sale, Christie’s international head of antiques, Max Bernheimer, stated: “It’s in pristine condition, it’s never been broken. The surface is absolutely pristine as well. It also has great provenance, which is what we are looking for in this market.”Footnote 4 If the statements and sentiment of Christie’s were to be taken at face value, then the sale of this figurine would paint a harmonious picture of commercial antiquity market practice: an ethically sourced, fully provenanced artifact, referred to in the correct archaeological terminology, being sold for a record fee by a proactively scrupulous international auction house.
However, upon closer inspection, not all is as legitimate as it would first seem. The “great provenance” confidently asserted by Bernheimer essentially begins in 1965 when it was acquired by Marion Schuster.Footnote 5 This is not an archaeological provenance; it is simply the first known modern collection in which the figurine appears and therefore provides no information as to where this figurine was originally found, when it was found, or any of the associated artifacts with which it was recovered. This figurine was acquired before 1965, and only a handful of published and legitimate Cycladic excavations took place before that date,Footnote 6 none of which can be accredited as the source of this figurine. Additionally, due to the proliferation of forgeries, endemic throughout the 1950s and 1960s, significant doubts have been cast upon the authenticity of almost all unprovenanced Cycladic figurines,Footnote 7 with the most extreme estimates discounting entirely all figurines on the market after the year 1914.Footnote 8 In other words, while the “provenance” of this figurine may satisfy basic bureaucratic legal criteria, it is virtually certain to have been looted and could very possibly be a fake.
The attribution to a “master” is equally problematic. It is an outdated and archaeologically contested practice, which has been heavily criticized as an interpretative method constructed primarily upon looted figurines and modern forgeries.Footnote 9 It has also been decried as contributing to the value-laden terminology that increases the marketability of, and demand for, Cycladic figurines.Footnote 10 This issue feeds into a broader narrative that consistently defines these figurines as exalted works of art rather than as archaeological objects that functioned within a prehistoric culture.Footnote 11 Furthermore, the modern collector who is passingly mentioned in the provenance sequence, Robin Symes, is in fact a disgraced antiquities dealer, who was jailed in 2005 for contempt of court after lying about the proceeds of his business.Footnote 12 Symes was exposed in 2007 as being central to a substantial organized looting ring operating across Italy.Footnote 13 Later, it emerged that he had hidden 45 crates of illicitly sourced antiquities in a Geneva warehouse, which authorities believe are worth several hundreds of millions of pounds.Footnote 14
After the application of some basic scrutiny, then, it appears this ostensibly pristine example of antiquity market practice can be perceived for what it actually is: an archaeologically unprovenanced, possibly looted, and perhaps even forged artifact, which has been trafficked by a prominently known illicit antiquities dealer. Its descriptors are inaccurate, misleading, and outdated artistic terms employed for their ease in the purposes of marketing. It was sold by an auction house that, in all probability, was fully aware of the true circumstances surrounding the origins, acquisition, and trajectory of this object.Footnote 15 Several of the problems and malpractices inherent with the sale of this figurine, far from being isolated incidents, are in fact commonplace within the commercial antiquities market. Cycladic figurines are aspects of Aegean Bronze Age material culture that have been disproportionately devastated by illicit looting practices over the last 200 years, resulting in an irreparable loss of knowledge regarding Early Cycladic civilization and obfuscating any attempt to clearly determine the function of these objects in prehistory.Footnote 16
In response, there has been a considerable effort aimed at preventing the illicit flow of these figurines and regulating their subsequent sale on the international antiquities market. These measures range from legal initiatives to repatriate looted material,Footnote 17 programs of community education,Footnote 18 and published campaigns of scientific excavation designed to frame and articulate these figurines in their proper archaeological context.Footnote 19 Additionally, a series of international conventions have been implemented,Footnote 20 which prohibit the procurement and trade in illicitly sourced antiquities across the globe. Yet the sale of this “Schuster Master” by Christie’s in 2010 clearly demonstrates two critical factors: first, that in spite of the social and institutional weight to the contrary, Cycladic figurines remain a fundamentally threatened aspect of archaeological heritage and, second, that the international laws and protocols designed to protect antiquities are not having the practical and preventative effects they were designed to have. This issue begs the natural question, if all that has been attempted so far does not work, then what will solve the issue?
The problem of Cycladic looting
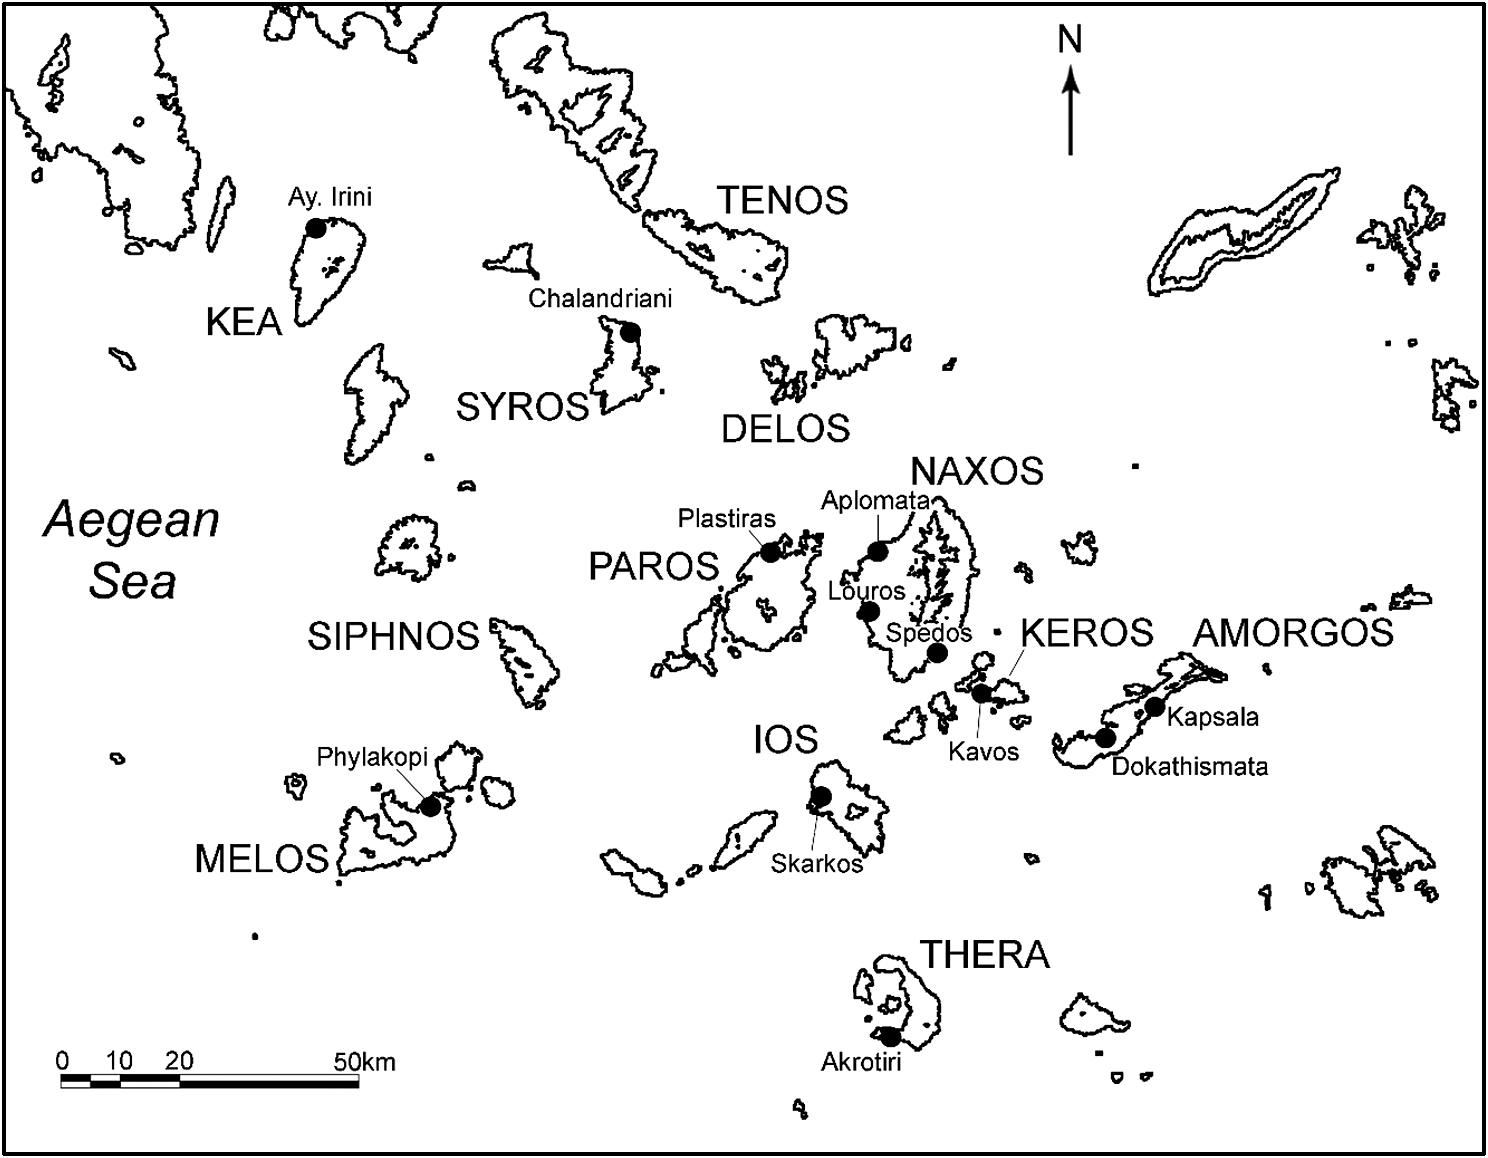
The looting of Cycladic archaeology has an extensive and varied history, and a full enumeration would add little to the present study. A very basic outline is that the earliest accounts appear in the late eighteenth century, when Italian travellers made diffuse reference to marble idoli and idoletti for sale on Naxos.Footnote 21 During the nineteenth century, the desire of antiquarians, private collectors, and European museums to acquire Cycladic figurines sustained a complex looting industry, which operated throughout the islands.Footnote 22 Destructions of Cycladic cemeteries were common during this period, with notable examples occurring at the cemeteries of Phylakopi on Melos and Chalandriani on Syros (see Figure 1).Footnote 23
A map of the Cyclades, showing the find spots of figurines from systematic excavations (courtesy of Yannis Galanakis).

While Cycladic figurines remained relatively unknown in the Western cultural mainstream during the nineteenth century, their discovery in the early twentieth century by Modernist artists such as Pablo Picasso, Constantin Brancusi, and Jacob Epstein as a source of creative inspiration led to a high demand flourishing on the international antiquities market.Footnote 24 This high demand was matched by equally high prices, and, as a result, looting boomed between the 1950s and 1970s to service this newly lucrative industry.Footnote 25
One of the most prominent material casualties of this period was the Early Cycladic Sanctuary at Dhaskalio Kavos on Keros, which was irreparably destroyed by illicit excavations.Footnote 26 During the Early Bronze Age, a ritual breakage and deposition of figurines occurred at two separate locations on Keros, known as the Special Deposit North and the Special Deposit South. While the Special Deposit North was destroyed by looters, the Special Deposit South remained undisturbed and was systematically excavated by the Cambridge-led Keros Island Project between 2006 and 2008 (see Figure 2).Footnote 27 Complementary studies based upon anecdotal testimony have also shed light upon the extent of the destruction that took place at the Special Deposit North and the cemeteries on Keros during the 1950s and 1960s, comprising the theft of hundreds of figurines, marble vessels, and intact pots, along with the disposal of broken pottery, bones, and obsidian blades.Footnote 28 A large portion of these looted objects are believed to partly constitute the so-called “Keros Hoard,” which is a series of archaeologically unprovenanced broken and intact figurines purchased by the Erlenmeyer Foundation and first exhibited in 1976 at the Kunst der Kykladen exhibition held in the Badisches Landesmuseum in Karlsruhe, Germany.Footnote 29 The clearly illicit contents of this now notorious display have had significant ramifications for legal attempts to successfully repatriate looted Cycladic material (see the section entitled “Provenance Standards”).
The site of Kavos on the west coast of Keros, viewed from Dhaskalio facing east. This is the general area where the “Keros Hoard” is believed to have come from. The grid plans from the 2006–8 excavations can be faintly seen in the clearing on the right-hand side (courtesy of the author).

The volume of figurines being sold on the antiquities market to museums and private collectors in North America and Europe led to the establishment of the N. P. Goulandris Museum in Athens in 1986, which was ostensibly designed to buy “orphaned” figurines surfacing on the antiquities market and ensure that they remained in Greece.Footnote 30 However, this acquisition policy served to accelerate looting and make the illicit trade even more profitable as dealers became aware of the museum’s willingness to pay significant sums of money for illegally sourced and archaeologically unprovenanced figurines.Footnote 31 Today, the situation regarding looting has largely stabilized as touristic and archaeological infrastructure has been developed throughout the Cyclades and as island communities become more aware of the intrinsic value of their cultural heritage.Footnote 32 However, it remains the case that looting persists on a limited scale, and figurines of an illicit origin continue to be sold openly by international auction houses on the legal antiquities market.Footnote 33
Against the backdrop of extensive excavations by both the Greek Archaeological Service and academic research projects, the looting of Cycladic figurines and the destruction of their archaeological contexts has still had a significant impact upon our understanding of Cycladic civilization. The function of Cycladic figurines has never been clearly and decisively ascertained, but a wide array of theories has nonetheless been offered to explain their possible purpose within Cycladic society. First, there is long-standing debate concerning whether figurines were primarily intended as funerary or domestic objects.Footnote 34 Theories in favor of a domestic function include their possible utility as devotional objects within household shrines.Footnote 35 The overwhelming majority of Cycladic figurines depict females, and a large proportion of anthropomorphic figurines show pregnant woman, which has led to associations with fertilityFootnote 36 and a possible role in commemorating the exogamous movement of high-status woman between island communities.Footnote 37 Only 5 percent of figurines depict males, who are normally represented in specific roles such as hunters or musicians, giving rise to notions that these particular figurines represent societal appreciation for the portrayed tasks.Footnote 38
There is evidence that some Cycladic figurines were painted in prehistory and were figuratively decorated with eyes and hair, in addition to a range of motifs such as zigzags, grooves, dotted rows, and stripes. Certain figurines still retain some traces of these painted designs, which have been variously interpreted as a mechanism for cultural continuity and identity among prehistoric island communities or for indicating socially relevant messages for individuals and smaller select groups.Footnote 39 A function within funerary rites has also been inferred from certain painted figurines – namely, red vertical striations – which have been cited as possible representations of mourning women.Footnote 40 Other theories have rejected a domestic-funerary dichotomy and instead suggested that figurines performed a dynamic series of successive domestic roles throughout their use-life, being redecorated for societal initiations and public ceremonies or to mark major events in an individual’s life, such as puberty, before finally being entombed with their deceased owner.Footnote 41 More recent theories have explored the cognitive possibilities of Cycladic figurines and assessed the function of marble sculpture as an innovative and high-value technology that drove social complexity, extended kinship, and long-range maritime voyaging in a manner that transformed the Cyclades during the Early Bronze Age.Footnote 42
To date, the most decisive contribution to understanding the issue of Cycladic looting remains David Gill and Christopher Chippindale’s 1993 landmark analysis on the material and intellectual consequences of esteem for Cycladic sculpture. This 58-page article established several of the ground truths commonly drawn upon when quantifying the damages caused by this illicit practice. On a practical level, it established that around 90 percent of the present corpus of Cycladic figurines are archaeologically unprovenanced and that as many as 12,000 graves may have been opened due to looting.Footnote 43 It also determined that, beyond controlled excavations, so much of what was thought to be known about Cycladic archaeology was not empirically certain since it was based upon archaeologically unprovenanced and potentially forged figurines. This argument was especially true of the “Masters” proposed by Getz-Preziosi, which the authors generally dismissed as an interpretive apparatus on these grounds.
On a theoretical level, the authors noted that they expected Cycladic figurines to exponentially rise in esteem over the coming years, but they conceded at the time of publication that sufficient numbers of figurines had not yet passed through auction sales in order to perform a reliable index of their value.Footnote 44 A further observation was that international laws, such as the 1970 UNESCO Convention, were ill-equipped to combat the “realities” of the illicit trade in Cycladic figurines.Footnote 45
Since the publication of Gill and Chippindale’s article in 1993, there has been no significant scholarship that has solely dealt with or documented the contemporary problems of Cycladic looting. Equally, given the stated need for statistical clarity as early as 1993, there has been no quantitative market analysis of their sales thus far. This lack of data is a surprising omission in our knowledge base, given the long-noted proliferating effect that antiquity market sales have had upon the looting of Cycladic figurines.Footnote 46 A time-series market analysis could therefore provide instructive insights upon the extent to which the sale volumes and monetary value of Cycladic figurines has increased or decreased over recent decades. This analysis in turn can allow inferences and possible conclusions to be drawn regarding the factors that have most decisively influenced the market for these objects. Time-series analyses have a proven precedent in estimating the risks and likelihood of a particular crime occurring again.Footnote 47 Performing one upon Cycladic figurine sales will not only offer clarity upon the extent to which regulatory procedures have worked, but also provide crucial insights as to why they have not worked: expanding upon and proposing solutions to the problem of ineffective control measures raised by Gill and Chippindale in 1993.
Global phenomenon of looting
A market analysis as proposed here also has wider implications that reach far beyond the immediate remit of Cycladic archaeology. The illicit trade in antiquities is a notoriously difficult area to study, as it often lacks the most basic empirical data.Footnote 48 This situation is due to the illicit antiquities trade belonging to the “dark figure” of criminality, which means that it lies beyond the present reach of contemporary crime statistics.Footnote 49 The illicit trade is statistically elusive in this manner for a number of reasons. In addition to sites that have been legitimately excavated, sites that are unknown to archaeologists also suffer from looting practices. This is an especially problematic phenomenon as the damage wrought to these unknown locations cannot be documented or analyzed by archaeologists or the relevant authorities.Footnote 50 Indeed, many of these unknown sites have been destroyed to such an extent that they are only known to archaeologists through the looted materials that appear for sale on the antiquities market.Footnote 51 On the occasions when archaeological site looting and the illicit trade is directly documented, it is often incorrectly listed under “art crime” or “cultural heritage theft,” leading to the very few existing data sets on the issue either being misleading or subsumed under mistaken categories.Footnote 52
Additionally, there is also an absence of a central register or “master catalogue” of looted sites worldwide,Footnote 53 which disrupts and, in many cases, prevents entirely the practical effort to statistically quantify looting. A representative example is the yearly sales figure for cultural heritage crime calculated and commonly cited by INTERPOL, which is $6 billion. However, by INTERPOL’s own admission, this is a largely anecdotal figure that is not backed up by empirical data, and it is doubtful whether there will ever be a resolute mechanism for generating accurate statistics on the yearly revenues of the illicit trade.Footnote 54 There is therefore a distinct need for reliable facts and figures, the absence of which has been decried as one of the core hindrances in understanding and ultimately combating the trafficking of archaeological objects.Footnote 55
While official attempts have been met with limited success, it has been suggested that private initiatives have a greater chance of providing statistical clarity, particularly those that conduct case studies that deal with specific categories of object.Footnote 56 Therefore, in lieu of directly assessing on-the-ground destruction, a market analysis in the sales of Cycladic figurines could nonetheless contribute fundamentally relevant empirical data on cultural heritage crime as auction statistics have a noted precedent in interpreting the illicit market,Footnote 57 and antiquity market sales have been proven as the primary sustainer of looting practices.Footnote 58 A time-series market analysis can also shed much needed light upon the “grey” aspects of the antiquities trade,Footnote 59 in which international criminal activity is imperceptibly intertwined with the legitimate business interest of auction houses. Illicitly sourced antiquities are frequently found on the legal market masquerading as poorly provenanced objects of an ambiguous origin, which is a strong and often decisive indicator that they have been looted.Footnote 60 This licit/illicit interface operates openly and unchallenged within antiquity market environments,Footnote 61 and there is a contemporary need for criminological research that specifically addresses this issue.Footnote 62
Parallel to providing much needed statistics on the illicit trade, this study can also grant a wider insight into how the antiquity market responds more broadly to attempts of legal and ethical control. The UNESCO Convention is an international treaty designed to facilitate for signatory nations a licensing system for the export of cultural objects, the protection of cultural objects from looting and illegal export, and a means of facilitating the recovery and repatriation of illegally exported cultural objects.Footnote 63 One of its primary achievements is the establishment of a provenance threshold, which is often referred to as the “1970 standard.”Footnote 64 According to this convention, for the acquisition of an archaeological object to be both ethical and legal, it must have either been removed from its country of origin before 1970 or legally exported after 1970.Footnote 65
However, in the intervening 50 years since this convention, the destruction of archaeological sites and the sales of their resultant antiquities has increased rather than decreased, and cases continue to emerge that show either a flagrant disregard or careful manipulation of the 1970 statutes.Footnote 66 Cultural heritage cannot be protected without market transparency, and, before the market can be regulated, the existence and nature of the problem must be clarified.Footnote 67 Therefore, understanding the extent to which deliberate ethical and legal measures work is a crucial and timely consideration not just within Cycladic archaeology but also within archaeology as a whole.
Data and methods
An unpublished study conducted by the Department of Antiquities of the Ashmolean Museum in 2009 examined antiquity market sales in prehistoric Aegean objects between 1989 and 2009.Footnote 68 This study primarily examined sales catalogue data from Sotheby’s and Christie’s, but it also drew upon a series of smaller continental and London-based auction houses. Following on from the work of the Ashmolean, the present study has taken online sales data in Cycladic figurines from Sotheby’s and Christie’s between 2009 and 2019 as well as online sales data from Bonham’s between 2003 and 2018 and fused them together with the Cycladic figurine sales data from the Ashmolean study between 2000 and 2009 in order to create a unified chronological “block” spanning 19 years (2000–19) across these three major auction houses. Solid price data was unavailable in the Ashmolean study prior to 2000 and has thus been omitted from the present study.
It should also be noted that the data gathered and analyzed here is not an exhaustive account or measure of every individual transaction in Cycladic figurines conducted by the considered auction houses over the analyzed time period. Consequently, rather than being taken as a definitive or conclusive account, it should instead be viewed as a broadly representative sample. Additionally, as sizeable portions of this data (Sotheby’s and Christie’s from 2009 to 2019 and the entirety of the Bonham’s data) were taken directly from open access company websites, the data can therefore be viewed as a reflection of what these auction houses wish to circulate within the public domain as well as neglect to disclose.
A 2019 analysis of cylinder seal sales against the backdrop of the United Nations Security Council (UNSC) Resolution 1483, which implemented a trade embargo on the international sale of Iraqi antiquities following the 2003 invasion, pointed out that Sotheby’s had moved their business plan up market from around 2004, selling smaller amounts of higher value material.Footnote 69 This meant that decreasing sales volumes were reflective of the company’s business plan rather than the success of regulatory measures. However, studies of this nature have generally looked at the New York branch of Sotheby’s in isolation,Footnote 70 only once supplementing this data with sales statistics from another auction house, the London branch of Christie’s.Footnote 71 The methodology undertaken here will extend its analysis to the “duopoly” of Sotheby’s and Christie’s and include both their London and New York offices. However, as the business strategy of pursuing high-value sales appears to be a problematic structuring variable within market data from Sotheby’s, this analysis will also expand beyond the duopoly to consider Bonham’s, which is a comparatively smaller, predominantly London-based auction house, whose business model incorporates sale lots of both high and low value.
As a result of their qualitative business model, Sotheby’s has been reporting declining sales volumes across all departments since 2000.Footnote 72 If it is taken as an expected standard that their sales volumes will be decreasing and, moreover, that these reductions are not representative of successful attempts at market control, then this standard can be factored into the overall analysis, without necessarily corrupting the data or invalidating its conclusions. Additionally, since the high-end business strategy of Sotheby’s is clearly established, then the contrasting commercial policies of Christie’s and Bonham’s, which are orientated upon quantitative sales, can be brought into sharper focus. Across these three auction houses, then, a comprehensive picture of market practice can be attained, which can overcome the problematic nature of the Sotheby’s sales data and lay the foundations for developing a more accurate gauge of what has most decisively affected the market.
Prevalence, 2000–19
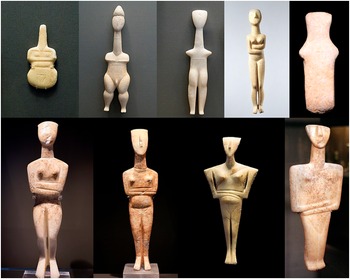
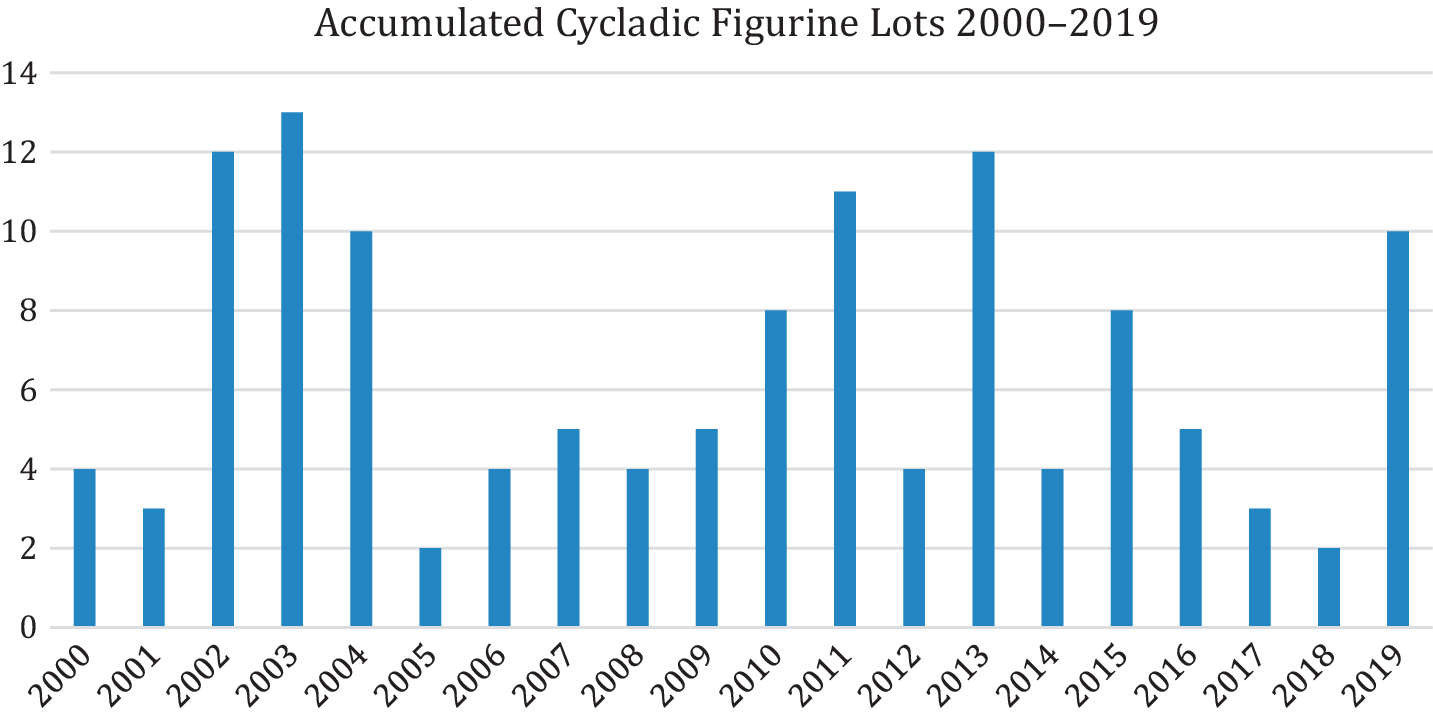
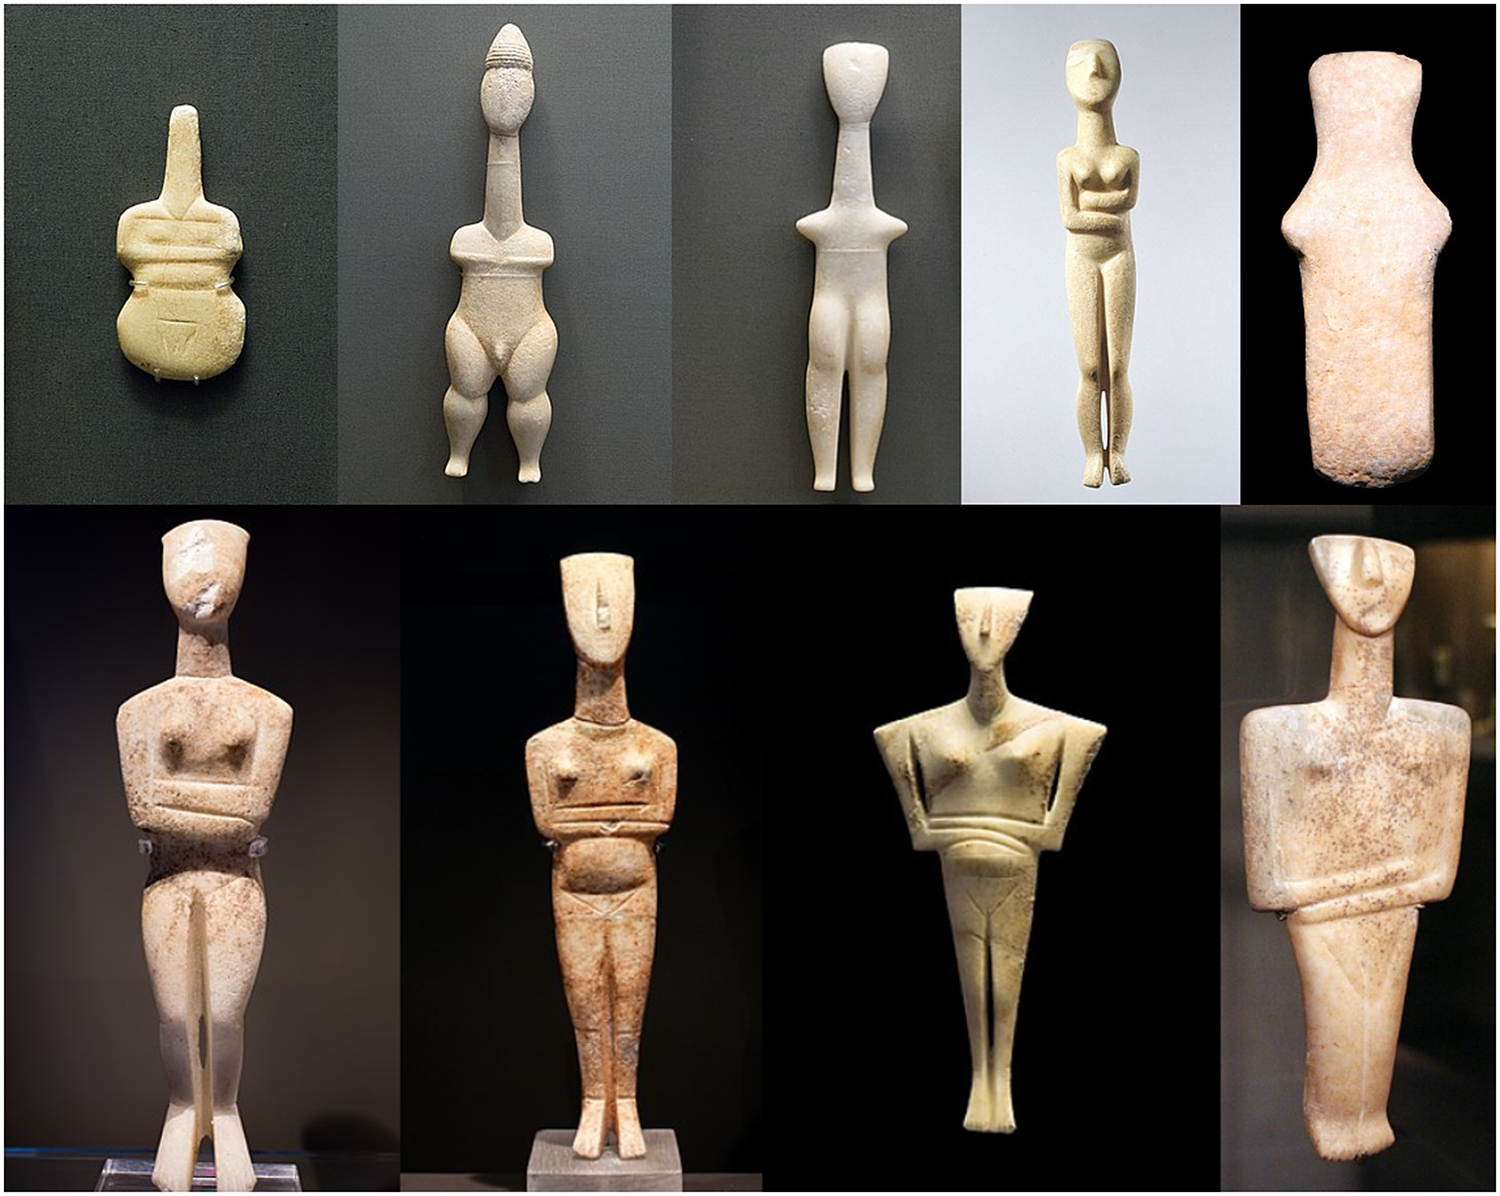
According to the data gathered as part of this study, between 2000 and 2019, Sotheby’s, Christie’s, and Bonham’s sold an accumulated total of 129 Cycladic figurine lots (see Figures 3–4). These lots comprised 77 intact figurines (defined here as either fully intact or with only the feet or head missing), 24 fragments (such as legs and torsos), and 28 heads. Of these 77 intact figurines, 62 were of the anthropomorphic, folded arm variety (Kapsala, Spedos, Dokathismata, Chalandriani), and 15 were schematic (Pelos, Plastiras, Louros, Apeiranthos). From the 28 heads, 27 were anthropomorphic, and 1 was schematic. From the 24 fragments, 23 were anthropomorphic, and 1 was schematic. When these numbers are compared to the classifications of figurines recovered from securely excavated archaeological contexts, they make for intriguing reading.
Examples of the nine classifications of Cycladic figurine discussed in this study. Clockwise from top left: Pelos, Plastiras, Louros, Kapsala, Apeiranthos, Chalandriani, Dokathismata, Early Spedos, Late Spedos (composite image created by author using images taken from Wikimedia Commons and shared under Creative Commons Attribution Share-Alike 3.0 Licence).
Accumulated Cycladic sales lots from Sotheby’s, Christie’s, and Bonham’s between 2000 and 2019, comprising their London and New York offices.

Barring the Keros deposits, which have yielded five intact figurines, only 216 intact figurines have been recovered from settlement and cemetery contexts in the Cyclades, Crete, mainland Greece, and the islands of the north and east Aegean after 140 years of systematic research.Footnote 73 From these 216 figurines, 147 were schematic, and only 43 were of the folded-arm anthropomorphic varieties. These numbers are essentially an inverse of the numbers found upon the antiquities market. The contrasting nature of these two datasets directly contradict an orthodoxy held within the field of Cycladic archaeology, which is that grave and settlement contexts are far more likely to contain schematic figurines, while folded arm figurines are the preserve of special deposits.Footnote 74 If this were indeed the case, and looting had occurred at a fairly consistent and generalized rate throughout the Cyclades, then it would be expected that the quantities of intact schematic and folded-arm figurines recovered via excavation would match the quantities offered for sale. This would be the case since settlements and cemeteries vastly outnumber special deposits, and special deposits normally offer minimal numbers of intact figurines, if any.
However, the prevalence of schematic figurines uncovered via excavation is not replicated in the antiquity market data but, rather, reversed, and this contradiction implies one of two possibilities. The first possibility is that so much looting has taken place in the Cyclades that our perceptions of figurine distribution patterns have become significantly skewed. This bias has resulted in an academic theory arising that assigns a prehistoric aversion to folded-arm figurines at cemeteries and settlements, when the true cause of this absence is modern systematic looting practices preferentially targeting high-value anthropomorphic figurines. The second possibility is that looters have illicitly excavated in a more indiscriminate fashion and simply kept the folded-arm figurines they encountered while discarding the schematic or diminutively statured varieties due to their limited (as perhaps they may have thought) economic value. This potentiality has been discussed in previous literature and would explain the low volumes of schematic figurines on the antiquities market.Footnote 75 The price data presented later in this article demonstrates the contrasting average prices for schematic and anthropomorphic figurines and offers empirical support for both the possibilities discussed here, which may even be in simultaneous operation (see Figures 9 and 10).
Another explanation for the disproportionate number of anthropomorphic figurines on the antiquities market may also be that higher numbers of anthropomorphic forgeries have been created, due to their enhanced economic value. The substantial looting of Cycladic contexts during the 1960s and 1970s occurred during an era of eastern Mediterranean archaeology colloquially referred to as “the age of piracy,” where vast quantities of objects were looted from Greece, Turkey, and the Levant and promptly sold to an array of Western buyers.Footnote 76 It has previously been hypothesized that, during this epoch of industrial-scale looting, Cycladic deposits were exhausted of their natural volumes of genuine figurines, and, as a result, an active counterfeit industry arose, where modern forgeries were created specifically to service strident consumer demand.Footnote 77 There is no scientific way to conclusively determine the chronological age of a Cycladic figurine once it has been removed from its archaeological context,Footnote 78 and anecdotal evidence exists that shows that forgers operating within the Cyclades would often bury newly created figurines in order to provide them with an ancient appearance.Footnote 79
Therefore, it would seem probable that the predominance of anthropomorphic figurines on the antiquities market shown here is constituted by a significant number of fakes. While the prevalence of fakes has often been alluded to and generally accepted within archaeological circles, the evidence presented here offers a practical insight into the extent and nature of the problem. When viewed together with the dearth of anthropomorphic figurines securely recovered via excavation from archaeological contexts, this evidence poses significant questions as to how much of the current academic understanding of Cycladic figurines and their distribution patterns is based upon modern forgery and the selective strategies of looters.
The shifting of sales, 2000–19
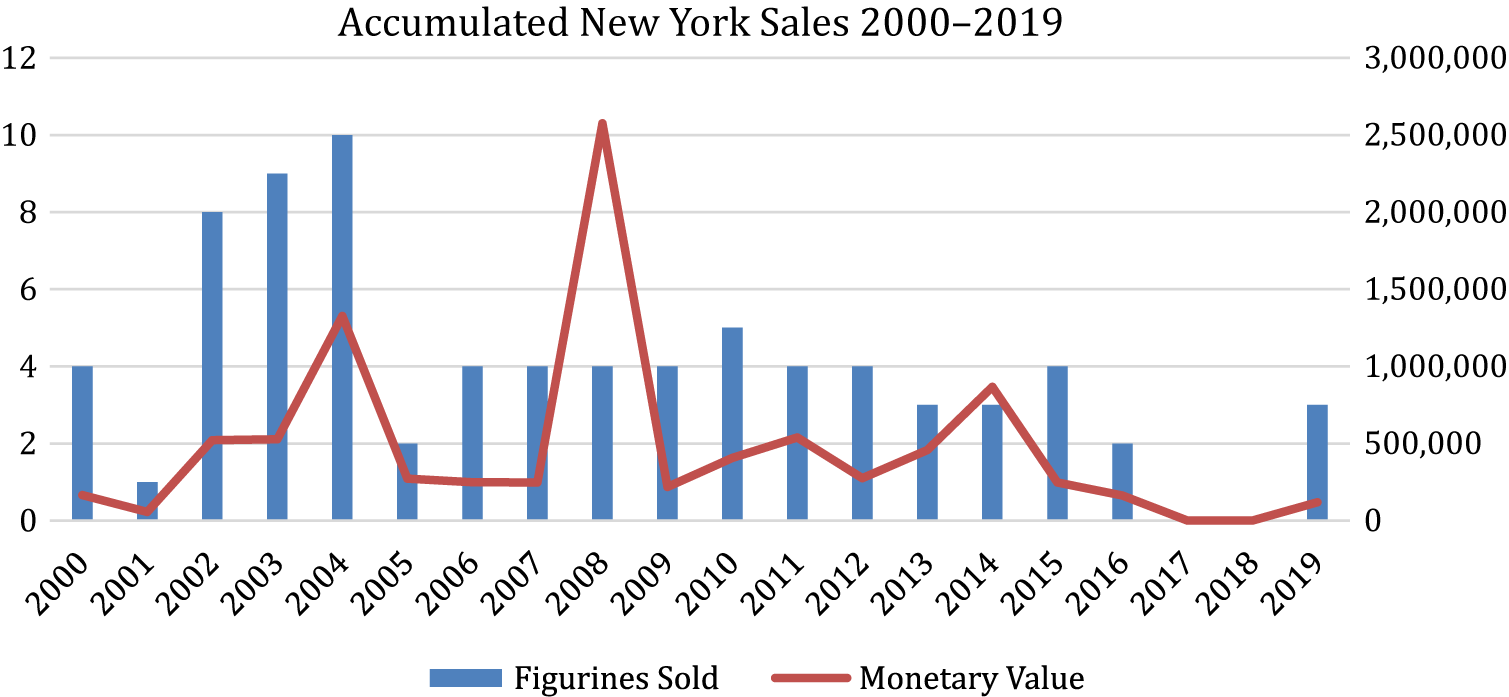
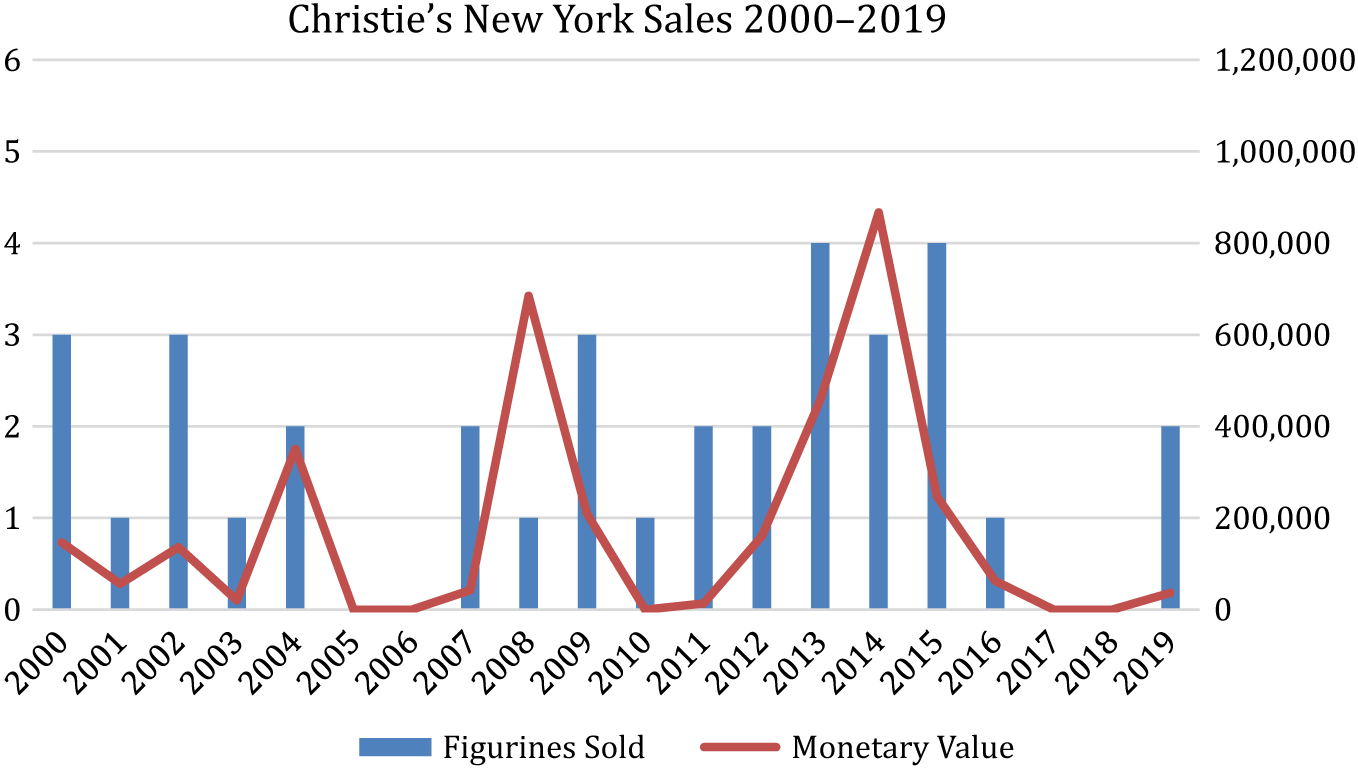
A sharp increase in accumulated sales from 2002, possibly due to enhanced public and official scrutiny regarding the provenance of Middle Eastern antiquities in light of the Iraq War, reached its peak in 2003, with 13 figurine sales, the highest volume for any year recorded within the study (see Figure 4). This increase extends onwards through to 2004, until there is a steep decline in 2005, with the numbers plummeting from 10 to two. It would appear beyond a simple coincidence that, as laws such as the UNSC Resolution 1483 were being formalized and public outcry over the sales of illicit Iraqi material was at its highest, the cumulative sales number for Cycladic figurines show a precipitous rise. However, a closer look at where these transactions occurred shows that the majority of sales over this 2002–4 period were conducted through the New York offices of Sotheby’s and Christie’s rather than their London branches (Figures 5 and 6).
Accumulated New York Cycladic sales, 2000–19. Not including $16 million sale in 2010.

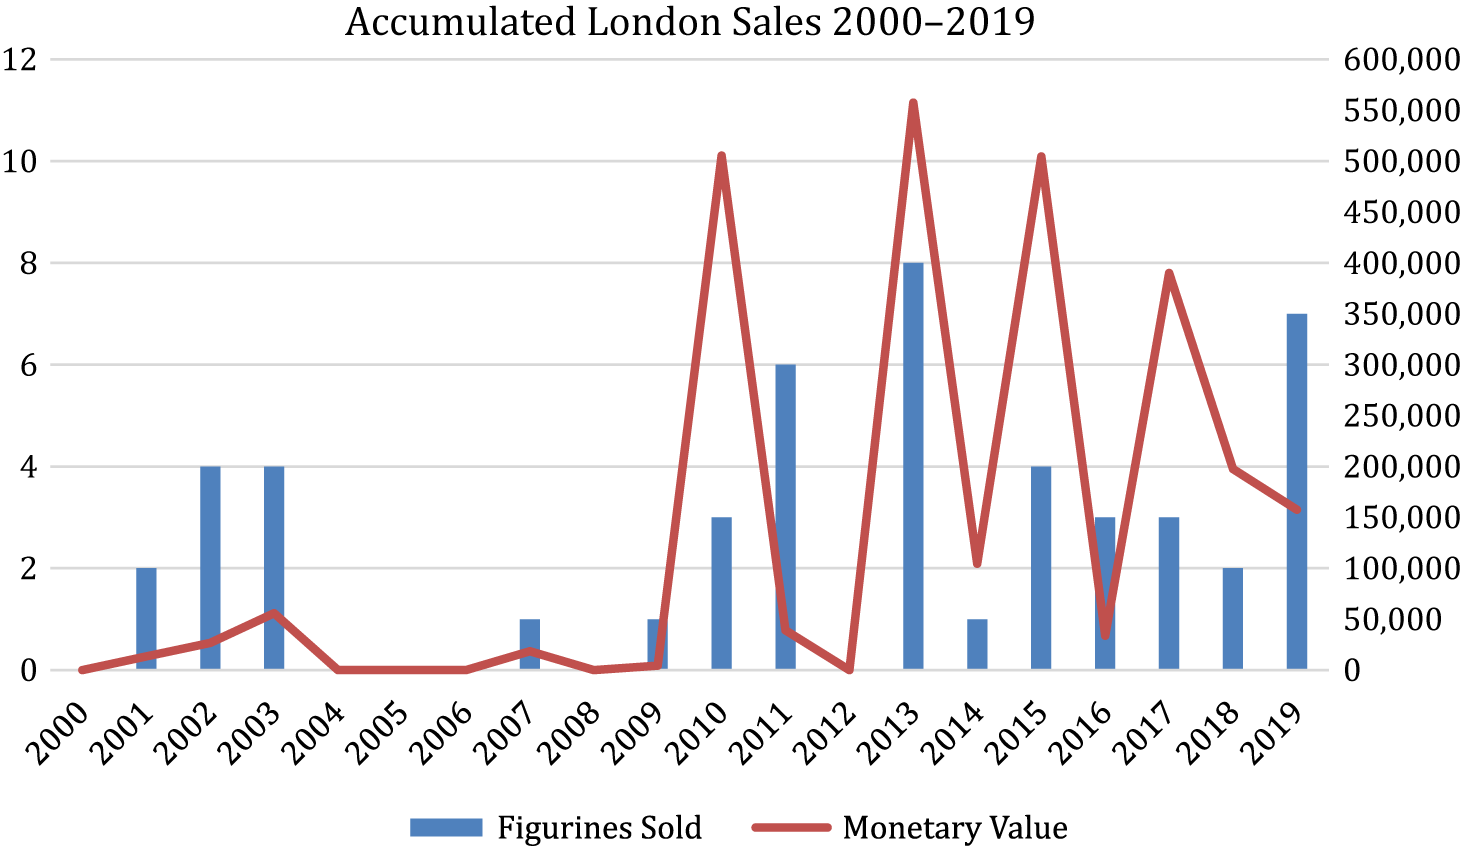
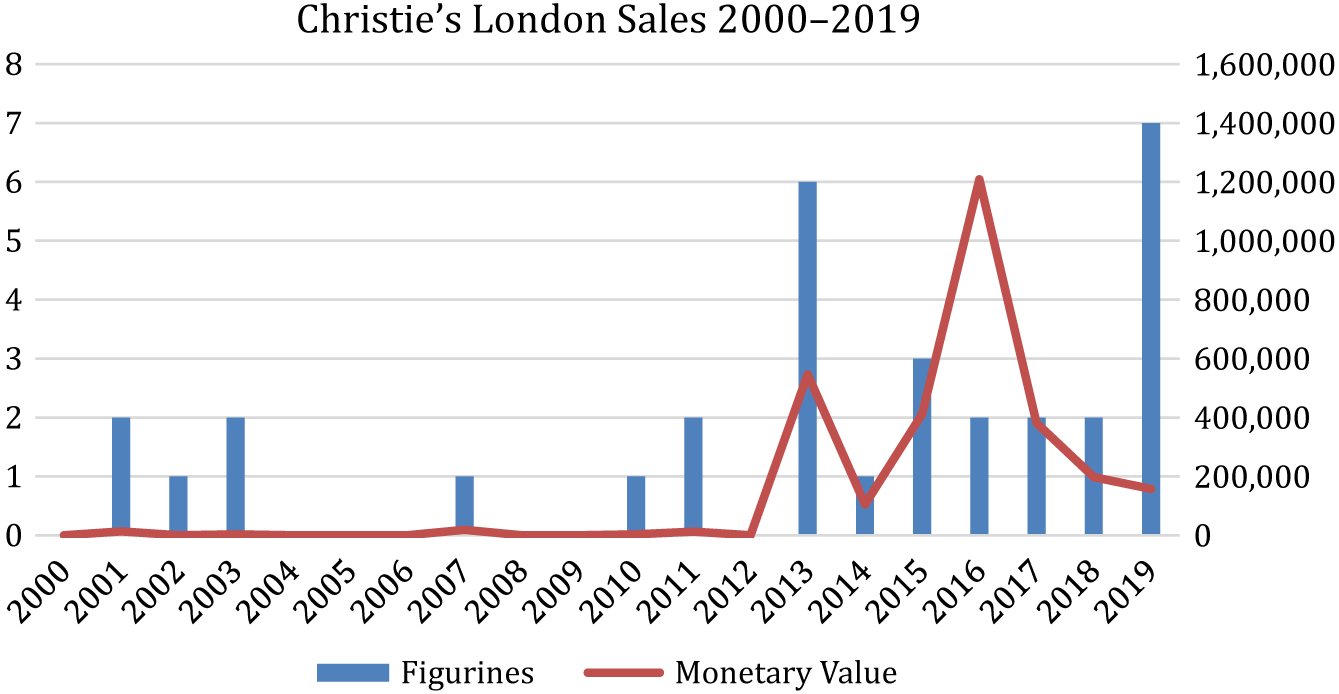
Accumulated London Cycladic sales, 2000–19. Missing figure sold for £1,202,500 in 2016.

This finding is highly significant as Britain had become party to the 1970 UNESCO Convention in 2002,Footnote 80 and, accordingly, efforts to enforce adherence to these protocols would have been at their most concentrated level, as would company efforts to give a public demonstration of compliance to the newly established statutes. Therefore, rather than these market control measures having an outright preventative effect, this evidence suggests an especially tailored response from the auction houses: increasing Cycladic figurine lots due to UNSC Resolution 1483, but then diverting these Cycladic sales through their New York offices in light of enhanced official scrutiny in London due to Britain’s ratification of the 1970 UNESCO Convention. An awareness by auction houses of the heightened legal climate within this period is partly corroborated by the accompanying provenance evidence, for out of the 13 figurines sold in 2003, 11 of them had a traceable or pre-1970 provenance (see the section entitled “Provenance Standards”)
Further possible evidence of this “shifting” of sales can be found between 2011 and 2013 in relation to the Greek government’s request to American authorities in 2010 for a memorandum of understanding (MOU) regarding import restrictions on cultural property originating from Greece. The MOU was eventually signed in 2011.Footnote 81 The accumulated sales data from the New York offices of Sotheby’s and Christie’s appear to show a decline in sales from 2011–13, plateauing at four Cycladic lots per year before dropping to three in 2013 (Figure 5). However, when the statistics for the accumulated London sales are cross-examined, they show an increase over the same time period, starting at six lots in 2011 and peaking at eight lots in 2013 (Figure 6). When viewed together with the cluster of sales around 2003, these trends appear to reinforce the notion that the major auction houses may simply “shift” their sale lots to offices in a different country as a direct response to hardening market control measures in another. It also suggests more widely that, rather than control measures prompting auction houses to reduce or limit their lots, they simply elicit adapted sales policies, which are crafted in precise response to developing legal norms or to deflect public scrutiny.
A final observation on the “shifting” of sales, which highlights the central importance of the commercial market context, relates to Council Directive (EU) 2014/60.Footnote 82 This is a legal mechanism for the restitution of cultural objects illegally removed from the territory of one European Union (EU) state to another after 1993. When this directive came into force in 2014, immediate sales on the London market saw a significant decrease, dropping from eight in 2013 to one in 2014 (Figure 6). However, unlike Britain’s ratification in 2002 of the UNESCO Convention or the 2010 MOU between Greece and the United States, there was no concurrent rise in sales on the opposing market, which, in this case, would have been the New York market. It is suggested here that the absence of a proliferation of sales in New York in 2014 is due to the fact that high sales volumes do not always necessarily correlate to high profits. The solitary Cycladic figurine lot sold on the London market in 2014 went for £104,500, while the six Cycladic lots sold on the London market in 2011 had a cumulative sale value of £39,125. Additionally, the three Cycladic figurine lots sold in London in 2016 had an accumulated value of £1,236,250 (see Figure 6).
In other words, with careful selection, optimum profitability can be extracted from a minimal number of sales, and, as such, there is not always a need to “shift” lots in a given year to a market country where the control environment is less stringent. This reality means that any appraisal of market data that attempts to determine the success or failure of market control measures should look not only at declining or increasing lots but also make central consideration of the tacit profitability at play within seemingly low sales volumes. Failure to do so will result in a mistaken reading of the market data, which imputes the direct success of market control measures. Readings of this nature will allow auction houses to simultaneously benefit from a public display of compliance with emerging legal restrictions while broadly maintaining or even increasing their margins of profitability.
Price, 2000–19
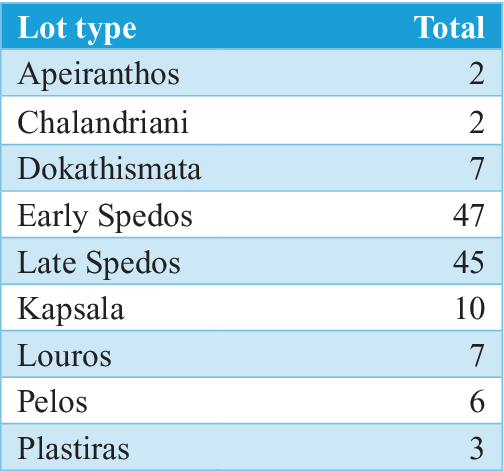
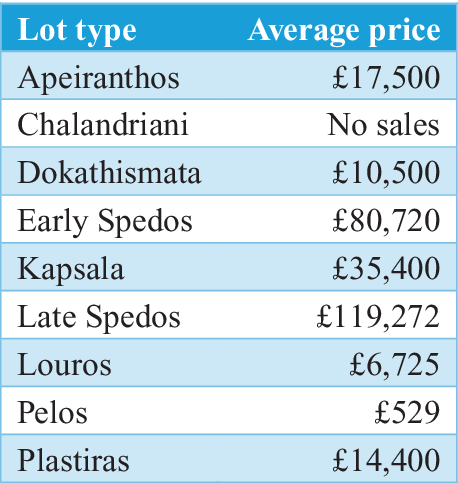
Since the evidence presented above in Figures 5 and 6 demonstrate that the prices for Cycladic figurines can vary significantly, it is necessary to gain an understanding of what these variations in price are predicated upon and how they influence antiquity market data. As already mentioned, during this period, 77 figurines, 24 fragments, and 28 heads were sold. The data presented in Figure 7 shows the figurine classifications of these lots (that is, Spedos, Louros, Pelos, and so on) and the frequencies with which they have appeared upon the antiquities market over this period. Data in Figures 9 and 10 show the average prices for these specific classifications upon the New York and London markets.
Accumulated quantities of lot classification sold, comprising intact figurines, fragments, and heads.
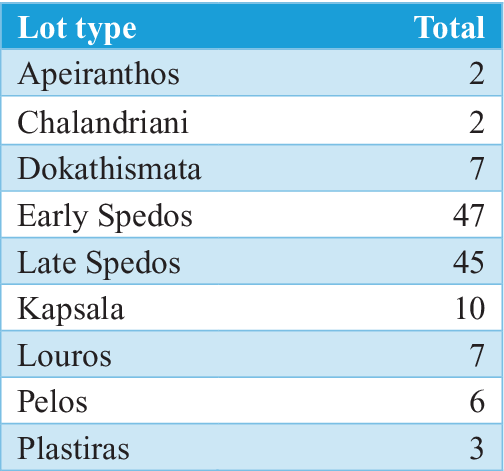
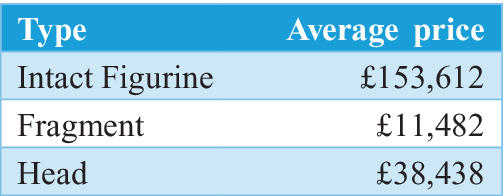
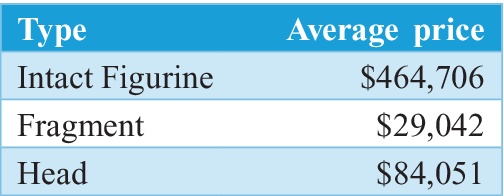
The Spedos variety examples are the most frequently traded form of Cycladic figurine on the antiquities market (Figure 7). However, an understanding of price average across all three auction houses shows that Spedos variety figurine lots also command the highest mean prices, making them the most attractive figurine classification for auction houses with a high-end business model. In terms of preservation, the same can be said for intact figurines, as the data shown in Figures 11 and 12 demonstrate that they fetch the highest prices on the London and New York markets, far outstripping those paid for heads or fragments.
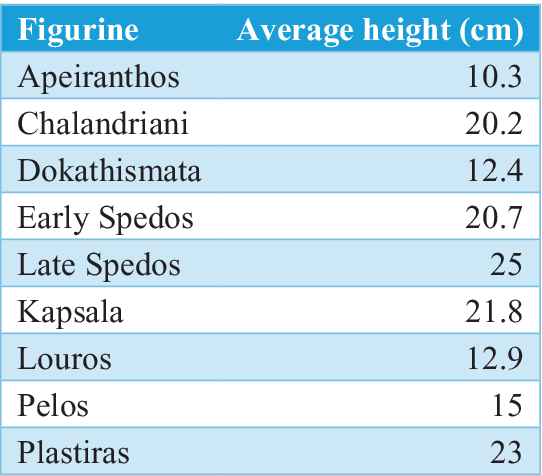
In addition to quality, it also appears that size has a probable bearing upon price, as the data in Figure 8 demonstrate that the largest and smallest average heights for figurines generally conform to the highest and lowest average prices paid. A picture then begins to emerge of what commands the highest sums for a Cycladic figurine lot, which, based upon the data gathered here, appears to be an intact Spedos or Plastiras figurine. These variations in price are mapped out in more precise detail later in this article in specific regard to the high-end commercial model of Sotheby’s and the more quantitatively orientated business plans of Bonham’s and Christie’s.
Average mean height per figurine classification.

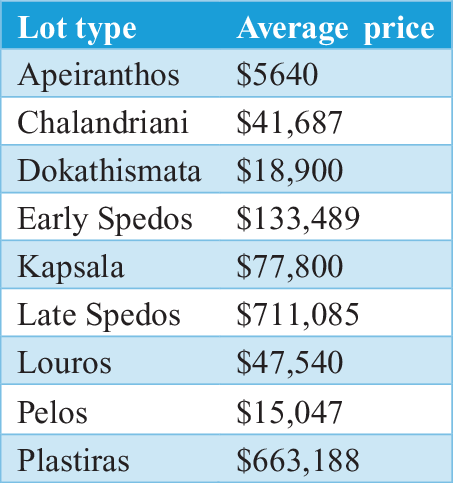
A crucial point of consideration relates to the apparent gulf in prices paid for Cycladic figurine lots between the New York and London markets. The data presented in Figures 9 and 10 suggests that consistently higher prices are paid for the same classification of figurines on the New York market over its London counterpart. This trend also holds true regarding the condition of the lots, with the sums paid for fragments and heads in New York far outstripping those paid in London (Figures 11 and 12). These increases in price are also matched by a concentration of sales by Sotheby’s through their New York office, which since 2000, barring seven sales in London, have conducted the entirety of their Cycladic figurine lots through New York (Figures 22 and 23). This preferencing of the New York market shows an acute awareness of, and active engagement with, its enhanced profitability by Sotheby’s and demonstrates the prevalence of their high-end business model. More broadly, this evidence suggests that any reading of antiquity market data must consider both the New York and London offices of auction houses before drawing any conclusions about declining sale volumes and the relative success or failure of control measures. Any potential analysis of the London market alone, which is unaware of these latent market realities, may incorrectly deduce a successful control environment, leading to skewed and unrepresentative conclusions regarding the true cause of diminished sales.
Average mean price per figurine classification on the New York market.

Average mean price per figurine classification on the London market.

Average mean prices for intact figurines, fragments, and heads on the London market.

Average mean prices for intact figurines, fragments, and heads on the New York market.

Given the well-established role of Modernist artists in popularizing Cycladic figurines to a wider society, it would naturally be expected that a figurine owned by a Modernist artist would command a price at auction that is significantly higher than average. To date, only three figurine lots have been sold on the antiquities market that were connected with a prominent Modernist artist. These three lots were all figurines owned by the artist Jacob Epstein and were sold by Sotheby’s New York in 2006, comprising a Late Spedos figurine and two Louros schematic figurines. The Late Spedos figurine was sold for $216,000, while the two Louros figurines sold for $18,000 and $10,200. The sums fetched for the Epstein figurines fall well below the average sales prices shown above for Late Spedos and Louros figurines on the New York market. It would appear then that, far from having an enhancing effect upon price, connections with Modernist artists have produced no demonstrable impact in inflating the fees commanded by Cycladic figurines. The lack of market response to direct Modernist associations is a notable phenomenon and raises questions of what specific set of factors have the operative influence in increasing both the desirablility and value of a Cycladic figurine on the antiquities market.
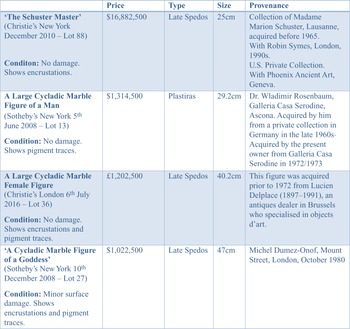
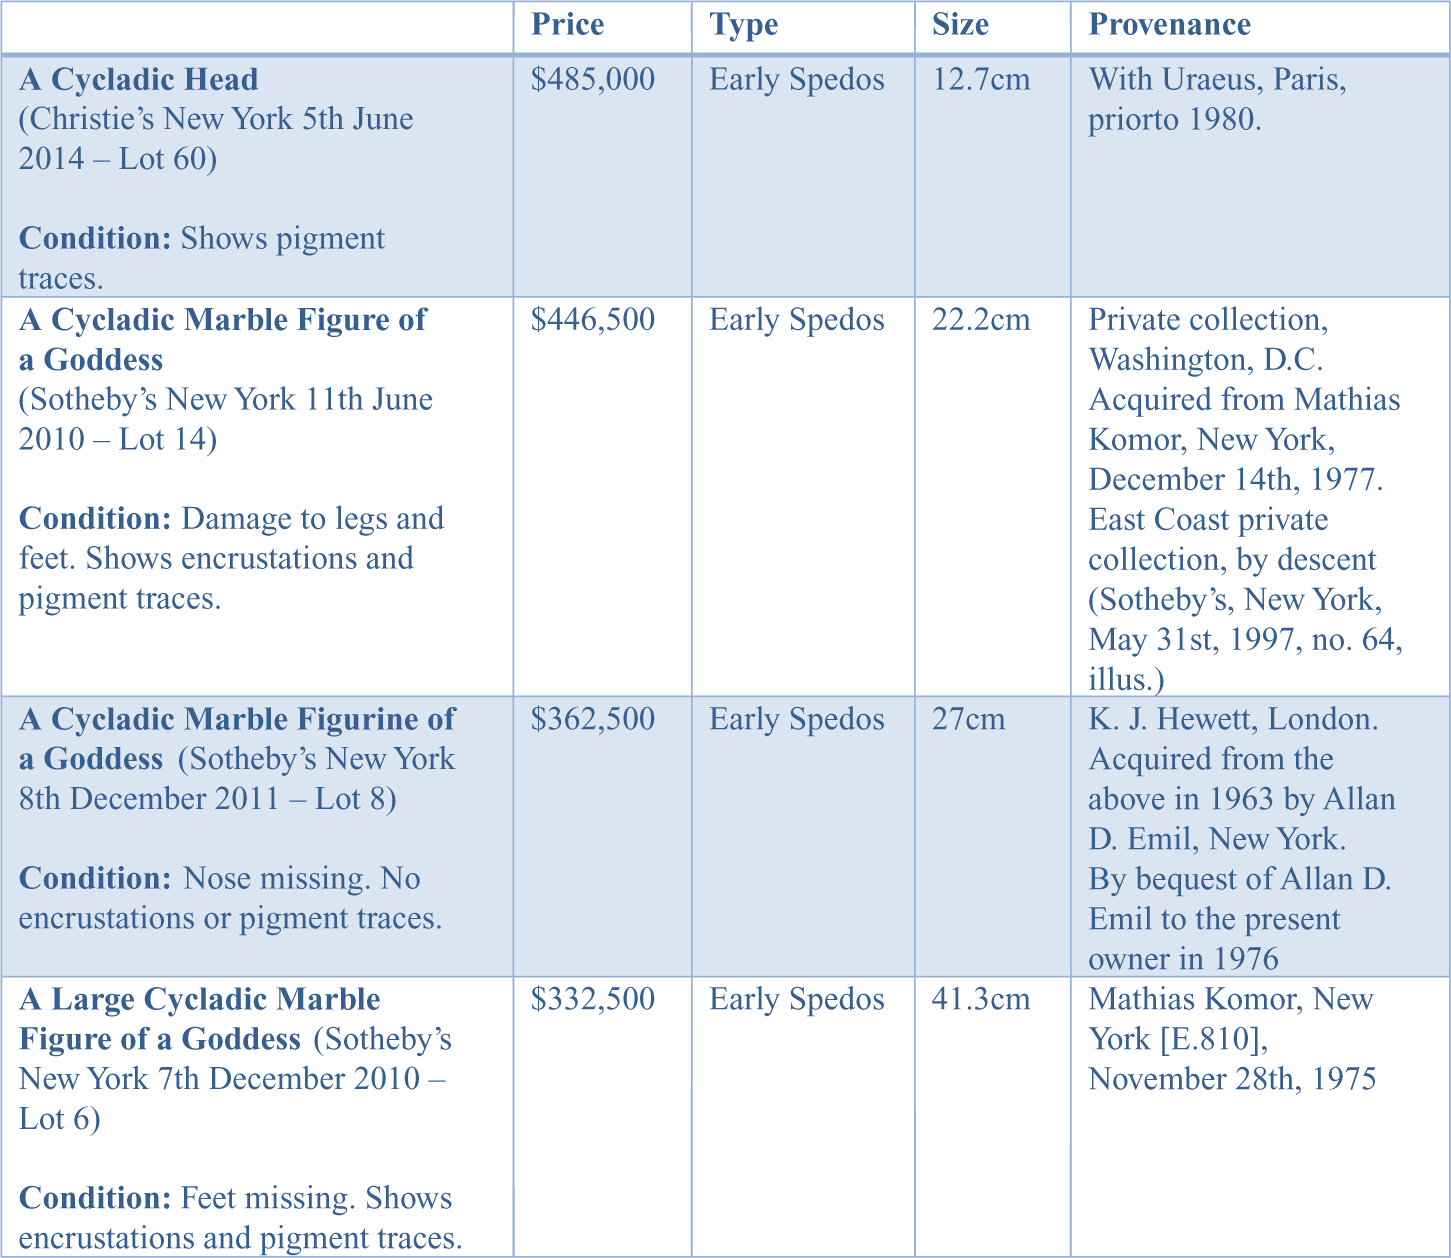
Of all the Cycladic figurines sold thus far, only four have exceeded the $1 million mark (Figure 13). These figurines, which are the four most expensive sold to date, have all conformed to a certain set of criteria, in that they were all intact anthropomorphic figurines of very good/good preservation, 25 centimeters and over in height, and with a provenance that provides the name of at least one previous owner, who is normally either a famed collector or renowned antiquities dealer. Three out of the four figurines have a pre-1970 provenance, while the remaining figurine has a provenance dating to 1980. Additionally, all have some form of physical distinction upon their surface. In the case of the Schuster “Master,” there is the coating of “calcareous encrustations,” which are ostensibly the natural accumulation of thousands of years of deposition, while the remaining three figurines retain faint traces of pigment around the face, neck, and hairline, which are often referred to as “ghosts” of paint in the lot information.
Table showing the four Cycladic figurines sold for over $1 million.

The importance of these various criteria in enhancing price can be brought into further focus when they are compared with the next set of the four most expensive figurines sold between 2000 and 2019 (Figure 14). These lots never exceed the $500,000 mark but are similar in many ways to the lots exceeding $1 million. Two measure over 25 centimeters, three have some form of “ghost” paint, while all have a named previous owner in their provenance and are of an anthropomorphic variety. However, conversely, they also differ from the $1 million lots in that none have a pre-1970 provenance, two are beneath 25 centimeters, one is a head, and all have comparatively diminished levels of preservation. The implication then must be that a range of simultaneous and specific factors must be present within a figurine lot for it to attain a price in excess of, or closely approaching, $1 million. Based upon the contrasting data presented in the tables below, these factors are (1) a fully intact figurine; (2) very/good level of preservation; (3) “ghost paint” pigments or “encrustations”; (4) height of 25 centimeters and above; (5) provenance linkage to a named esteemed previous owner or dealer; and (6) provenance generally of a pre-1970 date and no later than 1980. It is the presence and combination of all these attributes that significantly enhance the worth of a Cycladic figurine into the high prices ranges above $1 million rather than any single factor alone having a decisive influence upon value.
Table showing the next four most expensive Cycladic figurines sold at auction.

The esteem for Cycladic figurines on the antiquities market has long been understood as an artistic phenomenon, but the preferencing of these six particular characteristics indicate what the most potent combination of factors are within this generalized artistic esteem once a figurine is offered for sale. The function of pigment in enchancing price is of especial note and can be interpreted from a market perspective as a guarantor of authenticity, owing to the presence of paint on figurines securely recovered from burial contexts. This is a significant development when it is considered that concerns were previously raised regarding the potential cleaning of painted figurines by looters in order to fit artistic and commercial preconceptions of Cycladic figurines as objects of unadorned white marble.Footnote 83 Equally, encrustations can also be viewed from a market perspective as guaranteeing authenticity, through supposedly evidencing advanced chronological age. However, as noted previously, anecdotal testimony shows that forgers in the Cyclades often bury counterfit figurines specfically to cultivate an ancient appearance for their products. The prescence of pigment traces or encrustations throughout all the lots above $1 million and their general prevalence through all the lots in Figures 13 and 14, barring one, may indicate that the market in Cycladic figurines has evolved in light of the proliferation of forgeries from a wholly artistic orientation to one that places increased emphasis and monetary value upon archaeolgical indicators of authenticity, even if these indicators are themselves dubious and easily forgable.
Provenance standards, 2000–19
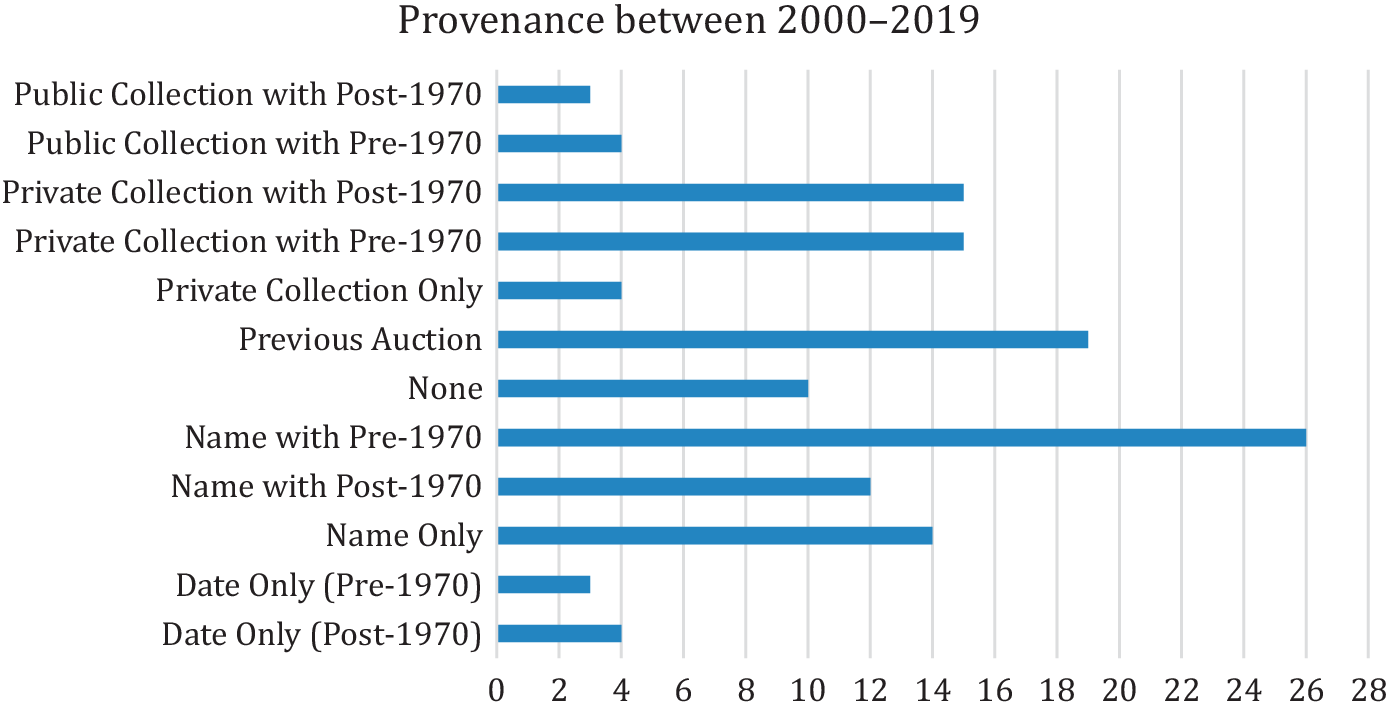
Of the 129 Cycladic figurine lots sold between 2000 and 2019, the present study has arranged them according to 12 different provenance categories (Figure 15). These distinctions have been divided in direct relation to the statutes of the 1970 UNESCO Convention, Council Directive 2014/60, and whether or not an object has been previously displayed – either publicly or at auction – without an official protest from the source nation. As mentioned above, a demonstrative example of this situation was the Kunst der Kykladen exhibition. Cycladic figurines from this exhibition were eventually put up for auction at the London office of Sotheby’s in 1990, and an injunction lodged by the Greek government to prevent their sale was ultimately unsuccessful on the grounds that these objects had been previously displayed in 1976 without any official protest.
The twelve provenance categories, 2000–19.

Note should also be made here of domestic Greek law. On a national legislative level, the export of cultural material from Greece is illegal. The first comprehensive and nationally binding legislation that prohibited the sale and export of antiquities was introduced in 1834.Footnote 84 The illegality of export was reinforced in 1899 with Law no. 2646, which introduced fixed penalties for antiquities smugglers and, crucially, implemented state ownership of antiquities, even if they are discovered in private land.Footnote 85 The current legislation in place – Law no. 3028, introduced in 2002, and Law no. 3658, introduced in 2008 – offer a robust and broad-ranging legal framework that shores up the shortcomings of previous policies and provides systematic protection for the cultural heritage of Greece.Footnote 86 However, it is regrettably the case that all of the implemented national legislative measures have routinely been ignored by looters and smugglers. They are only legally binding within Greece, and once an object is removed from Greek territory, it is no longer subject to Greek law. The legislative and logistical difficulties of enforcing the statutes of one nation’s cultural heritage laws in another nation have long been noted,Footnote 87 which leads to reliance upon international treaties such as 1970 UNESCO Convention and bilateral agreements such as MOUs.
There are several limitations to the 1970 UNESCO Convention,Footnote 88 which can significantly inhibit its legal utility. It is not a retroactive treaty, which means that it cannot facilitate the repatriation of cultural objects that fall before the 1970 threshold, something known as “the statute of limitations.”Footnote 89 Another core weakness of this convention is the allowance it makes for “good faith acquisitions.”Footnote 90 Even though it is a common law that good title or good faith cannot be conveyed upon stolen property (nemo dat), signatory nations that follow continental European legal tradition allow for good faith to be conveyed upon illicitly sourced or stolen material.Footnote 91 In a practical sense, this means that a looted object, once purchased in good faith, can bypass the provisions of the UNESCO Convention to be freely and legally traded upon the licit antiquities market.Footnote 92 These shortcomings were partly ameliorated by the 1995 UNIDROIT Convention, which circumvents the good faith loophole and provides a framework for private legal actions aimed at repatriation efforts, offering essential litigation recourse beyond the largely intergovernmental statutes of the 1970 UNESCO Convention.Footnote 93 However, while Greece ratified this convention in 2007, the United States and the United Kingdom have yet to do so.
These legal considerations affect the provenance categories examined here in the following ways (Figure 15). Any provenance categorization that satisfies the 1970 threshold (public collection with pre-1970, private collection with pre-1970, name with pre-1970, and date only pre-1970) puts the object beyond any legal attempts of repatriation through the statute of limitations. Any categorization that is post-1970 (public collection with post-1970, private collection with post-1970, name with post-1970, date only post-1970) could be potentially pursued through the courts as violating the 1970 UNESCO Convention or Council Directive 2014/60, with a reduced capacity regarding “public collection with post-1970” if the object has been previously displayed with no official protest from the Greek government. “Private collection only” means the object has never been displayed in a public setting before but provides no date, and it could potentially be pursuable if a post-1970 date is established. “Previous auction” means that it has been publicly displayed before, and, therefore, any attempt at repatriation could be prevented due to a lack of official protest, or a prior good faith transaction could be cited. “None” is self explanatory in that no provenance has been provided whatsoever, and “name only” simply means that a name has been given without any date.
The first observation regarding the data collected here is the wide number of ways through which legal control measures can be readily manipulated and ultimately circumvented by auction houses and sellers (Figure 15). For example, an object that does not satisfy the 1970 UNESCO Convention may meet the criteria of Council Directive 2014/60 and may also have been publicly displayed previously without any official protest. This situation would provide significant legal recourse for an auction house to counteract and prolong any attempts at litigation initiated by the Greek government, which may dissuade any such proceedings or make them ultimately unsuccessful.
Restitution cases are prolonged legal affairs that incur significant financial costs, and, as the Kunst der Kykladen case shows, such proceedings are not always guaranteed to be successful, especially if the object has been circulating on the market for a significant amount of time without any prior attempts to reclaim by the Greek government. National governments therefore need to be both pragmatic and realistic in deciding which restitution cases are worth pursuing, based upon the dual criteria of how legally robust the restitution claim is and how specifically important the object is concerning the cultural heritage of the country. As the data in Figure 15 show, the overwhelming majority of figurines circulating on the international antiquities market have extensive viewing histories, posing significant legal issues that could fundamentally compromise any restitution claim. Equally, a large proportion of these lots are diminutively sized or badly damaged fragmentary pieces of Cycladic figurines, which would offer little toward enriching the cultural patrimony of the Greek state or expanding existing knowledge of Cycladic archaeology. Through such obstacles, it can be appreciated why the Greek government may potentially be hesitant to pursue such litigation claims as few Cycladic figurine lots entail the dual criteria of being both legally viable and of a unique significance that would make their pursuit through the courts a worthwhile and cost-effective undertaking.
The “grandfather clause” is also a well-documented and easily available way for the 1970 UNESCO Convention to be bypassed.Footnote 94 This clause has a particular applicability with regard to Cycladic antiquities, as sellers can simply claim that a figurine has been inherited from their ancestors to obscure the fact that it has been looted. It therefore seems possible to partly conclude that the mounting nature of separate legal statutes and their individual provisions can have a proliferating, rather than a preventative, effect upon the Cycladic antiquities market as their contradictory nature and collective shortcomings offer mechanisms and loopholes through which the illicit trade can be conducted.
A additional observation relates to the factual nature of the provenance that has been provided. The truthfulness of any provenance that satisfies salient legal criteria should be approached with an element of caution, as provenance has long been noted as an easily malleable entity, which can be adjusted or manufactured to suit the needs of the seller.Footnote 95 Furthermore, auction houses have grown increasingly reticent within the current market climate to divulge the full details of an object’s trajectory,Footnote 96 and dealers can often withhold key evidence concerning the true source of an object.Footnote 97 Skepticism should also be applied even to those provenances that barely meet or fail to meet legal criteria, as designations such as “from an old European collection” are commonly applied in order to obscure the origins of recently looted objects.Footnote 98 Nonetheless, if the provenances provided are to be taken at face value, it means that between 2000 and 2019, 34 figurine lots have been sold upon the antiquities market that were openly listed as having a post-1970 provenance. In addition, since it is a general market reality that poorly provenanced objects or objects without provenance are highly likely to be recently looted,Footnote 99 the post-1970 provenance can be extended toward the “private collection only,” “none,” and “name only” categories, which takes the overall total to 60 figurine lots. In total, 31 of these lots were sold on the New York market, with an accumulated monetary value of $3,503,171, while 29 were sold in London, with an accumulated monetary value of £2,062,599.
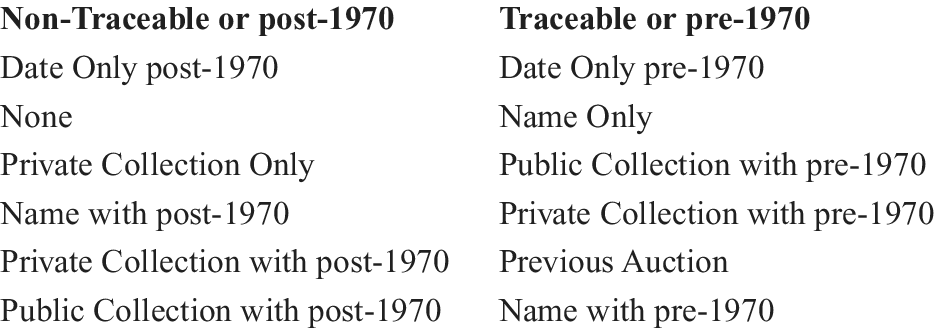
Rather than look at how these 12 different categories have played out across the years and auction houses, the present study has merged them in accordance with two ultimately defining characteristics: non-traceable or post-1970 and traceable or pre-1970 (Figure 16). Traceable is defined here as a provenance that, in the absence of a date, either lists an individual or private collection that could be contacted in order to establish a date. Some classifications give the appearance of being contradictory, such as those that are post-1970 but also traceable (that is, name with post-1970, private collection with post-1970, or public collection with post-1970). While these lots are traceable, as they do not meet the 1970 threshold, a legal claim could still theoretically be lodged to repatriate them.
Table showing how non-traceable or post-1970 and traceable or pre-1970 provenances are calculated.

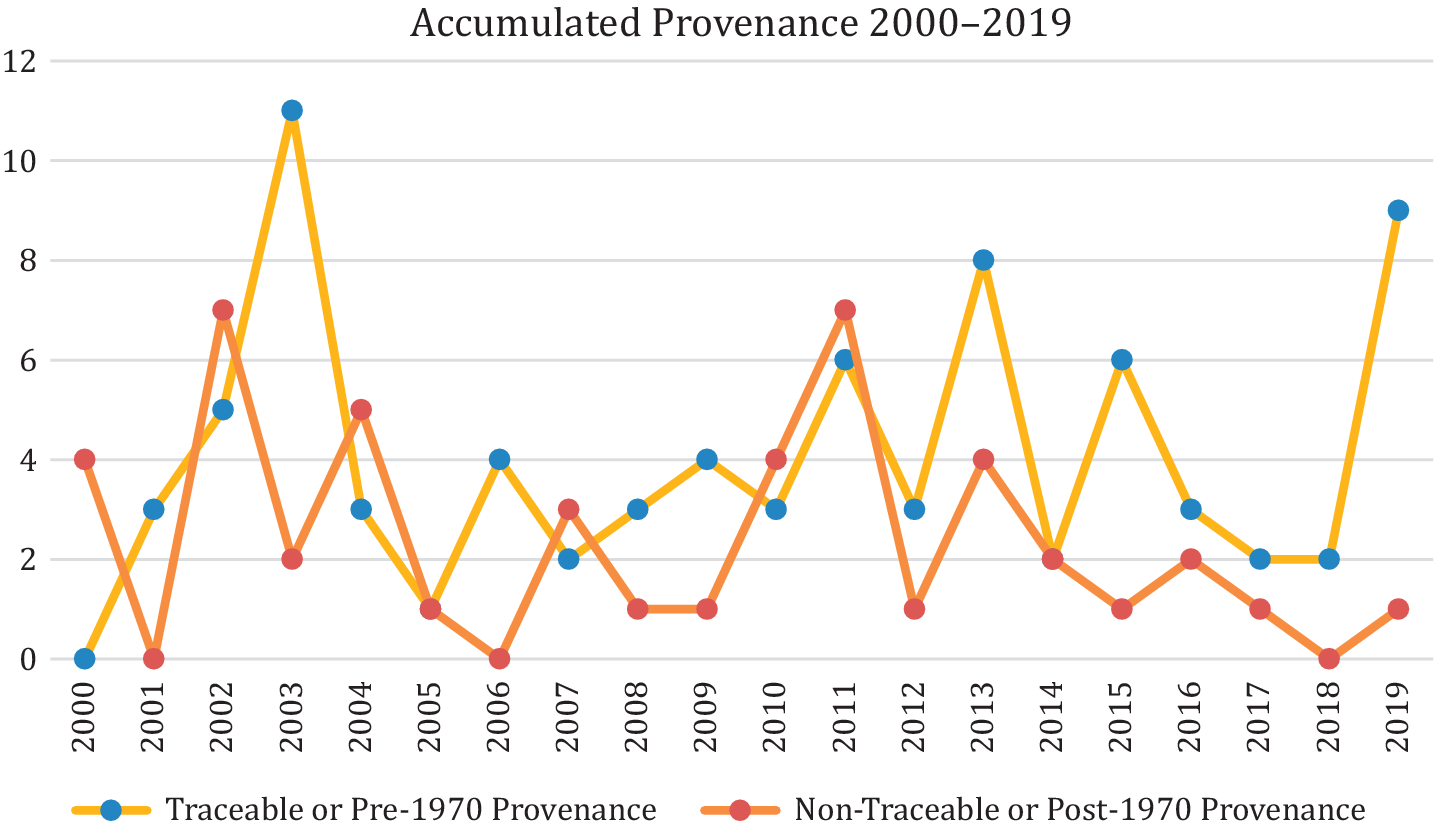
The ways in which these two broad distinctions of provenance play out chronologically across Sotheby’s, Christie’s, and Bonham’s is shown in Figure 17. A first look at this data could potentially infer an overall increase in traceable or pre-1970 provenance from 2013 onwards. However, once the commercial market context is considered, this picture alters significantly. Increasing concern among consumers regarding legality has caused a price premium to be generated for objects that are well provenanced and meet the 1970 standard.Footnote 100
Accumulated Cycladic figurine provenances, 2000–19.
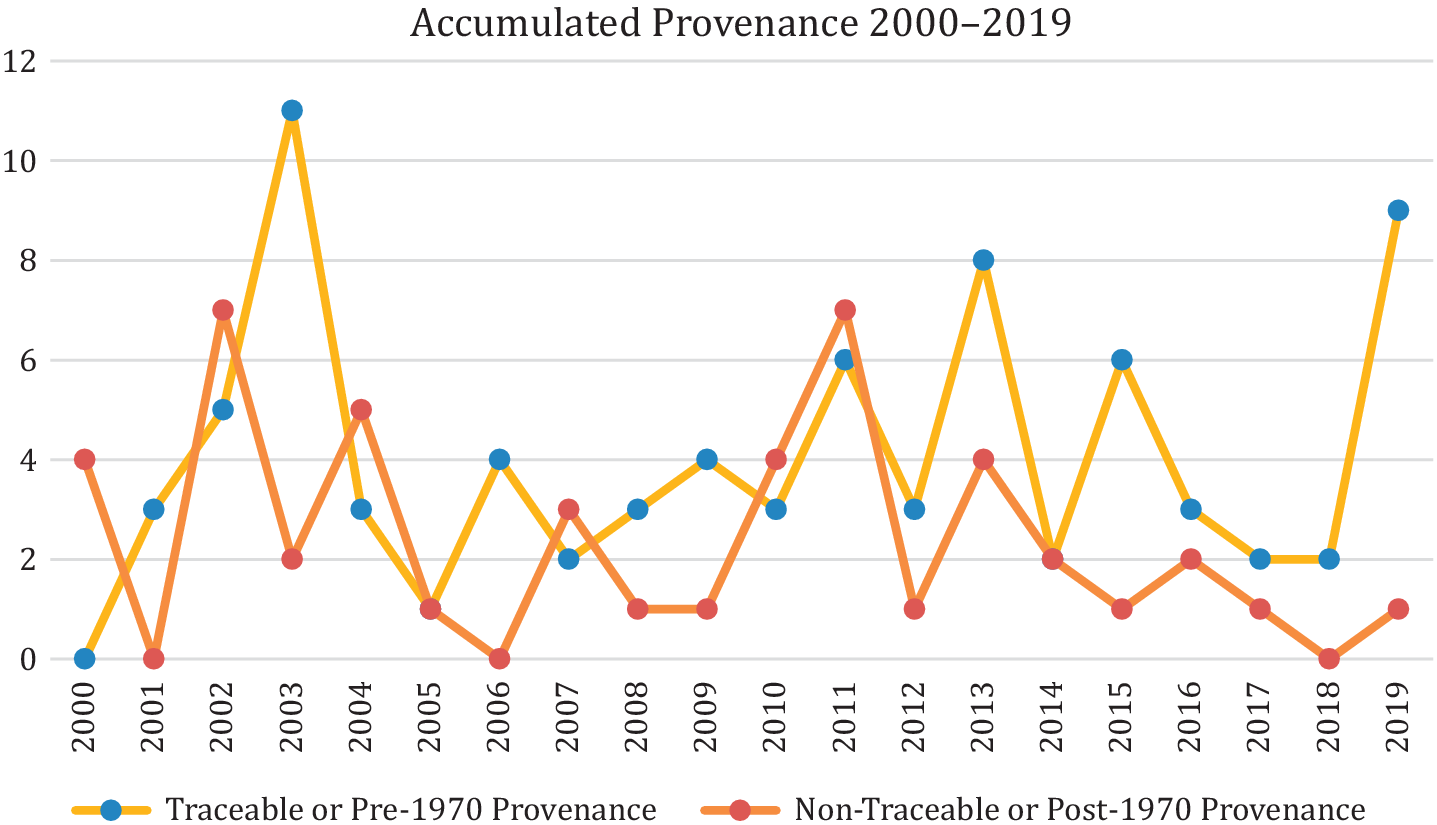
In a more general sense, antiquity market studies have shown that antiquities with “any” form of paperwork can receive as much as a 72 percent price increase.Footnote 101 Additional studies have also shown that there can be a 100 times price increase for objects that have the “very best” provenance – that is, those that satisfy the 1970 threshold.Footnote 102 There is therefore a very clear economic incentive for good provenance, and it could reasonably be deduced that the maintenance of high provenance standards since 2013 has had little to do with an increased ethical awareness but, instead, is grounded within a concerted drive toward profitability. This is reinforced by the data in Figure 18 that show that the average price for a traceable or pre-1970 provenance figurine lot is more than three times higher than that commanded for a non-traceable or post-1970 provenance lot on the New York market. The fact that this gulf in price is not reciprocated on the London market but, in fact, reversed, also appears to support the comparative profitability of the New York market.
Average Cycladic figurine provenance prices, based upon price data gathered from Sotheby’s, Christie’s, and Bonham’s between 2000 and 2019.

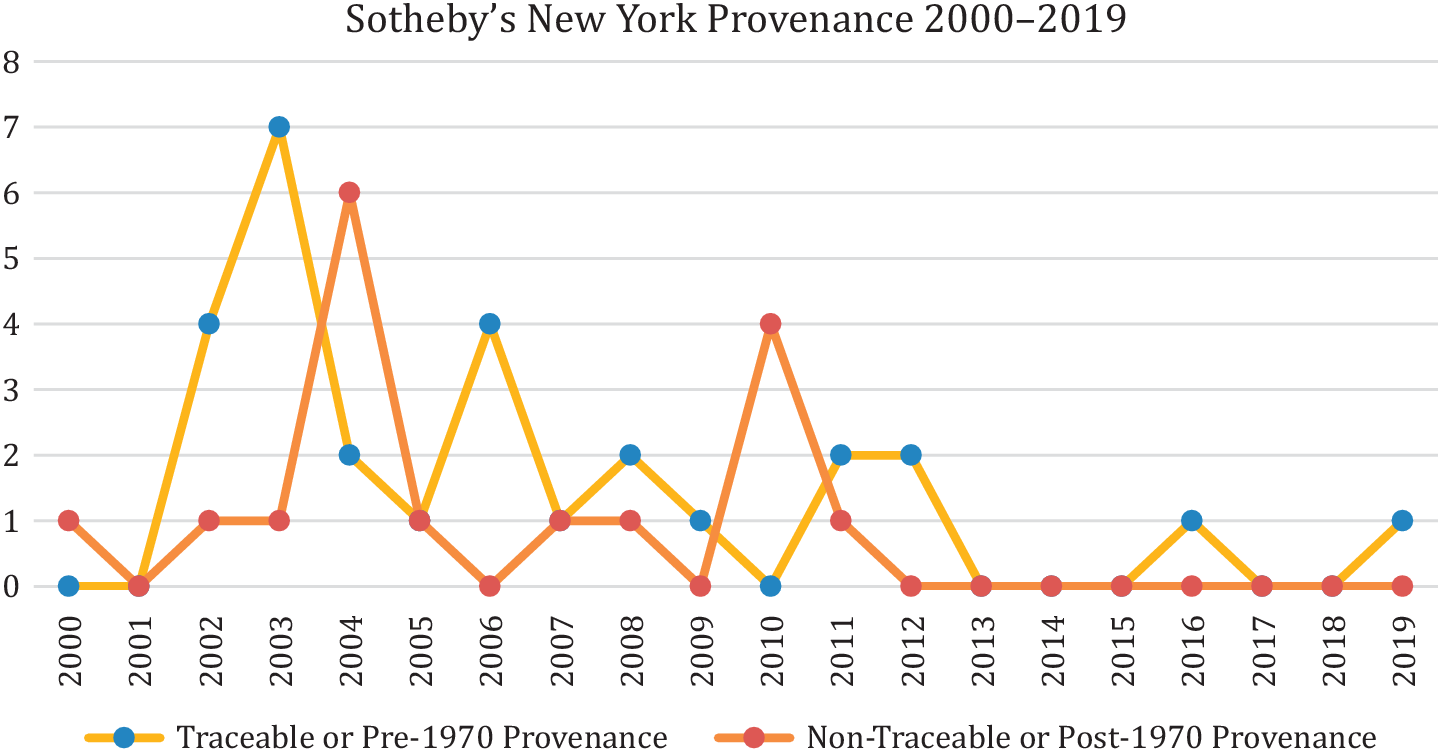
The idea of better provenance standards being symptomatic of commercial strategy is also corroborated by a comparison of individual auction house data on the New York and London markets. Since the enactment of their high-end business plan, Sotheby’s has seen decreasing sale lots from around 2000 onwards, with the overwhelming majority of these sales being conducted through their New York office. Since 2005, only 23 Cycladic figurine lots have been sold by the Sotheby’s New York branch, with 15 of these either having a traceable or pre-1970 provenance (Figure 19). Through their London office, Sotheby’s has sold only seven Cycladic figurine lots between 2000 and 2019.Footnote 103 The three sold in 2002 had a non-traceable or post-1970 provenance, while the two sold in 2003 and the two sold in 2010 had a traceable or pre-1970 provenance. The company has publicly stated that this decline in sales is due to a desire to only sell objects that “substantiate provenance going back far enough to satisfy our standards, which are, we believe, the most stringent in the market.”Footnote 104 Yet a comparison of the frequencies of sales and the respective character of their provenances appears to demonstrate a more concentrated concern with provenance via their New York office. Coupled with the price data in Figure 18, which shows that pre-1970 provenance only commands a higher price in New York, this picture would seem to suggest that the increase in provenance is primarily underpinned by economic initiative.
Sotheby’s New York provenance, 2000–19.

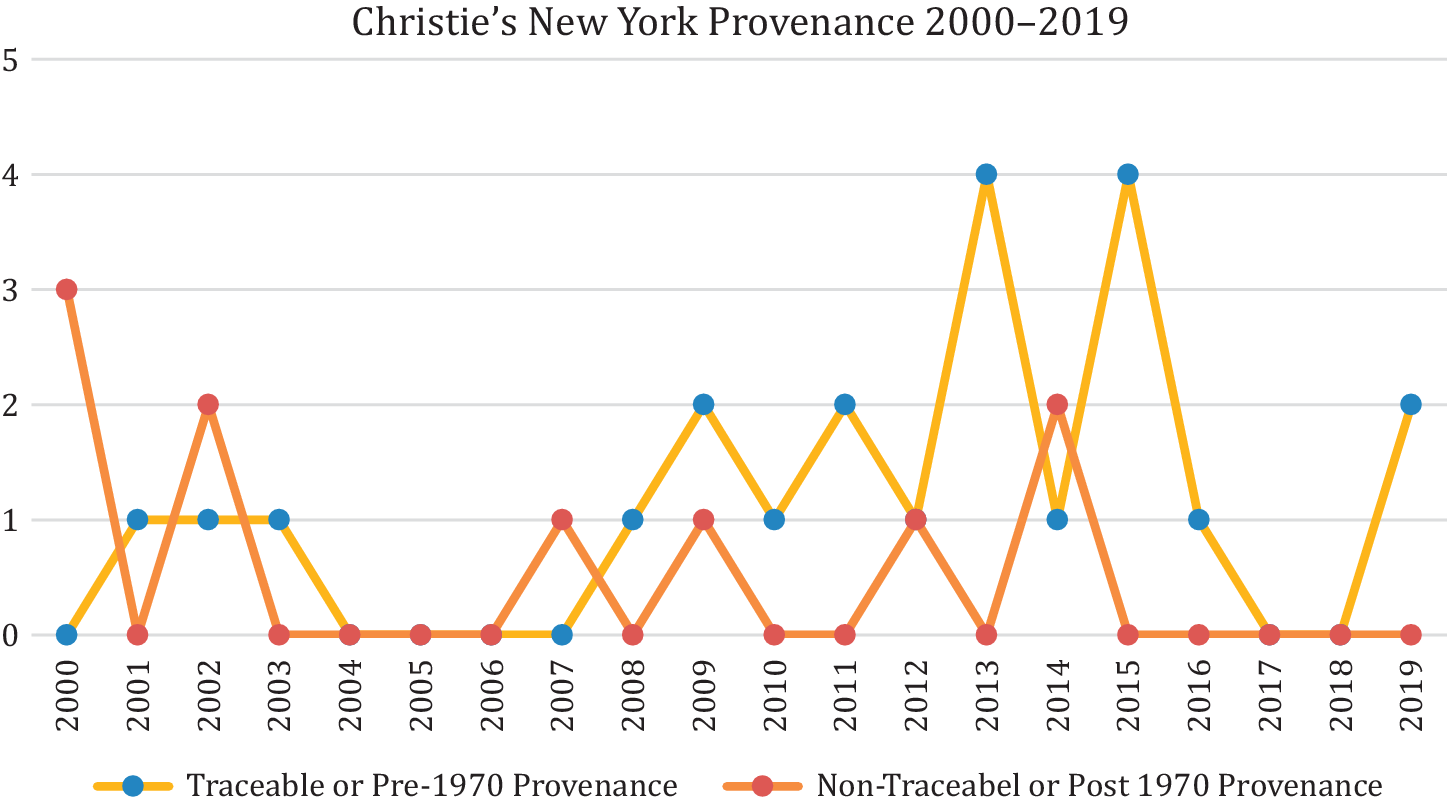
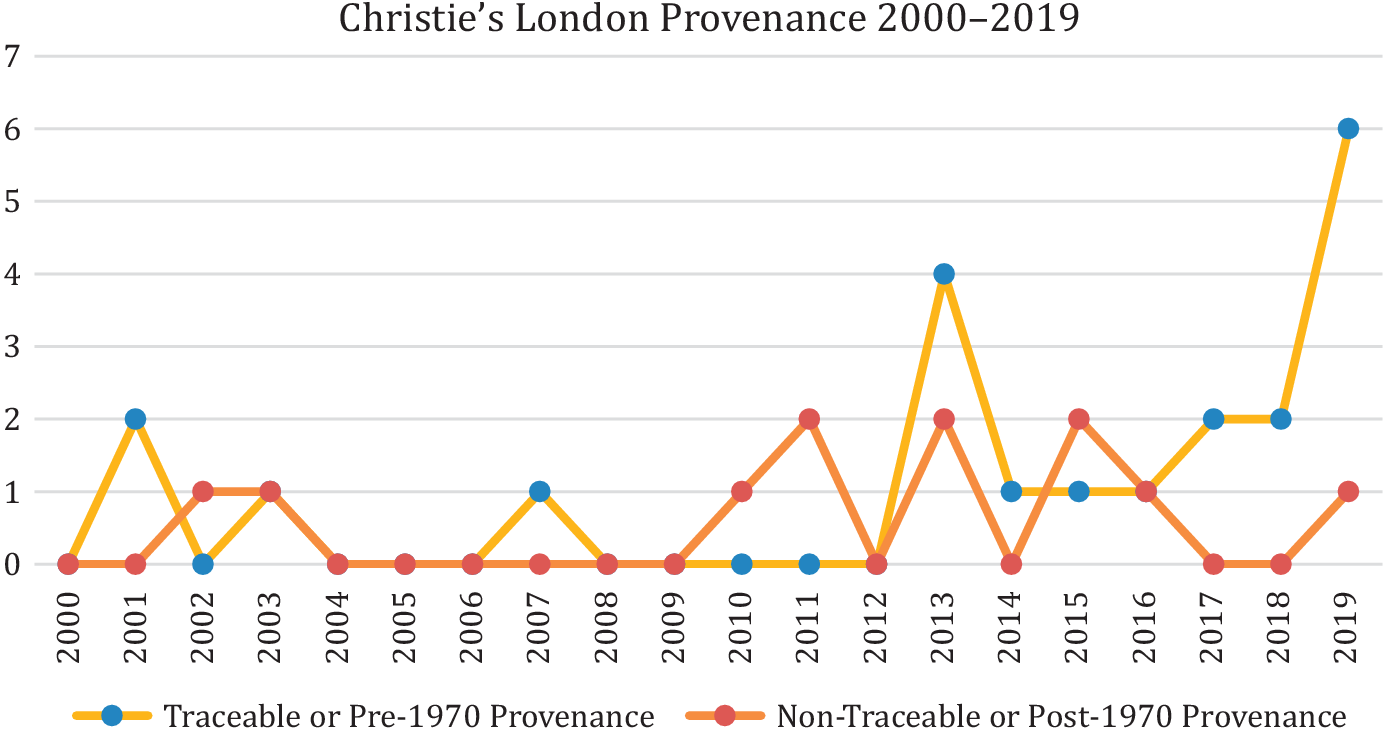
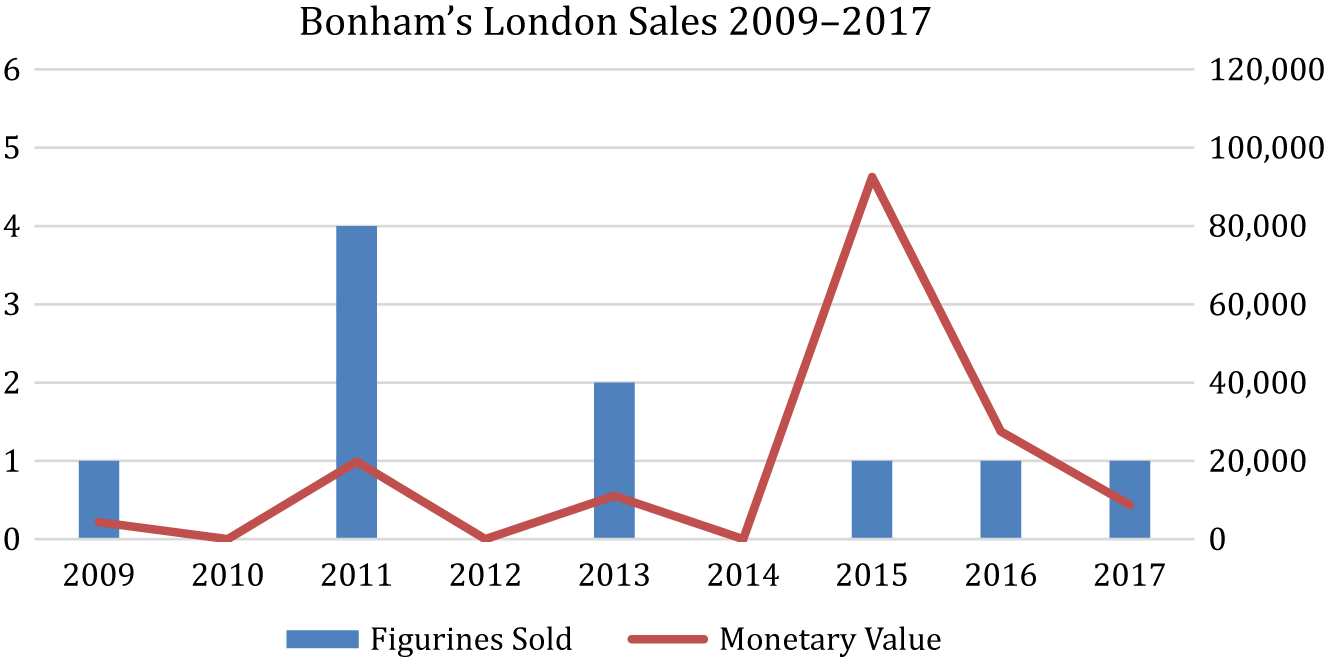
A similar picture can also be perceived when the provenance data of Christie’s is compared across their New York and London offices. The New York office has shown a general exponential increase in traceable or pre-1970 provenance since 2008, bar the year 2014 (Figure 20). By comparison, the data from their London office appears to show a more imprecise and generally diminished concern with traceable or pre-1970 provenance, barring the year 2019. Lastly, this trend is also reflected in the Bonham’s London provenance data, for of the 10 Cycladic figurine lots sold between 2009 and 2017, only three had a traceable or pre-1970 provenance (Figure 21).
Christie’s New York provenance, 2000–19.

Christie’s London provenance, 2000–19.

Overall, the data presented here suggests that there is a clear economic link between traceable or pre-1970 provenance and enhanced margins of profit. This observation is supported by the predominant adherence to higher standards of provenance on the New York market, where, on average, it commands higher sums than in London. This situation is simultaneously matched by a comparatively lax approach to provenance on the London markets, where its impact upon profitability is less pronounced. Any future analysis of the antiquities market that imputes that legal or ethical control measures have elicited a positive response from New York-based auction houses regarding increasing standards of better provenance must also make prime consideration of the operative economic incentives that underpin better provenance. These analyses must not incorrectly deduce that standards of provenance are improving purely through an altruistic desire by auction houses to reform standards within the market. The variations in price and provenance standards between New York and London also reiterate again the importance of cooperatively considering these two market centers in any future analysis of antiquity market data.
The “sweeping up” of sales
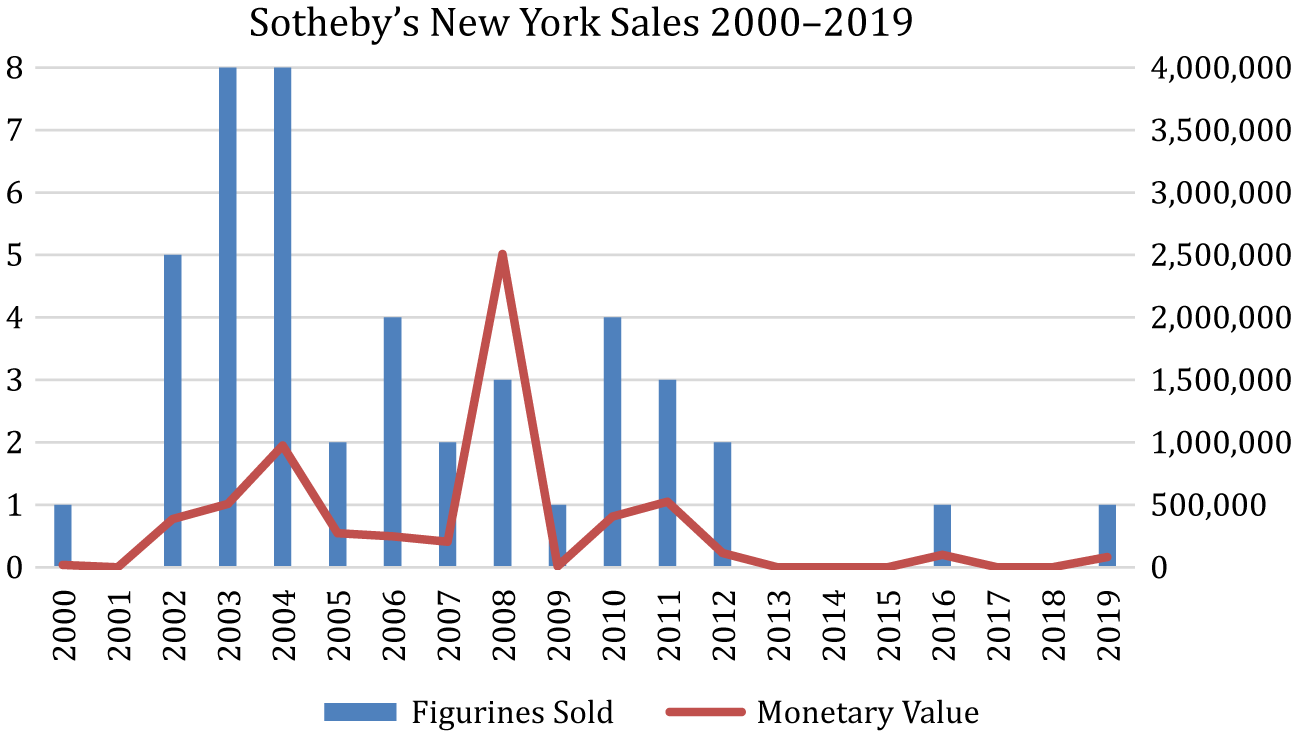
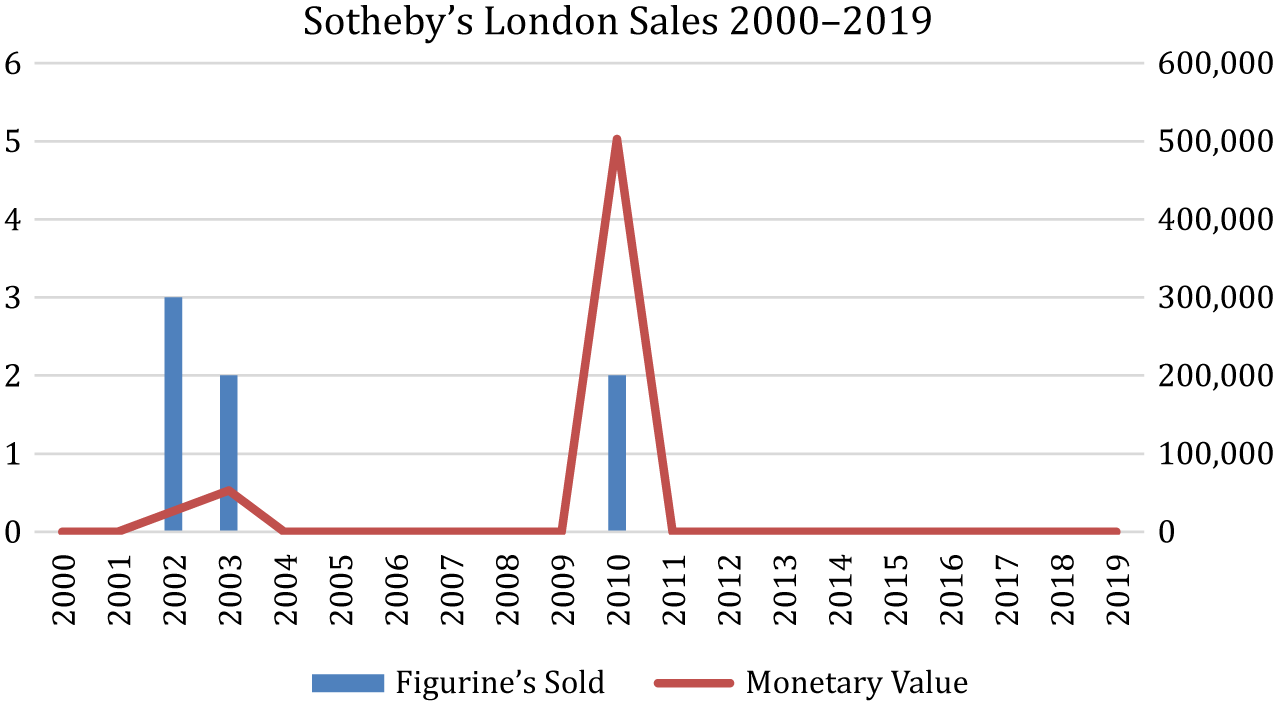
A final point regarding how antiquity market data can be most accurately read relates to the importance of interpreting the auction data of Sotheby’s, Christie’s, and Bonham’s in tandem. An initial consideration of the Sotheby’s New York sales data between 2000 and 2019, without consideration of the company’s high-end business policy, may incorrectly infer that the steady decrease in sales since the year 2004 is the outcome of successful control measures or of market reform (Figure 22). In a similar vein, the overall lack of sales via the Sotheby’s London office between 2000 and 2019 could also be viewed as being demonstrative of an especially successful application of market reform (Figure 23).
Sotheby’s New York sales, 2000–19.

Sotheby’s London sales, 2000–19.

Christie’s New York sales, 2000–19. Data not including the $16 million sale in 2010.

Yet the data gathered here appears to broadly support the high-end business model and reinforces individual particularities uncovered in previous scholarship. While it was common in the 1990s for Sotheby’s to offer between 600 and 900 lots per year, the implementation of their high-end business plan saw this number drop to between 100 and 200 lots per year by the 2010s, which was matched by an accompanying rise in the mean price per lot.Footnote 105 This observation explains the gradual decline in Sotheby’s New York sales and is supported by the price data displayed in Figure 11. Since the year 2003, Sotheby’s New York has not sold any Apeiranthos, Dokathismata, or Pelos figurine lots, which, as figurine types, command the lowest average prices on the New York market. Conversely, since the year 2000, of the 40 Cycladic figurine lots sold via its New York office, 20 were Early Spedos and 11 were Late Spedos, along with two out of the three Plastiras figurines sold on the antiquities market to date. These three figure types command the highest average prices on the New York market, and the fact that they account for well over three-quarters of the limited sale output by Sotheby’s New York provides fresh support for the prevalence of their high-end commercial strategy and discounts the salience of market control measures.
Furthermore, Sotheby’s announced in the early 2000s that it will only accept sale lots with a minimum value of $5,000.Footnote 106 This also correlates widely with the price data presented throughout this study, which have shown that, barring provenance, the same types of figurine and the same preservations levels (figurine, fragment, and head) consistently command higher prices on the New York market than they do in London. The enhanced likelihood of a lot fetching less than the equivalent of $5,000 on the London market and the overall drive toward profitability within the company therefore offers a more empirical explanation as to why only seven lots have been sold via the London branch of Sotheby’s between 2000 and 2019 rather than an indistinct correlation to a control measure or company statements about increasing compliance to ethical standards.
Since Sotheby’s appears to have removed itself from such a large aspect of the market due to its high-end business model, it would seem appropriate to broadly infer that this qualitative approach, irrespective of its purely commercial motivations, has still elicited a reduced number of Cycladic figurine sale lots upon the antiquities market as a whole. However, matching the overall decline of Cycladic figurine lots sold by Sotheby’s after 2004 is a simultaneous rise in figurine sales from Christie’s New York after 2007 (Figure 24) and a rise from Christie’s London after 2013 (Figure 25). While Christie’s business plan preserves elements of a qualitative model, which has seen its overall sales lots decrease from 600–900 lots per year in the 1990s to 300–700 per year in the 2010s, the company’s commercial strategy still maintains a fundamentally quantitative approach.Footnote 107 This quantitative model is supported not only by the comparatively higher sales volumes evidenced at Christie’s but also by their reduced probability when compared to those of Sotheby’s.
Christie’s London sales, 2000–19.

These higher sales volumes, coupled with diminished profits, suggest that Christie’s is essentially “sweeping up” the stray or undesirable Cycladic lots that Sotheby’s is not pursuing. This is also corroborated by the character of the lots offered by Christie’s, which has sold the only two schematic Apeiranthos figurines offered for sale between 2000 and 2019 as well as the majority of the schematic Pelos figurines sold. The picture is also corroborated by the condition of the lots sold since Christie’s has sold 38 intact figurines, 12 fragments, and 17 heads, while Sotheby’s has sold 34 intact figurines, 11 fragments, and 7 heads. Further evidence of a quantitative sale model contemporaneous to Sotheby’s qualitative model can be found at Bonham’s. Between 2009 and 2017, Bonham’s sold 10 Cycladic figurine lots, which were comprised of five intact figurines, four heads, and one fragment (Figure 26). While these sparing volumes may not suggest a marked surge in sales, the fact that half of their limited output was fragments and heads, and, moreover, that their yearly profits only twice topped £20,000, evidences a business model that is aligned with the lower end of the market.
Bonham’s London sales, 2009–17.

Overall, the evidence presented here suggests that Christie’s and Bonham’s are “sweeping up” the lower-value, higher-density lots that are being overlooked by Sotheby’s high-end business plan. This reading suggests that any future market analysis must not simply conclude that reduced sales within Sotheby’s are indicative of a reforming market or successful control measures. It must also not conclude that reduced sales of an object type within Sotheby’s will mean reduced sales of that object type within accumulated market sales. Instead, it is the case that the objects being passed over by Sotheby’s are being sold by auction houses whose business plans are more amenable to the nature and profitability of these items. The simultaneous operation of these three business models highlights the methodological need to extend the gaze within any prospective market analysis to as wide an extent as possible. This gaze must not view individual auction houses or their constituent branches in isolation but, instead, look across and within the “duopoly” of Sotheby’s and Christie’s in addition to considering smaller auction houses such as Bonham’s.
Conclusion
The analysis conducted above would appear to suggest that the primary utility of antiquity market data in fact relates to uncovering and providing a lens upon the commercial practices of auction houses rather than offering an outright demonstration of the success or failure of market control measures. It draws attention to the potentially duplicitous nature of auction house data (to some extent expected), which can give the incorrect impression of a reforming market when the salient commercial factors are not considered. This can be seen with the “shifting of sales” in relation to the UNSC Resolution 1483, the MOU between the American and Greek governments, and Council Directive 2014/60, where sales lots were funneled to different market centers in the immediate wake of the new legal restrictions. Regarding “provenance standards,” it can be seen through an enhanced adherence to higher provenance standards in the New York market where the bearing upon price became more positive and pronounced. Lastly, it can also be perceived through the “sweeping up of sales,” which demonstrates the divergent, but simultaneous, business models of separate auction houses that cumulatively covered a significant and diversified portion of the market. These three broad categories – “shifting of sales,” “provenance standards,” and “sweeping up of sales” – form the basis of the methodological guide points that could be employed within any future market analysis.
Their practical application dictates that the “shifting of sales” must adopt a transatlantic perspective that considers both the New York and London offices of auction houses before deducing any apparent reductions in sale volumes or profitability. “Provenance standards” must make prime consideration of the economic incentives for better provenance and not simply deduce that improving standards are due to a reforming market. It must also make special consideration of the altering standards of provenance between New York and London and the differing bearings within these markets of provenance upon price. The “sweeping up of sales” must look not only across and within the “duopoly” of Sotheby’s and Christie’s but also at smaller auction houses such as Bonham’s before imputing that overall sales have diminished.
The future and market regulation
Using the three methodological guide points created in this study, it may also prove instructive to perform another market analysis at some point in the not-so-distant future since it was suggested in early 2016 that Sotheby’s and Christie’s were looking to shift their business plans down market and target a higher-volume, lower-value business model.Footnote 108 This picture can be partly perceived in the data presented here. It may therefore prove insightful to return in another 10 years or so to conduct a new study, after another sizeable number of figurines has passed through the market. Such an approach will allow the prevalence of commercial contexts, albeit of a different quantitative nature, to be mapped out anew and incorporated into contemporary market studies.
The evidence presented here also helps to dispel a prominent notion among archaeologists that the antiquities market is not a proper area of academic study.Footnote 109 Going forward, then, it is necessary to consider how this antiquity market study and others like it may help to practically reform the market, if that is at all possible. It has previously been suggested that auto-regulation within the antiquities market ultimately does not work.Footnote 110 The study presented above adds to that narrative by demonstrating the contrast between the external public conduct of auction houses and their internal practices. Since auto-regulation cannot be relied upon, the issue of enforcement will naturally be raised – but enforcement to what exactly? The analysis conducted here has shown that compliance need not come at the expense of profit and that auction houses can nominally adhere to the statutes of the 1970 UNESCO Convention while simultaneously raking in the proceeds from looted material. One of the core weaknesses of the UNESCO Convention, then, must be that it does not affect the ability of auction houses to make profit from illicitly sourced antiquities. In fact, to the contrary, it has simply fashioned auction houses with a new and novel way to enhance profitability. This can now be added to its charge sheet of shortcomings, along with its inability for retroactivity and its provision for the “good faith” loophole. Under the weight of such deficiencies, its long-occupied position as the “golden standard” begins to erode.
Consideration then turns to which legislation would actually work. The “shifting of sales” section in relation to Cycladic figurines has shown that Council Directive 2014/60 and the MOU between America and Greece have not fared much better as sales were simply funneled via different market centers in the immediate wake of these laws. It has been suggested that the 1995 UNIDROIT Convention is the most comprehensive legislative package and that it could make a real difference in the fight against the illicit antiquities trade.Footnote 111 Yet the money, resources, and years ploughed into ensuring widespread adherence to the 1970 UNESCO Convention were vast, taking 32 years alone for Britain to become a signatory nation. The time and difficulties involved in implementing legislation, coupled with the widespread abuse uncovered in this study, raises serious questions as to whether new legislation, or, indeed, securing adherence to existing legislation, is in fact the best way forward.
The market in cultural objects will exist irrespective of any preventative measures undertaken. This has led many to believe that the solution is therefore to make the market as transparent, ethical, and legal as possible.Footnote 112 The data presented and discussed here has shown that the antiquities market can give the outward appearance of becoming more ethical and legal when it is emphatically not. Few adequate punishments have been developed in market nations that are becoming of cultural heritage crime.Footnote 113 Consequently, it has been proposed that the emphasis should be placed on persuasion among consumers, which can reduce demand.Footnote 114 However, it is suggested here that, rather than this persuasion being directed at the unquenchable appetites of buyers, it should instead be directed toward the court systems of market nations. If high courts can be persuaded that the vestigial adherence shown by auction houses to the 1970 UNESCO Convention or, indeed, to any relevant protocol in fact conceals an utter disregard for what is both legal and right, then the courts may start to rule against auction houses. This would mean that nominal compliance to the UNESCO Convention would no longer be a viable mechanism that auction houses could draw upon to exonerate themselves or their clients in restitution cases.
A very recent case in New York regarding a Corinthian geometric bronze horse from the eighth century bc may indicate a change of attitudes. Sotheby’s had planned to sell this object on 14 May 2018 for a reserve of $150,000–$250,000. However, the Greek government lodged a legal complaint, stating that the object was “cultural property that had been stolen from Greece.”Footnote 115 Sotheby’s duly counterclaimed to establish the legal right to sell and cited the object’s extensive history at auction, which dated back to Switzerland in 1967. In an unprecedented move, the judge ruled in favor of the Greek government and, when doing so, made specific reference to the fact that the Greek government was not acting out of commercial interest. If siding with governments instead of auction houses becomes the legal norm, even when auction houses nominally satisfy the UNESCO Convention, then this will drastically transform the landscape of the illicit antiquities trade. Objects that were once beyond the reach of the law, and thus profitable, will be placed firmly within the reach of the law and rendered less profitable. If it does not become the norm, then claimant nations can cite studies such as the one undertaken here, which demonstrate a manipulation of current legal standards by auction houses for economic gain.
No country has ever been completely successful in preventing the looting of its cultural heritage,Footnote 116 but this does not mean that countries should not try. It has been famously stated that “collectors are the real looters.”Footnote 117 While demand is in itself culpable, auction houses fuel and facilitate this demand and are the lynchpin in a chain that connects blue collar looters in source nations with white collar buyers in market nations. If this chain can somehow be broken, then the illicit flow of antiquities can be diminished. The study presented here suggests that the best way to break this proverbial chain is to inhibit the ability of auction houses to make a profit from illicit antiquities. The natural counter-argument is that this would drive the market underground. But, once driven underground, the ease with which it is able to operate openly and internationally would be drastically reduced, and it could then be more readily recognized and combated for what it truly is: crime.
Acknowledgments
The author would like to thank Yannis Galanakis, Simon Stoddart, Cyprian Broodbank, and the three anonymous reviewers for their enthusiastic and insightful comments on earlier drafts of this article.