INTRODUCTION
Amazonia is one of the world's leading suppliers of timber and the Amazonian timber industry is an important source of jobs and income for the region's economy (Lentini et al. Reference Lentini, Verísimo and Pereira2005). These economic benefits, however, come with environmental costs, particularly deforestation (Fearnside Reference Fearnside, Val and dos Santos2010). Conventional timber harvests affect forest structure and composition (Veríssimo et al. Reference Veríssimo, Barreto, Mattos, Tarifa and Uhl1992; Johns et al. Reference Johns, Barreto and Uhl1996; Monteiro et al. Reference Monteiro, Souza, Pantoja and Gerwing2004), increase forest susceptibility to fire (Holdsworth & Uhl Reference Holdsworth and Uhl1997; Nepstad et al. Reference Nepstad, Veríssimo, Alencar, Nobre, Lima, Lefebvre, Schlesinger, Potterk, Moutinho, Mendoza, Cochrane and Brooks1999), reduce above-ground biomass (Gerwing Reference Gerwing2002) and facilitate access to forests. Greater access to forested areas is associated with increased hunting and resource extraction activities that, in turn, change abundance, richness, composition and behaviour of various wildlife species (Laurance Reference Laurance, Grajal, Fimbrel and Robinson2001).
Foresters have proposed various measures to minimize the environmental impacts of logging and to guarantee its sustainability (Putz & Pinard Reference Putz and Pinard1993; Amaral et al. Reference Amaral, Veríssimo, Barreto and Vidal1998). While these technical and logistical improvements significantly reduce logging impacts (Putz et al. Reference Putz, Sist, Fredericksen and Dykstra2008) at a low economic cost (Barreto et al. Reference Barreto, Amaral, Vidal and Uhl1998), approximately 62% of logging operations in the Amazon remain unplanned and logging continue to expand into new areas (Lentini et al. Reference Lentini, Verísimo and Pereira2005), damaging both the forest and the timber industry in the long run. Most logging activities in the Amazon remain illegal (Fearnside Reference Fearnside, Val and dos Santos2010). It is estimated that 70% of the all timber harvested in the Amazon region lacks certification of origin (N. Higuchi, personal communication 2008).
The illegal nature of timber harvests makes it hard to locate and quantify the overall amount of timber harvested, largely because logging often does not generate large canopy gaps visible on satellite images (Nepstad et al. Reference Nepstad, Veríssimo, Alencar, Nobre, Lima, Lefebvre, Schlesinger, Potterk, Moutinho, Mendoza, Cochrane and Brooks1999). The situation is even more complex in regions where other logging impacts are not visible, such as logging of flooded forests where timber can be extracted without the use of logging roads or logging decks (Schöngart & Queiroz Reference Schöngart, Queiroz, Junk, Piedade, Wittmann, Schöngart and Parolin2010). Modern remote sensing techniques, such as the PRODES project (INPE [Instituto Nacional de Pesquisas Espaciais] 2010), are capable of detecting selective logging on satellite images, but only for a few years before the canopy closes and hides the canopy gaps (Asner et al. Reference Asner, Knapp, Broadbent, Oliveira, Keller and Silva2005). Even then, it may be unclear whether a given clearing is the result of selective logging or a natural tree fall. Field studies are thus essential to complement and validate remote sensing analyses that seek to map the distribution of illegal timber harvests.
The spatial distribution of harvests is typically determined by the manner in which a given resource is harvested. Harvest intensity is often inversely proportional to the distance to the resource (Murali et al. Reference Murali, Uma Shankar, Uma Shaakeer, Ganeshaiaah and Bawa1996; Uma Shaanker et al. Reference Shaanker, Ganeshaiah, Nageswara and Aravind2002), since the time and energy required to extract it increase with distance. However, this pattern can vary, depending on the economic value of the resource, since more valuable resources justify greater extraction expenses. Models constructed to understand resource extraction patterns are often based on ecological models that describe animal behaviour and microeconomics, which have been used in human ecology to estimate human behaviour patterns (Begossi et al. Reference Begossi, Clauzet, Hanazaki, Lopes, Ramires and Silvano2009). Optimal-foraging models assume a trade-off between the cost and benefit associated with the search for food, and have been used to analyse resource extraction behaviour for human populations, such as fisherfolk (Begossi et al. Reference Begossi, Silvano, Ramos, Brebbia and Antunes do Carmo2005). These models can be useful tools for understanding what drives the spatial distribution of forest resource use by human populations, and may help identify potential sites of illegal activities, such as logging.
Determining the ecological impacts of illegal logging at the local scale, proposing control measures and understanding the spatial distribution of harvests requires quantification of their effects on the populations of target species, as well on forest structure and composition. Some Amazonian species, such as bigleaf mahogany, Swietenia macrophylla (Meliaceae) and Virola surinamenisis (Myristicacae), are already showing signs of unsustainable logging (Veríssimo et al. Reference Veríssimo, Barreto, Tarifa and Uhl1995; Macedo & Anderson Reference Macedo and Anderson1993).
The primary cause of extinction among timber species is a shift in population age structure as the adult individuals that supply most seeds are removed (Martini et al. Reference Martini, Rosa and Uhl1998). This leads to a drop in young individuals, as regeneration is compromised by the lack of seeds or by the loss of environmental conditions suited for seedling establishment. In populations with a high recruitment rate, stem density drops exponentially with increasing diameter, and departures from this pattern can indicate an alteration in age structure. Peres et al. (Reference Peres, Baider, Zuidema, Wadt, Kainer, Gomes-Silva, Salomão, Simões, Franciosi, Valverde, Gribel, Shepard, Kanashiro, Coventry, Yu, Watkinson and Freckleton2003) showed that overharvesting Brazil nut seeds (Bertholletia excelsa, Lecythidaceae) reduced the number of young trees in harvested stands, representing a population bottleneck that they considered could lead to local extinction. Knowledge of population structure, growth rate and reproduction of timber species is necessary to quantify population-level effects of selective logging and to define ecologically sustainable cutting levels (Nebel & Meilby Reference Nebel and Meilby2005).
Determining the growth rates and life histories of timber species is an essential step toward guaranteeing sustainable logging (Brienen & Zuidema Reference Brienen and Zuidema2006). Growth-oriented logging (GOL; Schöngart Reference Schöngart2008) is a forestry management model that proposes a minimum cutting diameter (MCD) based on the annual increment rate of each species, obtained by analysing growth rings. Growth ring-analyses in tropical forests remain controversial, but have been widely used in flooded areas, where variation in growth between high and low water periods generates easily discernible annual rings (Worbes & Junk Reference Worbes and Junk1989). Studies based on this model have shown that the rate of diameter growth in trees in forests flooded by black water is very low (Schöngart et al. Reference Schöngart, Piedade, Wittmann, Junk and Worbes2005; Fonseca et al. Reference Fonseca, Piedade and Schöngart2009), highlighting the vulnerability of these communities to selective logging (Schöngart Reference Schöngart, Junk, Piedade, Wittmann, Schöngart and Parolin2010). However, the growing demand for Amazonian timber for the plywood and construction industries has increased pressure on flooded forests, such as those in the Anavilhanas archipelago, which typically have a high concentration of lightweight timber (Macedo & Anderson Reference Macedo and Anderson1993; Lima et al. Reference Lima, dos Santos and Higuchi2005).
The Anavilhanas archipelago is located in central Amazonia, on the lower Negro river, in the Anavilhanas National Park. Logging pressure in the Park is strong due to its proximity to the city of Manaus, an important timber market, and because the Negro river provides easy access for loggers. The archipelago's size and the complex maze of waterways between the islands make it difficult to detect illegal logging. In order to guarantee the long-term survival of timber species and effectively curb illegal activities in the Park, authorities require better information about the spatial distribution of illegal logging in the archipelago, the behaviour of loggers and the effects of logging on the population structures of the most sought-after species.
The objectives of this study were to (1) determine stand densities and spatial distributions of the most sought-after timber species in the Anavilhanas archipelago, (2) describe the spatial distribution and intensity of logging, (3) determine whether current logging levels are altering the size structures of timber species populations, (4) quantify the growth rates of the most-exploited species, and (5) test the hypothesis that the spatial distribution of logging coincides with the spatial distribution of human communities in the Park's buffer zone.
METHODS
Study area and study taxa
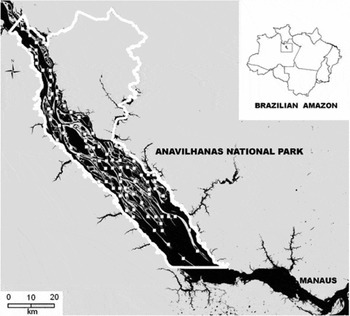
The Anavilhanas archipelago is located in Brazil's Anavilhanas National Park in Central Amazonia (Fig. 1), and its southern border is c. 40 km north-west of the city of Manaus (03° 02′S 60° 22′W). The Park protects about 430 islands, in addition to a large block of upland forest, in an area of 350 000 ha. The archipelago is situated in the channel of the Negro River, a black-water river poor in nutrients, but the eastern side of the archipelago receives nutrients from the Branco River (Irion et al. Reference Irion, Junk, Mello and Junk1997). Forests on the islands are subject to a flooding cycle in which water level can vary up to 10 m between low and high water periods (Junk Reference Junk, Holn-Nielsen, Nielsen and Balslev1989). Mean annual rainfall is 1750–2500 mm, with most rain falling between December and May, and mean annual temperature is 24–26 °C (IBAMA [Instituto Brasileiro do Meio Ambiente e dos Recursos Naturais Renováveis] 1999).
Study area. The white line represents the border of the Anavilhanas National Park. White squares indicate the locations of transects. The Negro river is represented in black, and islands and the mainland in grey.

The islands are elongate, with sediment accumulating on one side and the current actively eroding the other (Leenheer & Santos Reference Leenheer and Santos1980). Vegetation physiognomy varies with island size. Larger islands typically have three forest strata, the highest of which is composed of trees c. 25 m tall, while smaller islands generally have lower vegetation that may be entirely underwater during floods (Piedade et al. Reference Piedade, Junk, Adis and Parolin2005). Plant species on the islands are distributed with respect to topography, based on their varying adaptations to flood dynamics (Ferreira Reference Ferreira2000).
The most sought-after timber species at present, according to records from illegal timber intercepted by authorities of IBAMA, are seringueiras (Hevea spp., Euphorbiaceae), represented by Hevea guianensis Aubl. and Hevea spruceana Muell Arg, virola (Virola surinamensis (Rol.) Warb. Myristicaceae), arapari (Macrolobium acaciifolium (Benth.) Benth, Fabacaeae), jacareúba (Calophyllum brasiliense Camb, Clusiaceae) and species of Lauraceae, including louro inamuí (Ocotea cymbarum Kunth.), louro preto (Nectandra spp.) and louro abacate (Aniba spp.) (IBAMA 1999). These species are tolerant to flooding, especially M. acaciifolium, which can survive floods of up to 7 m (Wittmann Reference Wittmann, Schöngart, Brito, Wittmann, Piedade, Parolin, Junk and Guillaumet2010). The fruits of these species are important food sources for the local fauna.
Hevea spp., M. acaciifolium and V. surinamensis have low wood density (0.40–0.50 g cm − 3; Schöngart & Queiroz Reference Schöngart, Queiroz, Junk, Piedade, Wittmann, Schöngart and Parolin2010) and are used as disposable scaffolding in construction. C. brasiliense and Lauraceae species are hardwoods, with wood density of approximately 0.60 g cm−3, and are typically used as flooring or for furniture.
Sampling design
In order to ensure systematic and homogeneous sampling across the entire archipelago, we used ArcGIS 9.2 software to overlap a grid of 3 × 3 km cells over a georeferenced LANDSAT satellite image (scale = 1: 500 000 cm) of the study area obtained during the dry season. Points where the grid intercepted islands were used to locate 84 transects. Transects were 100 m long, except on islands narrower than 100 m, in which case transect length was the width of the island. Transects were placed perpendicularly to the long axis of each island in order to capture the topographic variation from edges to interiors. Data were collected in January and February 2009, and between August 2009 and January 2010.
Stand density
Stand density for each species was quantified via density estimates that were corrected for detection probability using the method of distance sampling along linear transects (Buckland et al. Reference Buckland, Anderson, Burnham and Laake1993). An observer walked a trail searching for target species and recorded the perpendicular distance from the trail to each individual found. One of the fundamental assumptions of the method is that the probability of detecting an item decreases with its increasing distance from the trail (Buckland et al. Reference Buckland, Anderson, Burnham and Laake1993). This method allows selection of the optimal detection function to estimate the proportion of undetected individuals (Thomas et al. Reference Thomas, Buckland, Burnham, Anderson, Laake, Borchers and Strindberg2002). All trees of the target species with diameter at breast height (dbh) > 10 cm (measured 1.3 m above ground level) sighted from the trail were marked and their dbh and perpendicular distance from the trail recorded. We used liana cover and tree size (dbh) as co-variables that might influence detection. The coverage of lianas in front of each tree, which hampered detection, was categorized as: 1 for 10–30% coverage, 2 for 30–60% coverage, and 3 for > 60% coverage.
Logging distribution and intensity
We georeferenced every logging stump found in transects and during travel between transects. Harvest intensity was obtained in the same manner as live tree density, by correcting estimated density with detection probabilities for stumps found on transects. Some species, such as the Lauraceae spp. and rubber trees, were grouped into higher taxa for analysis, because it was not possible to identify the older stumps to species level. Density estimates of live trees were thus also based on these higher taxa, to be comparable to the estimates of harvested trees.
Distances from human settlements to islands
Approximately 50 human communities and smaller settlements (groups of 2–3 houses) currently exist within the buffer zone of Anavilhanas National Park. For the 30 human communities closest to the Park border, we used geographic information system (GIS) tools and a dry-season LANDSAT image to calculate the shortest river distances from each settlement to each transect, using the most likely travel routes, and then calculated a mean distance for each human community. Communities that were very close to each other (< 5 km apart) were grouped together due to high spatial correlation, and these groups used as sampling units in the analyses. We used the same methods to calculate river distances from transects to Manaus city.
Commercial timber value
The mean market value of timber was obtained via 15 interviews carried out in sawmills in the towns of Novo Airão, Manacapuru, and Manaus. The accumulated value of timber per transect was calculated by multiplying the average market value of sawn timber of each species by the number of individuals of that species found in the transect, and summing the values of each species in each transect. For example, the species less valuable have the score 1, and the second have the score 1.5, because this is the proportional difference of the market prices between this two species. We multiplied the number of individuals from each taxon with the respective score and summed all these values for each transect.
Tree growth rate
Growth rates were estimated via dendrochronology, using 20 samples per species. We restricted analysis of the Lauraceae species to Ocotea cymbarum Kunth. and analysis of the rubber-tree species to Hevea spruceana Muell Arg, in order to avoid species-level variation in growth rates. Wood samples were collected using a dendrochronology drill, then glued to a wooden support and polished with sandpaper. The height of each tree was measured in the field using a clinometer. Wood samples were analysed in the INPA/Max-Planck dendrochronology laboratory. Rings were identified by their anatomic structures and measured with a LINTAB measuring system and TSAP-Win software (Time series analyses and presentation, Rintech, Heidelberg, Germany).
Data analyses
We estimated stand and stump densities separately for each taxon with the programme DISTANCE 6.0 (Buckland et al. Reference Buckland, Anderson, Burnham and Laake1993) after testing different models for the distributions of detection distances. The model that best fitted the data for V. surinamensis and C. brasiliense was the key-function uniform and the cosine series expansion; for M. acaciifollium a key-function hazard-rate and the cosine series expansion; for Hevea spp. the key-function half-normal and the simple polynomial series expansion; and for Lauraceae spp. the key-function uniform and the simple polynomial series expansion. The best-fitting model for estimating stump density was a key-function uniform and the cosine series expansion. To improve the fit of detection curves and thus the density estimates, it was necessary to truncate the distributions of C. brasiliense, M. acaciifolium and Hevea spp. to 30 m and the distributions of Lauraceae spp. to 23 m. We included tree size and liana coverage as covariables in preliminary analyses, but they had little effect on fit and were not used in the final models. To estimate total logging intensity for the entire archipelago, we used all stumps recorded in transects, regardless of species. The best-fitting model was the key-function and cosine series expansion truncated at 30 m. Densities were estimated with 95% confidence interval.
We used stumps in transects, and stumps recorded in travel between transects or indicated by local residents, to produce logging maps. Logging intensity was quantified as the number of stumps in a 3 km2 grid cell built with GIS overlapped on the satellite image.
Effects of logging intensity were estimated for three size classes (10–< 20, 20–< 40 and ≥ 40 cm; except for V. surinamensis, for which the classes were 10–< 30, 30–< 60 and ≥ 60 cm) of each species using generalized linear regression (GLM). Logging intensity here refers to the combined harvests of all targeted species, under the assumption that the harvest of any one species implies the presence of loggers on the site. Since these are count data with high variance and a large number of zeros, we used a Poisson error and a logarithmic function for the regressions.
The model we tested to determine the relationship between the spatial distribution of human communities and logging intensity for all species incorporated river distance to human communities and the cumulative value of timber in each transect as explanatory variables. The model was tested via permutation (1000 permutations). We also tested another version of this model in which river distances between transects and human communities were substituted by river distances between transects and Manaus city.
Mean rates of annual increment for the target species were based on annual rates of radial increment of growth rings. The mean-increment rate was calculated for each sample and these data used to generate a mean value for each species. Cumulative growth curves were constructed from the annual-increment rates and estimated age for each sample. Individual cumulative curves were used to model a mean non-linear (sigmoidal) curve with the equation y = a/(1+(b/x)c) (Schöngart Reference Schöngart2008). The minimum cutting diameter and the adequate harvest cycle for each species were obtained using methods proposed by Schöngart (Reference Schöngart2008).
RESULTS
Spatial distribution of stand densities and illegal logging
We marked 2332 trees in 8 km of linear transects. The most abundant taxon was Hevea spp. (1365 individuals), followed by V. surinamensis (410 individuals) and M. acaciifolium (315 individuals). Lauraceae spp. and C. brasiliense were less common, with 164 and 79 individuals, respectively. Density estimates followed the same ranking. Hevea spp. density, 41.5 trees ha−1, CI = 56.1, was followed by V. surinamensis (14.9 trees ha−1, CI = 24.5), M. acaciifolium (12.3 trees ha−1, CI = 18.5), Lauraceae spp. (5.2 trees ha−1, CI = 8.3) and C. brasiliense (2.1 trees ha−1, CI = 4.6).
On average, there were stumps of 3.2 trees ha−1 that had been cut illegally in the region (CI = 4.4). The taxa showing the greatest evidence of past logging were: Lauraceae spp. (28.5%), Hevea spp. (17.9%), V. surinamensis (12%), M. acaciifolium (10.4%) and C. brasiliense (4.8%). Together, the target species in this study accounted for 73.6% of all stumps. Other species that could be identified accounted for 10.2% of stumps, including castanharana (Eschweilera ovalifolia), cajurana (Simaba sp.), itaúba da várzea (Mezilaurus itauba), munguba (Pseudobombax munguba), itaubarana (Acosmiumn nitens) and tento (Ormosia sp.); the remaining 16.2% of stumps were too decomposed to identify.
The mean market value of timber in sawmills of Novo Airão, Manacapuru and Manaus obtained in interviews in 2009 was US$ 197 m−3 for soft woods (V. surinamensis, Hevea spp. and M. acaciifolium), US$ 492 m−3 for C. brasiliense, and US$ 591 m−3 for Lauraceae spp. These values reflect the price of processed timber sold to the final consumer and are thus higher than those obtained by loggers.
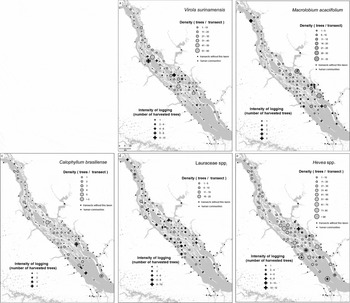
Spatial distributions of species and logging indicate different patterns for each species. For V. surinamensis (Fig. 2a), stand densities and logging intensity were both highest in the central and northern regions of the archipelago. M. acaciifolium (Fig. 2b) is widely distributed throughout the archipelago, with densities that typically vary from one to five individuals per transect, but logging is essentially restricted to the southern region. Stem density of C. brasiliense (Fig. 2c) was low throughout the area, the species was absent from many transects, and the few stumps we found were concentrated in the southern region. Stands of Lauraceae spp. (Fig. 2d) were concentrated on the western banks of the archipelago, but logging of these species was scattered throughout the study area, in contrast to the other target species. The most abundant taxon, Hevea spp. (Fig. 2e), was present in almost every transect, generally at a density exceeding five trees per transect, but logging of these species was concentrated in the southern portion of the archipelago.
Spatial distribution of density and logging intensity of (a) V. surinamensis, (b) M. acaciifolium, (c) C. brasiliense, (d) Lauracaeae spp. and (e) Hevea spp. in the Anavilhanas archipelago. Scale: 1: 500 000 cm

Optimal foraging model applied to illegal timber harvests
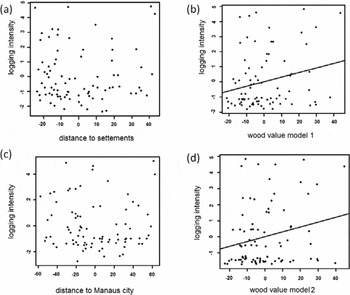
The first model that included river distance from human communities and the accumulated timber value in each sampling unit had low explanatory power for logging intensity. There was no relation between logging intensity and river distance (Fig. 3a), and only a slight positive effect (bst = 0.029, p < 0.05) of timber value (Fig. 3b). The second model including river distance from Manaus and timber value showed no relation between distance and logging intensity (Fig. 3c), and timber value (Fig. 3d) contributed significantly to the model (bst = 0.03, p < 0.05).
Partial regression plots of logging intensity versus (a) distance to settlements, (b) wood value for model 1, regression using communities distance, (c) distance to Manaus city and (d) wood value for model 2, regression using city distances.

Effects of logging on population structure
Densities in some size classes suggest that some species had suffered negative impacts of past logging, but some, surprisingly, had positive relationships with the number of cut stems. For V. surinamensis, density of both the smallest stems (R2 = 0.13, p < 0.01) and the largest stems (R2 = 0.18, p = 0.03) declined with increasing logging intensity. Lauraceae spp. also showed a drop in the density of the smallest size class (10–< 20 cm dbh; R2 = 0.17, p < 0.05), but an increase in the density of the largest size class (≥ 40 cm dbh). For this taxon, due to the higher number of stumps found, it was possible to do a species-specific analysis. The intensity of Lauraceae harvest did not have an effect on density of Lauraceae spp. in the first diameter classes, but there was a positive effect on the largest size class (R2 = 0.2, p < 0.05).
M. acaciifolium showed a trend towards higher densities of the intermediate size class with increased logging (R2 = 0.08, p < 0.05). For the smallest and intermediate diameter classes of Hevea spp., stem density increased with logging intensity (10–< 20 cm dbh: R2 = 0.14, p <0.001; 20–< 40 cm dbh: R2 = 0.13, p < 0.001, respectively). For C. brasiliense there was no effect of logging intensity on any diameter class.
Tree growth rates
The mean annual rate of species dbh growth varied from 4.14 to 7.78 mm (Table 1). The fastest-growing species was O. cymbarum (Lauraceae) and the slowest-growing C. brasiliense. Mean age varied from 66 to 101 years. The youngest trees were M. acaciifolium and the oldest were C. brasiliense.
Mean annual growth (IC) ± standard deviation, maximum and minimum growth rates, wood density, mean diameter at breast height (DBH), mean age, minimum cutting diameter (MCD) and cutting cycle (CC) for each species (n = 20). *For this taxon was not possible to determine MCD and CC.

In order to determine the minimum cutting diameter and the harvest cycle (Table 1), we initially examined relationships between dbh and tree height. These were significant for O. cymbarum (R2 = 0.25, p < 0.005), C. brasiliense (R2 = 0.32, p < 0.01) and M. acaciifolium (R2 = 0.26, p < 0.05). The other species did not show a significant relationship between dbh and height, which made it impossible to construct cumulative volume curves.
DISCUSSION
Distribution of timber species diameter size and logging pressure
Logging pressure on most species was higher in the southern region of the archipelago. Adapting optimal foraging theory to logger behaviour in Anavilhanas, we expected that logging intensity would be highest near the human communities in the Park buffer zone, since loggers were expected to minimize travel costs. However, there was no significant relationship between geographic distance from human settlements and logging intensity. The trend towards higher logging intensity in the south could be related to the lower cost and risk associated with transporting timber to Manaus, the main market in the region, which is also located south of the archipelago, but we found no relationship between distances from transects to Manaus city and logging intensity.
There is often a spatial relationship between the distribution of human populations and resource extraction (Murali et al. Reference Murali, Uma Shankar, Uma Shaakeer, Ganeshaiaah and Bawa1996; Shaanker et al. Reference Shaanker, Ganeshaiah, Nageswara and Aravind2002). However, this relationship is not based only on spatial distances, but also depends on socioeconomic variables, such as the different kinds of resource extraction practised by different communities and how they use each resource. Thus, while distribution maps indicate a trend towards more illegal logging in the southern portion of the Anavilhanas archipelago, analyses of river distance do not show the same pattern. Although logging intensity did not increase near human communities, the number of logging sites did show an increase. Being a short distance from human communities does not guarantee that a resource will be harvested, since not all towns extract the same resources, and, as logging in the region is illegal, probability of detection may be more of a deterrent than distance.
The ‘central-place-foraging model’ (Bird & Bliege Bird Reference Bird and Bliege Bird1997) predicts that resource harvesting will be increased in distant sites to compensate for the greater travel costs. Thus, a long-distance harvest can be more advantageous, because costs are optimized through higher gains. The regression model we used showed an effect of timber value on logging intensity, but with low explanatory power (2%). However, harvesting of Lauraceae spp. (one of the most valuable taxa) was evenly distributed across the archipelago, in contrast to the less valuable species that were more intensively harvested close to human settlements. Thus, although the analyses only detected a small effect of timber value on logging distribution, logging distribution maps suggest that the economic value of the timber available at each point does influence decisions concerning where to log.
Effects of logging on target-species populations
Increased logging intensity was associated with lower densities of the youngest stems of Lauraceae spp. and of the youngest and oldest stems of Virola surinamensis. However, increased logging intensity was associated with higher densities of Hevea spp. and Macrolobium acaciifolium, and showed no effect on Calophyllum brasiliense. The results for Hevea spp. and M. acaciifolium suggest that these species are pioneers, since sites with higher logging intensity also showed higher stem densities, and these were the species with highest growth rates. Given that we studied the effects of logging in general, we hypothesize that the greater densities of these species in logged areas reflect high recruitment following an increase in light levels caused by harvesting of other species. We observed large numbers of M. acaciifolium and Hevea spp. seedlings in transects and, while only a fraction of these will eventually reach maturity, their abundance suggests that both species are reproducing successfully.
The density of both the largest and the smallest V. surinamensis stems decreased with increasing logging intensity. This suggests that illegal timber logging has altered the population structure of this species in the Anavilhanas archipelago and could compromise its long-term persistence in the region if present harvest levels continue. Worries about the overexploitation of V. surinamensis are long-standing, in part because it is one of the most commonly logged timber trees in the Amazon (Anderson Reference Anderson, Mousasticoshvily, Macedo, Padoch, Ayres, Pinedo-Vasquez and Henderson1998) and in part because logging severely reduced seedling abundance on Marajó Island (Macedo & Anderson Reference Macedo and Anderson1993).
The taxon for which the largest number of stumps was found was Lauraceae spp. This does not necessarily mean that it is the most sought-after timber, since the result could also be explained by a slower stump decomposition rate. Decomposition rates are inversely related to wood density (Chambers et al. Reference Chambers, Higuchi, Schimel, Ferreira and Melack2000) and Lauraceae spp. have the highest wood density (c. 0.60 g cm−3) of the taxa that we studied.
Although the issue of stump age makes it hard to affirm that Lauraceae spp. were more widely logged than other taxa, other evidence suggests that this is the case. The low density estimate and the stand distribution map indicate that this taxon grows more densely on the western islands and is practically absent from the eastern islands. However, there are many stumps on the eastern islands, which may indicate that Lauraceae spp. were historically abundant on these islands, but essentially destroyed by logging.
Logging intensity was negatively correlated with the density of the youngest class of Lauracaeae spp. but positively correlated with the density of the oldest class for general and species-specific effect. According to local loggers, this taxon was cut earlier than the other target species, an account supported by the age of the stumps we found in the field. Loggers also noted that Lauraceae spp. are now less sought after than in the past, because of other illegal timber sources of hard wood in upland forests. For that reason, the higher densities of larger size classes in more heavily logged areas could be related to reduced logging pressure through time, which has allowed younger stems to grow and reach the largest size classes without being harvested. This is supported by the results of the species-specific analysis, since we found an increase in the density of adults of Lauraceae spp. in sites where this taxon was more heavily logged. Likewise, it may be that this size class has not yet reached reproductive age, which would explain the lower densities of smaller size class stems, or that the harvesting of another species can affect the recruitment of Lauraceae spp.
C. brasiliense was very rare in transects, which made it difficult to analyse the effect of logging intensity on its population structure. C. brasiliense has a strongly clumped distribution, which means that even our large sampling effort was insufficient to sample the population effectively, but we found few stumps of this species and no change in the densities of different size classes with increasing logging intensity.
Tree growth rates
Tree growth rates are strongly related to wood density, with higher growth rates in species with lower-density wood and lower growth rates in species with higher-density wood (Schöngart Reference Schöngart2008). However, one of the species with the highest wood densities (O. cymbarum: 0.59 ± 0.05 g cm−3) showed the highest mean annual growth rate (7.78 mm yr−1), probably because this species has a tendency to occur at higher elevations, where it is subject to shorter periods of flooding and thus fewer interruptions of growth. While this species shows an altered population structure and a low stem density in the Anavilhanas archipelago, its high growth rate suggests that it could potentially recover quickly.
Other taxa with high growth rates, Hevea spp. and M. acaciifolium, also showed no negative effects due to illegal logging and have high estimated stem densities across the archipelago, indicating that species in these taxa are not threatened by current logging rates.
C. brasiliense had the highest wood density (0.62 ± 0.06 g cm−3) and the lowest mean incremental diameter growth rate (4.14 mm yr−1). While our results found current logging rates had no effect on this species, its ecological attributes suggest that it may be threatened by illegal logging. Given that its distribution is strongly clumped, it is possible that loggers are harvesting large volumes of this species in sites where stands are present, and, because it grows slowly, recovering historical stocks of the species will take considerable time.
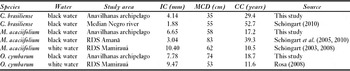
In addition to the variation in growth rates between species, there is also significant variation in growth rates between forests flooded by nutrient-poor black water and forests flooded by nutrient-rich white water, which have higher growth rates (Schöngart Reference Schöngart, Junk, Piedade, Wittmann, Schöngart and Parolin2010). Trees in the Anavilhanas archipelago have higher growth rates and require less time to reach minimum diameter cutting than trees in other black-water forests (Table 2), and this may be because of nutrient inputs from the Branco River, whose sediments are responsible for the formation of the archipelago. This may favour sustainability of logging in the area. Although the area is a national park and economic sustainability is not an issue, this study indicates that illegal logging is unlikely to cause the biological extinction of any species in the Anavilhanas archipelago in the short term.
Comparative mean annual growth (IC, given as diameter at breast height, DBH), minimum cutting diameter (MCD) and cutting cycle (CC) in different flood plains.

CONCLUSIONS
Guaranteeing the long-term conservation of timber species in the Anavilhanas archipelago requires focusing enforcement efforts in areas with large stands of V. surinamensis, Lauraceae spp. and C. brasiliense, as our study shows that these taxa face the highest risk under current logging conditions. Another promising idea is to encourage tourism activity in the southern portion of the archipelago, where there is a higher number of logging sites. This strategy would inhibit illegal logging, since a higher number of tourists in potential logging sites would make it more difficult for loggers, especially those based in Manaus, to hide their activities. Tourism could also provide local communities with an alternative source of income (Fletcher Reference Fletcher1990).
While Brazilian law does not permit forestry in national parks, one strategy to reduce illegal logging pressure on the Anavilhanas archipelago would be to promote sustainable forestry programmes in the Park's buffer zone, focusing on light weight timber species that could provide a substitute for illegal timber currently harvested from black-water forests.
ACKNOWLEDGEMENTS
This study was financed by the project CNPq 575637/2008-0. Andressa Scabin was supported by a CAPES fellowship. We thank the people who helped with field work, managers of Anavilhanas National Park, researchers of PPBio (Brazilian Program for Biodiversity Research), and William Magnusson and the anonymous reviewers for critical comments and suggestions.