


Institutions shape political behavior. A canonical instance of this relationship involves electoral rules. The rules governing the translation of votes into seats shape voters’ propensity to engage in strategic voting, which occurs when “voters eschew wasting their votes on hopeless candidacies, preferring instead to transfer their support to some candidate with a serious chance of winning” (Cox Reference Cox1997, 30). In particular, single-member district plurality (SMDP) rules generate especially strong incentives to vote strategically. Such strategic voting is widely believed to be one of the primary mechanisms underlying Duverger’s Law—the proposition that competition under SMDP rules should converge on two leading candidates. Previous studies have documented the presence of strategic voting, though many note its relatively low incidence (Abramson et al. Reference Abramson, Aldrich, Blais, Diamond, Diskin, Indridason, Lee and Levine2010; Alvarez and Nagler Reference Alvarez and Nagler2000; Blais et al. Reference Blais, Nadeau, Gidengil and Nevitte2001; Kawai and Watanabe Reference Kawai and Watanabe2013). However, little research asks why so few voters vote strategically.Footnote 1
This research letter uses original survey data to examine strategic voting in India and, in so doing, makes significant empirical and theoretical contributions. Our empirical contribution lies in examining a large country whose politics differs markedly from the wealthy Western democracies with stable, programmatic party systems that have dominated research on strategic voting. India is also a country famous for frequently diverging from Duverger’s Law and producing multiparty competition in spite of its electoral rules. Whereas prior research has relied on aggregate-level data to infer strategic voting in India (Rozenas and Sadanandan Reference Rozenas and Sadanandan2018; Zhirnov Reference Zhirnov2019; Ziegfeld Reference Ziegfeld2021), ours is the first study to use individual-level data to examine the incidence of strategic voting.Footnote 2 Our data reveal that strategic voting is exceedingly rare, at 1% or less—lower than in studies already claiming to find low incidences of strategic voting.
By also explaining why so few voters in India vote strategically, we contribute to a better theoretical understanding of mass electoral behavior. Voters are commonly thought to avoid engaging in strategic behavior because their partisan identities induce them to remain loyal to a party even when they know it will lose (Blais Reference Blais2002). Our data suggest a very different rationale for why partisan allegiances dampen strategic behavior; they dramatically distort respondents’ beliefs about their party’s viability in their constituency. The overwhelming majority of voters in our data believe that their preferred party is the likely winner in their constituency, meaning that they see no reason to vote strategically. At the same time, among those few who believe that their preferred party is not in contention to win, the likelihood of strategic behavior is very high, suggesting a pronounced willingness to desert one’s preferred party if one expects it to lose. Thus, we show that partisan leanings do not necessarily create unflinchingly loyal voters; rather, they create voters unable to accurately forecast electoral outcomes. Previous research has shown that voters respond strategically to parties’ objective electoral performance (Alvarez, Boehmke, and Nagler Reference Alvarez, Boehmke and Nagler2006; Fisher and Myatt Reference Fisher and Myatt2017; Merolla and Stephenson Reference Merolla and Stephenson2007) and that election forecasts simultaneously reflect objective reality and optimistic assessments of one’s own party’s chances of victory (Blais Reference Blais2002; Blais and Bodet Reference Blais and Bodet2006; Blais and Turgeon Reference Blais and Turgeon2004; Meffert et al. Reference Meffert, Huber, Gschwend and Pappi2011). Our findings suggest something qualitatively different: voters’ beliefs about their own party’s competitiveness are typically untethered to reality. Beliefs about election outcomes correlate with objective measures of performance only for other parties.
Context and Data
This study examines voting behavior in Uttar Pradesh (or UP), a north Indian state home to approximately 200 million people. In 2017, UP held elections for its state legislature using SMDP rules. Three main parties competed in the election: the Samajwadi Party (SP), the state-level incumbent; the Bahujan Samaj Party (BSP), which held power in UP prior to the Samajwadi Party; and the Bharatiya Janata Party (BJP), the national-level ruling party that won the most seats in UP in the preceding national election in 2014.
Our data come from an original face-to-face survey carried out in February and March of 2017 by the Indian survey firm Cicero. Respondents were selected from voter rolls using a stratified random sample.Footnote 3 The election took place over several polling dates, with the results for all constituencies announced at the end. The survey was administered after the various polling dates but before the announcement of results. Thus, at the time they were surveyed, respondents did not yet know the results of the election. Respondents were drawn from 66 of Uttar Pradesh’s 403 constituencies. The analysis below relies on 3,647 respondents.
How Common Is Strategic Voting?
In principle, UP could have been the site of much strategic voting because many voters preferred parties that would eventually come in third place or worse in their constituency. However, strategic voting was almost nonexistent. To estimate the frequency of strategic voting, we asked respondents questions about (1) which party, if any, they are close to, (2) whom they voted for, and (3) their beliefs about which parties were competitive in their constituencies. Our method differs from prior studies that estimate rates of strategic voting from aggregate election results (Fujiwara Reference Fujiwara2011; Moser and Scheiner Reference Moser and Scheiner2009), which cannot isolate individual-level behavior; survey items asking about self-reported motivation for one’s vote choice, which are notoriously unreliable; or complex models comparing how voters actually voted with how they are predicted to have voted if voting sincerely (Alvarez and Nagler Reference Alvarez and Nagler2000; Blais et al. Reference Blais, Nadeau, Gidengil and Nevitte2001; Eggers and Vivyan Reference Eggers and Vivyan2020).
Instead, we identify strategic voters as those who feel close to a party, believe that that party is not likely to come in first or second place in their constituency, and instead vote for a different party that they believe will come in first or second place.Footnote 4 This approach reflects Cox’s (Reference Cox1997) foundational discussion of strategic voting, in which voters abandon sincerely preferred candidates who are sure losers (those predicted to come in third or worse where district magnitude is one) for a candidate with at least some chance of winning (predicted to come in first or second). According to this definition, our upper-bound estimate is that 1.1% of our respondents are strategic voters. Appendix A uses different survey items to identify a respondent’s underlying party preference; other methods for measuring a respondent’s party preference yield smaller shares of strategic voters.
Why Do So Few Voters Vote Strategically?
To identify why so few voters vote strategically, we break respondents down into six categories. “Unattached” voters express no preference for a particular party. Without a clear party preference, voters cannot truly vote strategically because they have no sincerely preferred party to abandon for strategic reasons.Footnote 5 “Constrained” voters express a preference for a party that is not running in their constituency. Therefore, deciding whether to remain faithful to their preferred party is not an option.
The remaining four types express a party preference and have the opportunity to vote for that party; they therefore constitute potential strategic voters. “Sincere” voters vote for their sincere preference because they believe that their preferred party is viable, expecting it to come in first or second in their constituency.Footnote 6 Such voters have no reason to strategically abandon their preferred party. “Expressive” voters similarly vote for their preferred party but do so believing that their preferred party is unlikely to come in first or second. In knowingly voting for a candidate that they expect to lose, these voters appear to be voting for expressive, not instrumental, reasons. “Strategic” voters believe that their preferred party is unlikely to win and instead vote for a party that they believe will come in first or second. Finally, a residual category of “Insincere” voters includes those who, for whatever reason, vote for a party other than their preferred party even though they believe that it will come in first or second in their constituency.
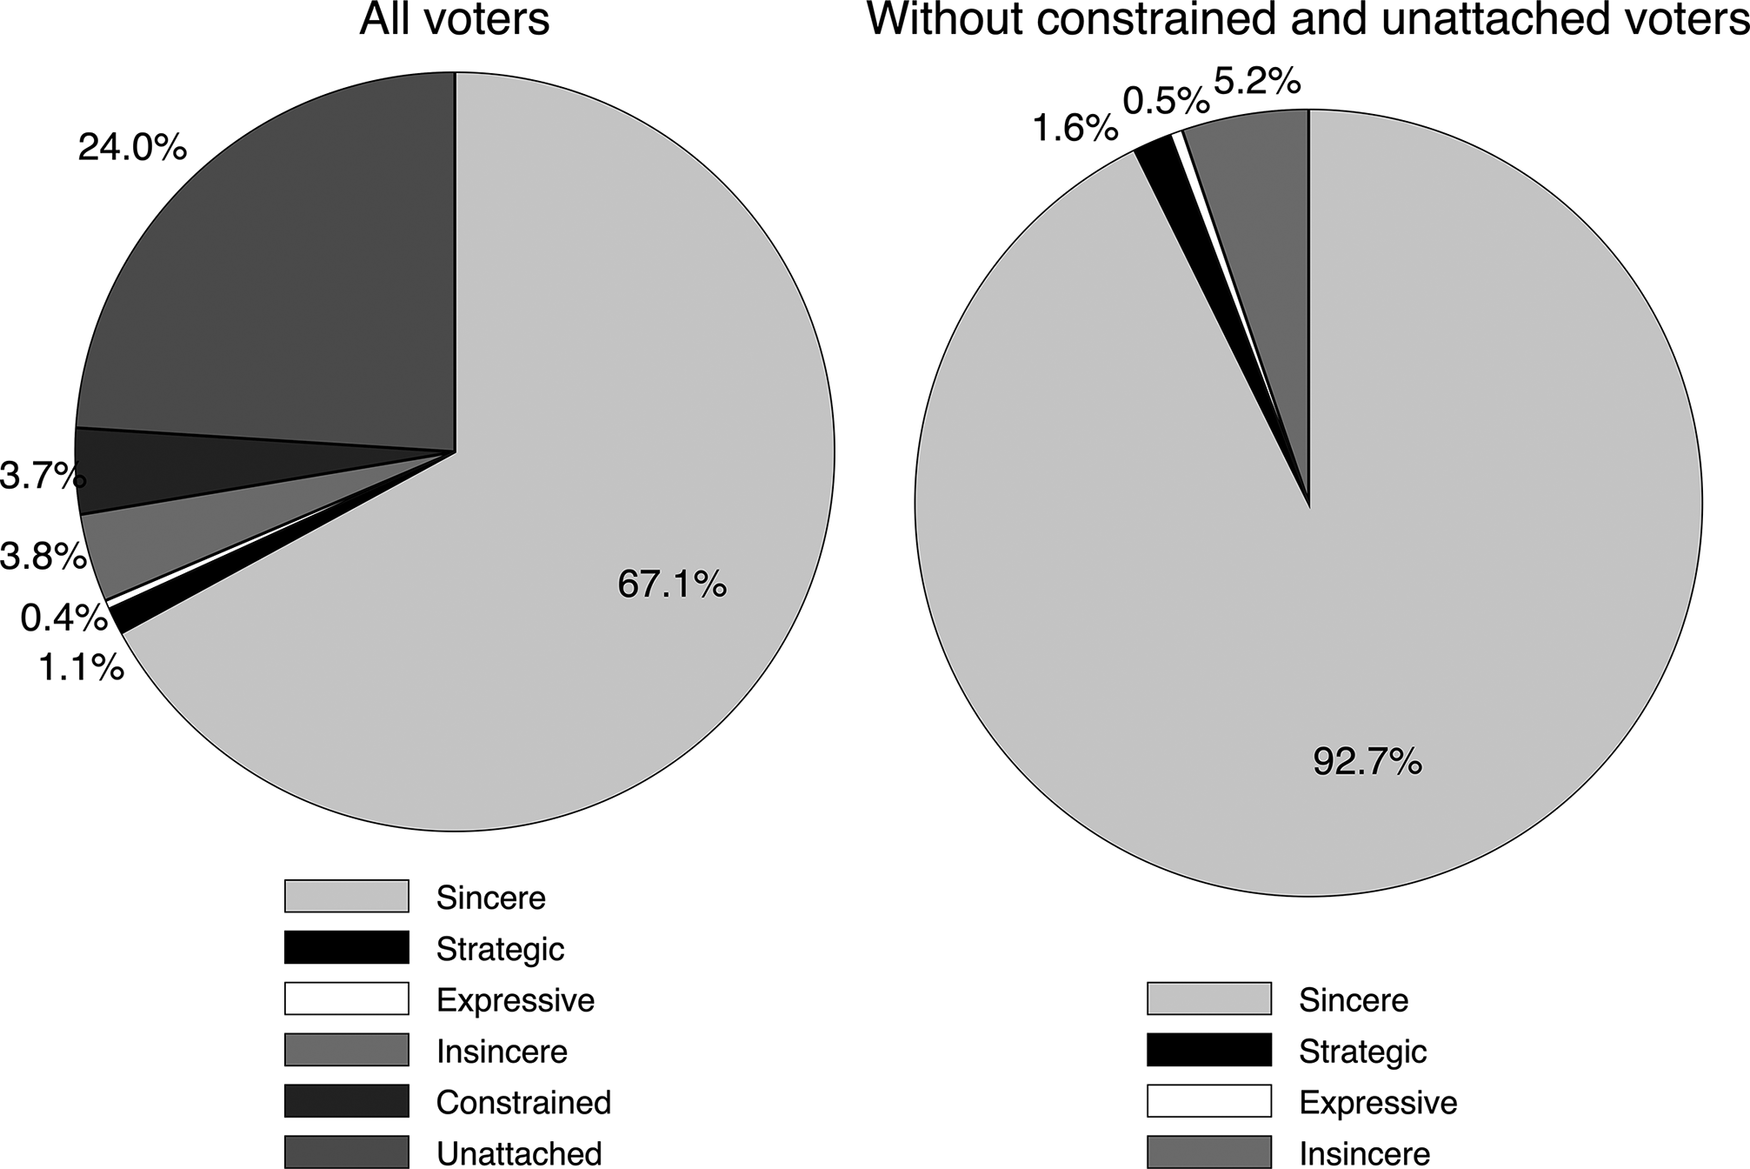
Figure 1 presents the distribution of voters in our sample. The left panel includes all respondents, indicating that unattached (24.0%) and constrained (3.7%) voters account for a significant share of our respondents. However, the vast majority are sincere voters (67.1%), who see no reason to consider voting strategically. The share of strategic voters is very small (1.1%), and the share of expressive voters even smaller (0.4%).Footnote 7 A nontrivial share (3.8%) fall into the residual insincere category. The right panel focuses only on those respondents who could potentially vote strategically, thus excluding unattached and constrained voters. Still, strategic voters represent a very small share of the sample (1.6%).
Distribution of Voters by Type

Figure 1 reveals, first, that the overwhelming majority of respondents are sincere voters, with few expressive voters. The absence of strategic voting stems from the belief that one’s preferred party is in contention to win, not from knowingly sticking with a preferred party that is expected to lose. Second, comparing the shares of strategic and expressive voters, Figure 1 shows that among those who believe that they have reason to potentially vote strategically, a clear majority do so. Of the 55 respondents who believe that their preferred party is not likely to come in first or second in their constituency, about 75% (41) vote strategically—higher than most comparable estimates from other countries (Alvarez, Boehmke, and Nagler Reference Alvarez, Boehmke and Nagler2006). Extrapolating from these figures, if more respondents believed that their preferred party were out of contention in their constituency, rates of strategic voting could be quite high. Importantly, however, very few voters believed that their preferred party was uncompetitive, even though many of them were wrong.
Why Do So Few Voters Correctly Forecast Election Outcomes?
Nearly all voters in our survey—approximately 93%—believe that their preferred party is the likely winner. About another 4% indicate that their preferred party is likely to be the runner-up, leaving only about 3% who do not believe that their preferred party is likely to come in first or second place. Unsurprisingly, most of these predictions proved wrong. Only about 38% of those who believe that their preferred party is likely to win were correct. And, for a third of respondents, their preferred party, which they expect to win, came in third place or worse.
To uncover where respondents’ beliefs about a race come from, we examine two dependent variables related to the expected outcome of the race. The first, Winner, indicates responses to an open-ended question about which party the respondents believe will win their constituency. The second, Likelihood of victory, is a five-point scale indicating a party’s likelihood of victory in the constituency, ranging from not at all likely to extremely likely. For analysis of both dependent variables, we use stacked data so that the unit of analysis is the respondent-party. Thus, each respondent appears three times in the data, once for each of the three main parties (BJP, BSP, and SP). For instance, if respondent i volunteers that she believes that the BJP will win her seat, then the value of Winner in the row associated with respondent i and the BJP would be 1. In the rows associated with respondent i and the BSP and SP, the values of Winner would be 0. The nature of our data means that constituency- and individual-level characteristics are held constant. We only include party-level variables as predictors.
With that in mind, to capture party preference we include as a predictor Close to party, which takes a value of 1 if a respondent indicates that she feels close to the party in question and 0 otherwise. To measure the objective competitiveness of each party we include Distance from contention 2017, which is the difference between a party’s constituency-level vote share and the vote share won by the second-place party in the 2017 election. This variable captures how far the party was from contention, with contention defined as being one of the two leading parties. High positive values indicate that a party is far from contention; negative values indicate the winning party’s margin of victory over the second-place candidate. As beliefs might reflect expectations from the previous election, we also include a measure of the party’s distance from contention in the previous election, in 2012. We expect that contact with a party is likely to signal to respondents that the party is active in their area and therefore electorally viable. Consequently, we control for Contact, which takes a value of 1 if the respondent was contacted by the party in question during the campaign and 0 otherwise. Finally, we include party dummies.
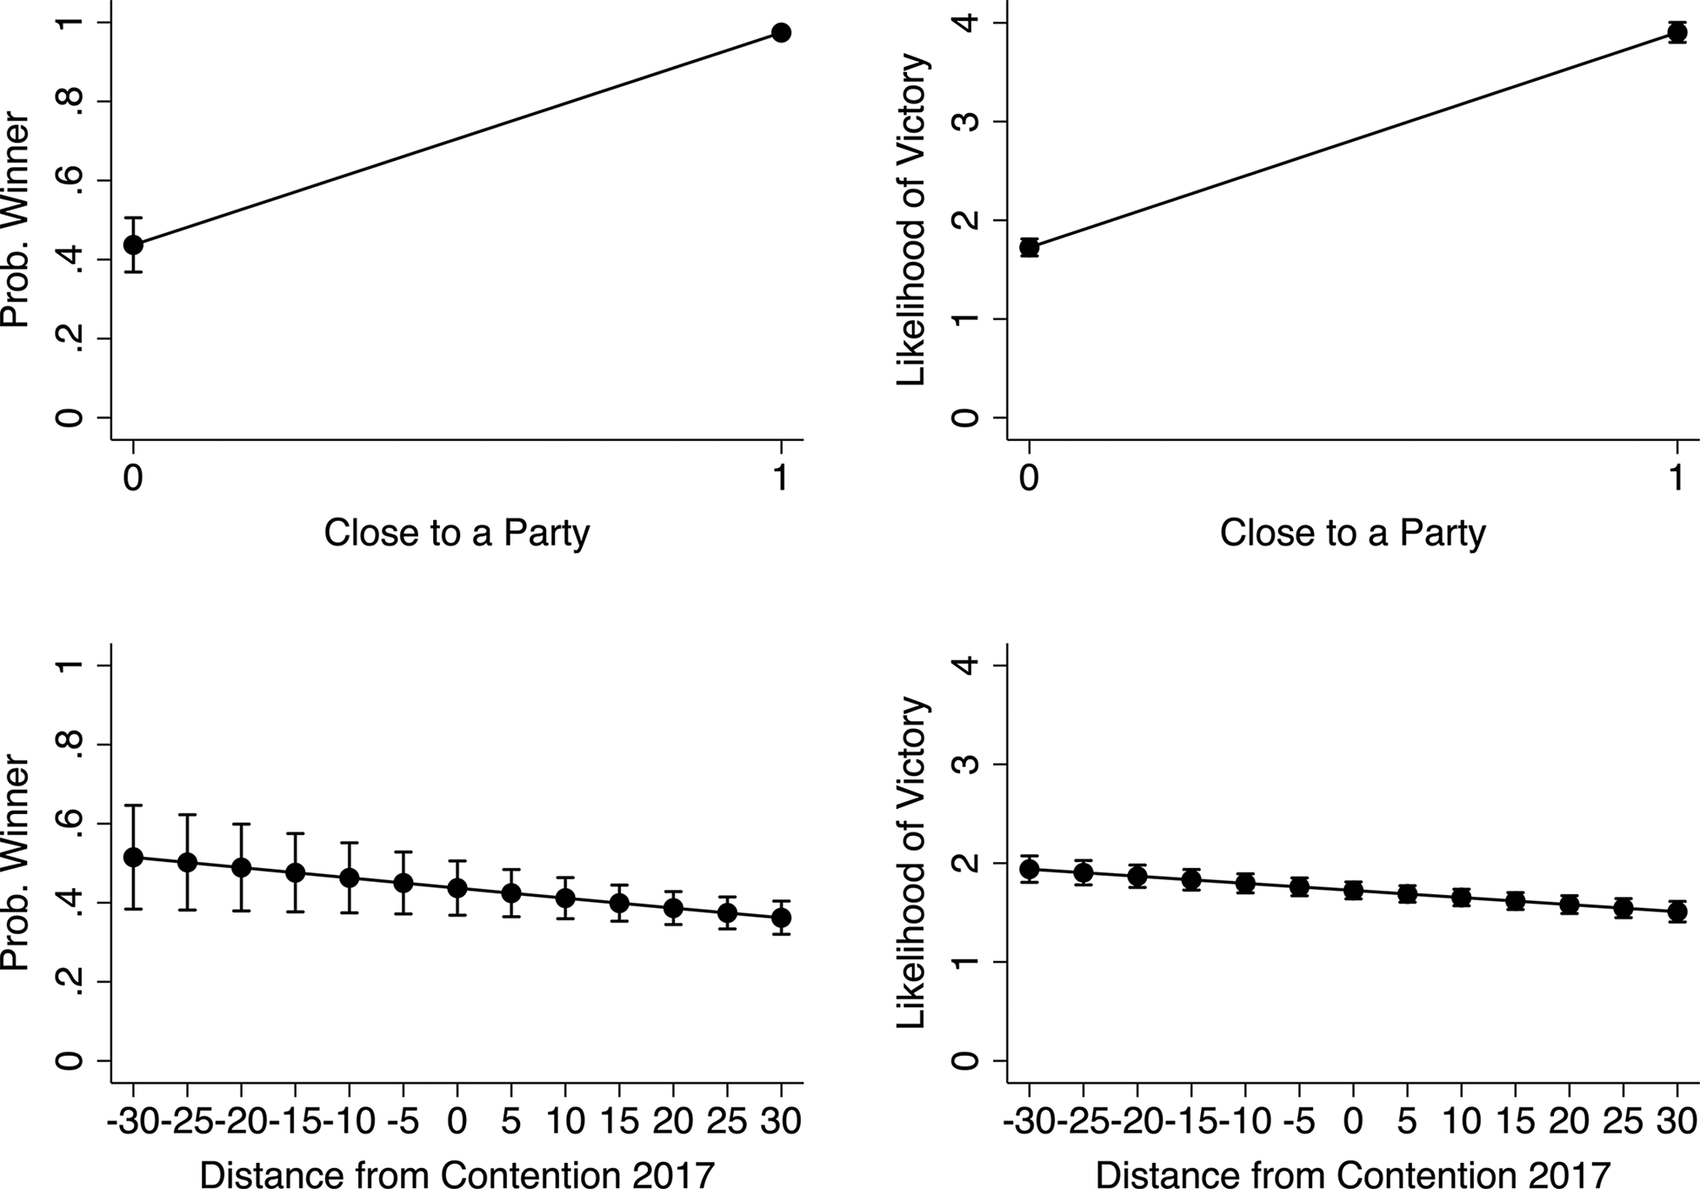
For the Winner dependent variable, we specify conditional logit models because respondents are choosing from among parties (Alvarez and Nagler Reference Alvarez and Nagler1998, 56). For the Likelihood of victory dependent variable, for ease of interpretation we estimate models using ordinary least squares with respondent fixed effects.Footnote 8 Appendix C presents the full results; Figure 2 presents the results graphically. The top row demonstrates that feeling close to a party strongly predicts believing that that party will win.Footnote 9 When a respondent feels close to a party, the probability that the respondent picks that party as the likely winner in the constituency (top left panel) is almost 100% and the expected likelihood of victory (top right panel) is close to the maximum value (extremely likely to win). Meanwhile, the party’s distance from contention only weakly predicts beliefs about a party’s competitiveness (bottom panels).
Predicted Beliefs about Election Outcomes
Note: Models with the full results on which Figure 2 is based can be found in Table A5 of Appendix C.

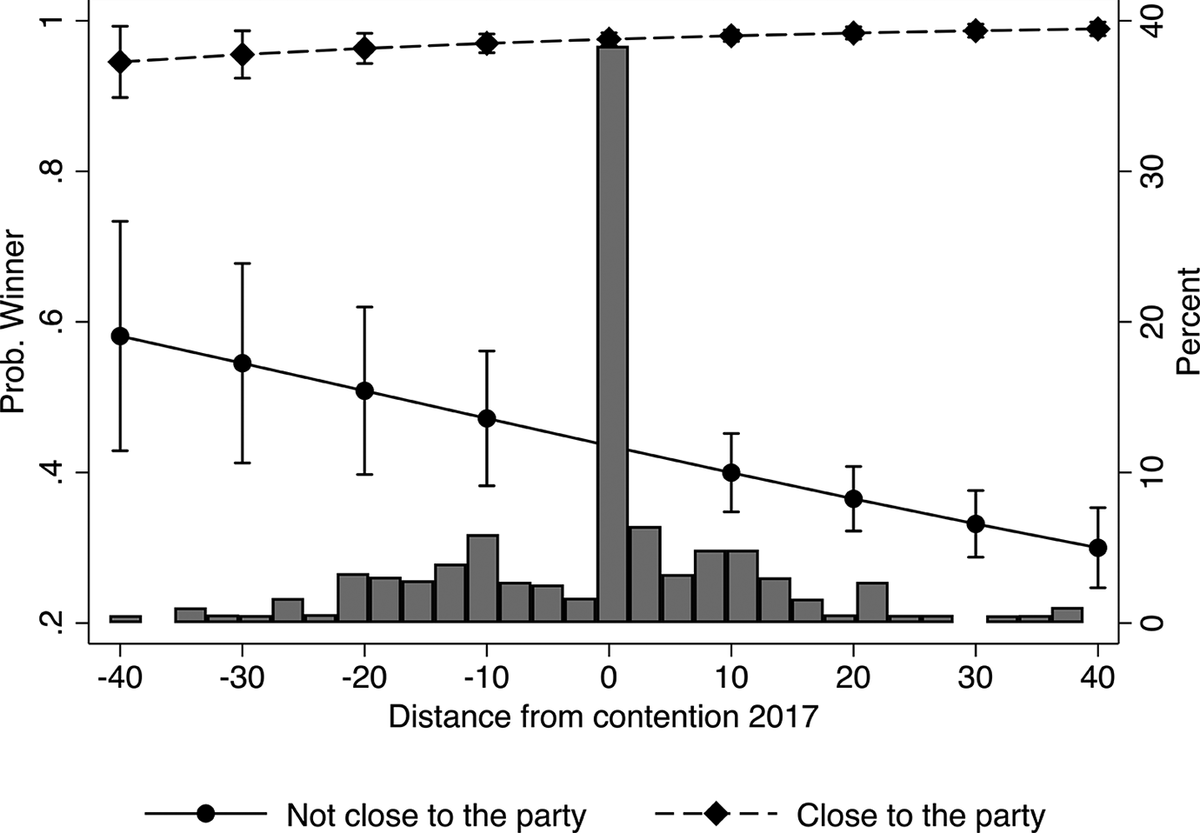
Moreover, the association between distance from contention and beliefs about the election outcome stems mainly from respondents’ beliefs about parties other than the one that they are close to. When we add an interaction term between Close to party and Distance from contention 2017, that term is highly significant and positive. Figure 3 presents the predicted probabilities of identifying a party as the expected winner in one’s constituency (Winner) when a respondent is close to that party (dashed line with diamonds) and when a respondent is not close to that party (solid line with circles). The dark gray bars are a histogram indicating the distribution of observations for the Distance from contention 2017 variable. The tall bar at 0 indicates observations when a party came in second and distance from contention is therefore 0. As Figure 3 shows, respondents’ beliefs about the party they are close to are uncorrelated with the party’s actual distance from contention, whereas beliefs about parties that they are not close to are negatively correlated with distance from contention. A comparable figure associated with the Likelihood of victory dependent variable looks virtually identical.
Predicted Beliefs about Election Outcomes by Partisan Leaning
Note: Models with the full results on which Figure 3 is based can be found in Table A6 of Appendix C.

These findings contrast with much prior research suggesting that voters’ beliefs are tethered to reality, even if colored by considerable optimism about their party’s chances. In our case, an underlying preference for a party results in the near universal projection that that party will win in a respondent’s constituency. Objective indicators of party performance only predict beliefs about other parties.
Appendix D includes various robustness checks, demonstrating that the same patterns hold if we use a party rating variable to identify a respondent’s preferred party or employ alternative measures of objective party performance. We also present analyses in which the dependent variable is correctly forecasting the winning party, which allows us to control for individual- and constituency-level correlates. This analysis similarly reveals that feeling close to the winning party overwhelmingly predicts correctly forecasting the winner, whereas almost none of the individual and constituency controls predict correct forecasts.
Discussion
Duverger (Reference Duverger1954) famously asserted that SMDP systems converge on two parties in part because of the “psychological” effect that these rules have on voters, leading them to desert sure losers for more viable candidates. However, strategic voting requires that voters care mainly about affecting the outcome of the race in their constituency and possess accurate beliefs about which parties are competitive (Cox Reference Cox1997; Fisher Reference Fisher2004). In this study, the first systematic analysis of strategic voting in India using individual-level data, we find overwhelming evidence from the state of Uttar Pradesh that voters fail to vote strategically because they nearly all believe, often incorrectly, that their preferred party will win. However, we also uncover evidence that voters are willing to vote strategically if they believe they are in a position to do so. Among those who believe that their preferred party is not likely to be in contention, as many as 75% vote strategically. Thus, as a practical matter, strategic voting is unlikely to dramatically affect election results even though Indian voters seem quite willing to vote strategically when they believe they prefer an uncompetitive candidate. By implication, widespread strategic voting does not appear to be the driving force behind two-party election outcomes in India that comport with Duverger’s Law.
Are these findings surprising? Numerous studies document associations between objective measures of party performance and either voters’ perceptions of a party’s competitiveness (Blais Reference Blais2002; Blais and Bodet Reference Blais and Bodet2006; Blais and Turgeon Reference Blais and Turgeon2004; Meffert et al. Reference Meffert, Huber, Gschwend and Pappi2011; Raymond Reference Raymond2018) or voters’ strategic behavior (Alvarez, Boehmke, and Nagler Reference Alvarez, Boehmke and Nagler2006; Fisher and Myatt Reference Fisher and Myatt2017; Merolla and Stephenson Reference Merolla and Stephenson2007). Such research would seem to suggest that our results from India are, indeed, surprising. But, prior work draws on very different political contexts, mainly Canada and the United Kingdom. Viewed in light of what scholars know about India, our findings are arguably far less unexpected.
Voters anywhere presumably want their preferred party to win and therefore decide to abandon it only in the face of compelling evidence that it is not viable. In India, it is not at all clear where such compelling evidence would come from. First, constituency-level public opinion polling is virtually nonexistent, and even national-level polls are scarce compared with most developed countries. Second, ready proxies for party viability do not exist. Though ethnicity frequently shapes vote choice (Chandra Reference Chandra2004), elections are not census-like in their reflection of ethnic demography, meaning that voters cannot use ethnic demography to infer a party’s viability. Third, prior election results are a poor guide to future performance. The party system is relatively volatile (Heath and Ziegfeld Reference Heath and Ziegfeld2018), few truly “safe seats” exist for a party, and incumbents do not enjoy an electoral advantage (Uppal Reference Uppal2009). In UP, between the 2002 and 2007 state elections, nearly 64% of seats changed party hands; that figure was nearly 80% between 2012 and 2017.Footnote 10 UP is hardly alone in this respect. Indeed, we have little reason to believe that the results that we uncover should differ noticeably from other multiparty states in India.Footnote 11 More generally, we suspect that many voters in the developing world face similar conditions in which reliable information on likely candidate performance is scarce. Thus, we would hypothesize that the very low incidence of strategic voting that we uncover in India is likely to be found in other democracies throughout the Global South.
Of course, voters do not exist in a complete informational vacuum. After all, voters’ forecasts about less preferred parties bear some relation to reality. But, it is perhaps unsurprising that voters rarely encounter sufficiently compelling information that they would update their beliefs in ways that are at odds with their political preferences.
Supplementary Materials
To view supplementary material for this article, please visit http://doi.org/10.1017/S0003055422000259.
Data Availability Statement
Research documentation and data that support the findings of this study are openly available at the American Political Science Review Dataverse: https://doi.org/10.7910/DVN/7JFVQI.
Acknowledgments
We thank Cicero Associates, and Dhananjai Joshi in particular, for suggestions on the survey design and implementation, as well as Tanushree Goyal for thoughtful comments on an earlier draft of the manuscript.
Conflict of Interest
The authors declare no ethical issues or conflicts of interest in this research.
Ethical Standards
The authors declare the human subjects research in this article was deemed exempt from review by the George Washington University Office of Human Research (IRB#031739).




Comments
No Comments have been published for this article.