1 INTRODUCCIÓN
Este ensayo complementa y actualiza los datos del PIB de una investigación en curso. No se repetirá aquí información ya publicada entre la que se incluye una estimación del producto por el enfoque del valor agregado para 1884.
El presente ensayo encierra diversos objetivos: en primer lugar, proporcionar una serie histórica del Producto Interno Bruto venezolano; también, explicar el método empleado para conseguirla; plantear, además, algunas hipótesis sobre el desempeño económico en el largo plazo y, por último, presentar una nueva serie de precios y de población.
La revisión del cálculo de las inversiones, gracias al uso más ajustado de las cifras sobre las importaciones de bienes de capital y algunos bienes intermedios, ha logrado mejorar la estimación del PIB. Conviene aclarar que no ha variado la tendencia de la serie, pero se considera que las correcciones en las inversiones privadas permiten una mayor precisión.
La construcción de una serie histórica del PIB presenta dificultades tanto de orden metodológico como en el proceso de acopio y selección de datos estadísticos en cantidad y calidad suficientes. En este sentido, Venezuela, despliega complicaciones particularmente arduas de superar. Esto es corolario de los enormes vacíos estadísticos tanto del pasado como del presente, que pueden incluso llegar a desanimar cualquier intento de investigación en esa dirección y, de hecho, han desalentado la indagación en este campo de estudios.
Por otra parte, el escenario académico venezolano no favorece una investigación de esta naturaleza, pues todavía se mantiene encadenado a la tradición de la teoría de la dependencia o al esquema interpretativo marxista ortodoxo de obras como la de Brito Figueroa (Reference Brito Figueroa1993 [1973]). Los métodos o las técnicas cuantitativas aplicadas a la historia económica son prácticamente desconocidos en el país. El desinterés de los economistas por la historia y de los historiadores por la economía suspendió el desarrollo de la disciplina. En aquellos trabajos de la década de 1960, como el de Rangel (Reference Rangel1969), en los que se contabiliza, tan temprano, el crecimiento económico de Venezuela en el siglo XIX, se arriba a conclusiones opuestas a las de todas las investigaciones posteriores sobre el tema del crecimiento económico en América Latina en el siglo XIX. En el caso específico que nos ocupa, se supone que la economía venezolana crece al ritmo de la estadounidense hasta 1860 y duplica la tasa de crecimiento de la francesa para 1909Footnote 1. Todavía, el trabajo de Rangel (Reference Rangel1969), que sustenta su cálculo del PIB en un procedimiento expuesto de manera impecable y estrechamente relacionado con el comportamiento de las exportaciones (en particular, el café y sus índices de precios), es una obra muy útil en lo que respecta a las estadísticas económicas y demográficas venezolanas entre el nacimiento de la República y la consolidación de la Venezuela petrolera. Esta publicación sigue siendo de gran interés, a pesar de los muchos años transcurridos desde su edición.
Por último, es necesario mencionar los trabajos de Asdrúbal Baptista, publicados en diversas ediciones renovadas y continuamente revisadas, con el título de Bases Cuantitativas de la economía venezolana (1997-2006). La limitación del espacio no permite desarrollar una crítica dilatada de esta obra; sin embargo, se harán algunas acotaciones y comparaciones con dicha serie más adelante. Por el momento, basta señalar que la propuesta de Baptista apunta, primordialmente, a la construcción de un esquema contable para entender la renta petrolera como un componente autónomo, desligado del trabajo de la nación, del PIB venezolano. Baptista dice, en referencia a la actividad económica entre 1830-1920:
«En este respecto hay que señalar que se ha obviado la tarea que habría significado una labor de pesquisa histórica de otra naturaleza, de someter a una minuciosa revisión las cifras originales que apoyan todas las estimaciones, y solo se ha procurado asegurar cierto grado de homogeneidad en el conjunto de los datos.»Footnote 2
En consecuencia, los datos que se presentan sobre la economía venezolana del siglo XIX son subsidiarios en su obra y no cumplen con las pesquisas necesarias. Si bien, la información sobre el sector petrolero y otras son de gran provecho. En síntesis, y muy desafortunadamente, son pocos los puntos de referencia para realizar las estimaciones del PIB venezolano antes de 1950 y su calidad técnica, muy modesta.
2 METODOLOGÍA
En líneas generales, se encuentran obstáculos para emplear un método en particular y, a medida que se acopiaban datos estadísticos, hubo que desviarse del propósito inicial y proceder mediante una adaptación paulatina del esquema metodológico a la disponibilidad, veracidad y empleabilidad de los datosFootnote 3. Se partió del hecho de que solo existen datos disponibles para dos grandes series históricas, que son bastante confiables y que abarcan el periodo más complicado para la investigación, que es el de la reconstrucción de las cuentas del siglo XIX. Estas series son: el gasto gubernamental y el neto de las exportaciones totalesFootnote 4. Por el lado del gasto, en consecuencia, se disponía de una buena cantidad de información para intentar completar la identidad del PIB = Consumo + Inversiones + Gasto público+Exportaciones – Importaciones.
Por el lado de la producción, para el siglo XIX y principios del siglo XX hay algunas estimaciones de las producción agrícola de distinta calidad y existe información acerca de las actividades económicas de exportación como el café, el cacao, los cueros, el ganado en pie, el oro; de algunos servicios como el transporte de mercancías en líneas ferroviarias, y otros datos más o menos incompletos, tanto en volúmenes como en precios. Por tanto, existía la posibilidad de construir un conjunto de índices de volumen o de cantidades producidas, de donde se obtenían los valores correspondientes al combinarse con un índice de preciosFootnote 5. Pero se prefirió descartar este camino por los pronunciados vacíos estadísticos y porque, en última instancia, se podía caer en un error al vincular excesivamente el comportamiento del PIB con el desempeño del sector externo, lo que volatilizaría la serie y la reduciría a un simple eco del desempeño de comercio de exportación.
Para los ingresos, existen algunos datos de salarios, tantos rurales como urbanosFootnote 6; pero, cuando hay que cotejarlos, se encuentran contradicciones importantes en sus montos y brechas amplias entre los ingresos rurales y los urbanos, que no se hallan en otras series históricas, ni latinoamericanas ni europeas. Por lo demás, el número era francamente exiguo como para construir una serie consistente. Existe información acerca de los sueldos y salarios gubernamentalesFootnote 7, pero opinamos que son poco representativos de los niveles generales de ingresos de la población, con un promedio muy superior a los de la masa trabajadora y en un grupo, el de los empleados públicos, que no representó más del 2 o 3 % de la población ocupada en el siglo XIX, por lo que se convino en desecharlo como opción factible.
Se exploró la posibilidad de aplicar el método propuesto por Malanima (Reference Malanima2010), pero presuponía la existencia previa de cuatro series históricas: población, salarios (urbanos y rurales), precios y tasas de urbanización, con la cuales emprender el procedimiento de cálculo a partir de la demanda per cápita de productos agrícolasFootnote 8. Los enormes vacíos estadísticos hacían inviable la aplicación de dicho método en el caso específico de Venezuela. Finalmente, se optó por seguir un método simple pero eficaz, como el empleado Goldsmith (Reference Goldsmith1984) para reconstruir el PIB del Imperio Romano, que comienza con una estimación del consumo, al que se añade un índice de inflación de elaboración propia, y que cubre el periodo 1830-1949. Dicho índice se empalma con el deflactor del PIB para el periodo 1950-2012 que está disponible en la web del Banco Central de Venezuela, para así obtener luego el producto constanteFootnote 9.
Se emprendió entonces el procedimiento mediante la construcción de tres canastas de productos básicos que se utilizan para calcular el consumo privado, multiplicando cantidades por el precio y el valor obtenido por la población. Las canastas se confeccionaron tomando en consideración los patrones de consumo de la población venezolana en el siglo XIX y en las tres primeras décadas del siglo XX, enfatizando el régimen alimenticioFootnote 10. Se efectuaron algunas modificaciones en la evolución del consumo, como una ligera reducción del consumo de maíz per cápita en la segunda parte del siglo XIX y un incremento del consumo de caraotas (granos negros) y papelón. No obstante, en términos generales, la dieta del venezolano se mantuvo muy estable a lo largo del siglo XIX y en las primeras 3 o 4 décadas del siglo XXFootnote 11. Solo con la llegada de los migrantes europeos durante la década de 1950 y con el poder de compra de bienes importados generado por el ingreso petrolero se cambió drásticamente la dieta nacional. Además, se incluyen algunos productos manufacturados y algunas bebidas como textiles, alpargatas, aguardiente, fósforos, queroseno y cerveza.
La canasta básica, en promedio, alcanzó un peso total alrededor de los 400 kg, que incluyen las siguientes cantidades de alimentos principales: 100 kg de plátanos, 80 kg de maíz, 75 kg de caraotas o granos, 54 kg de papelón y otros comestibles como carne, azúcar, papas (consumidas en los Andes), trigo (principalmente, en Caracas y en otros centros urbanos), manteca, queso, sal, cacao, café, arroz por un valor de 2.300 kcal diariasFootnote 12. Respecto a las bebidas, se han usado las más difundidas, como la cerveza, que comenzó a consumirse intensamente con la instalación de cerveceras en el país a finales del siglo XIX, y, sobre todo, el aguardiente, que era la bebida de mayor popularidad.
Se incluyeron unos 20 kg de productos manufactureros: textiles como el algodón y la lana (usada en los Andes y en mucha indumentaria dominguera), alpargatas, zapatos, jabón, queroseno, velas y fósforos. La canasta representa lo que podemos determinar como el consumo mínimo para un adulto y, aproximadamente, entre el 65 y el 80 % del consumo de un párvulo. Se incrementó su valor un 50 %, para tener en consideración los diferentes niveles de ingreso de la población. Se tomó esta cifra, muy moderada, pues no solo era extremadamente pobre la masa de la población, sino que la mayoría de los dueños de hatos y haciendas no nadaba en la abundanciaFootnote 13; estos propietarios tenían una vida material que se podría definir como «muy sobria». Lo mismo sucedía con pequeños comerciantes, pulperos, artesanos e integrantes de otros oficios menores. Aquella era, si no la más pobre y atrasada sociedad de América del Sur, seguramente una de las más míseras.
Los cálculos de las inversiones privadas supusieron el mayor inconveniente, pues ni siquiera hay disponible un solo año del siglo XIX con información suficiente para derivar valores relativamente consistentes y extrapolarla a la serie. En consecuencia, se procedió a derivar algunas estimación muy gruesas, un orden de magnitudes, a partir del crecimiento interanual del número de hectáreas bajo producción para la agricultura en generalFootnote 14 y el café en particularFootnote 15, algunos valores de mercado, costos de producción y beneficios por hectárea de caféFootnote 16 y cacao cultivado, así como el desempeño en volumen de la producción agropecuaria, que aparecen en diversas estimaciones de Izard (Reference Izard1970). Aunque la información principal para reconstruir las inversiones fue el uso de las estadísticas sobre las importaciones de bienes de capital y algunos bienes intermediosFootnote 17. Desde la década de 1870, se incorporaron los montos de inversiones extranjeras y privadas nacionales conocidos en ramos de producción o servicios tales como: ferrocarriles, telefonía, telegrafía, mineríaFootnote 18, y en la industria petrolera a partir de la década de 1920Footnote 19 contrastando las mismas con los montos de las inversiones públicas, sobre las cuales existen datos relativamente fiables desde 1870Footnote 20. Igualmente, se cotejaron las estimaciones con los patrones observados en series históricas de otros países de estructura económica agrariaFootnote 21.
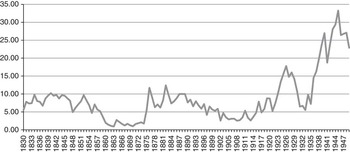
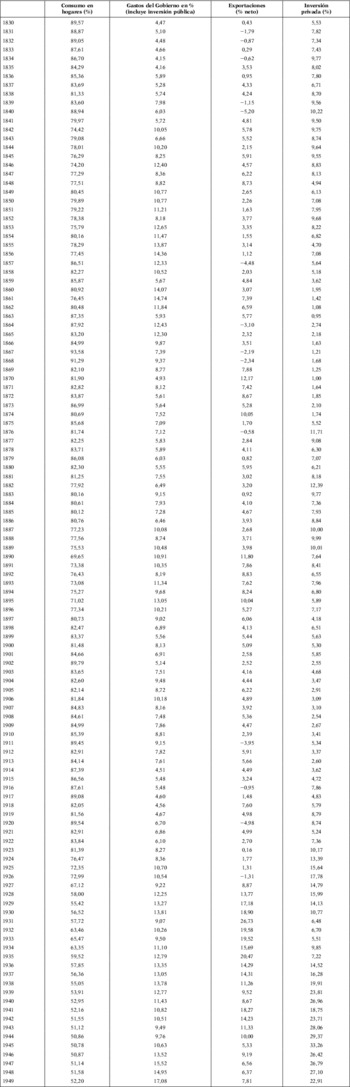
El comportamiento de las inversiones privadas (véase Gráfico 1) oscila, según las nuevas estimaciones, entre, aproximadamente, un 2 y un 30 % del PIB para el periodo 1830-1949. Las cifras más altas se alcanzan en la década de 1940, en pleno crecimiento económico moderno impulsado por el petróleo, mientras que las cifras promedio del siglo XIX oscilan entre el 5 y el 10 %.
INVERSIONES PRIVADAS ESTIMADAS COMO PORCENTAJE DEL PIB: 1830-1949
Fuentes: calculado con los datos del Cuadro A-2, sobre la base de la información del Ministerio de Fomento y Ministerio de Hacienda.

Las inversiones públicas, en cambio, son extremadamente bajas a lo largo del siglo XIX, entre un 1 y un 3 % del presupuesto nacional; pero, al comienzo de la década de 1930, se elevan rápidamente impulsadas por la renta petrolera. Las cifras más bajas coinciden con la guerra federal y la posterior violencia que sacudió el país desde 1859 hasta 1870. La carencia de datos de inversión pública para las primeras décadas del siglo XIX impide efectuar un cálculo más preciso y desagregado.
Para estimar la tasa de inflación que abarca el periodo 1830-1949, se revisaron unos setenta productos entre alimenticios, bebidas y manufacturados, tanto de producción local como importados, ofreciendo una mayor ponderación (70 %) a los alimentos y bebidasFootnote 22. Se elaboraron dos índices: un índice general de precios y un índice de precios para alimentos y bebidas. Las fuentes que fundamentalmente se utilizan son los Anuarios Estadísticos del Ministerio de Fomento desde 1913, periódicos y folletos del siglo XIX y los Tomos de Cuentas Nacionales coordinados por Tomas Enrique Batalla y publicados bajos los auspicios del Banco Central de Venezuela (BCV). Vale la pena advertir que se consiguieron algunos errores tanto en los cálculos de los índices de inflación como en algunos de los precios que se encuentran en los Tomos de Cuentas Nacionales, seguramente relacionados con problemas de transcripción; por lo tanto, se provino a verificar los precios en otras fuentes, especialmente diarios de época, y prescindimos del método de cálculo.
Para el periodo 1935-1949, hay disponibles, aunque muy dispersos en las fuentes, datos estadísticos que permiten estimar el PIB corriente sin mayores dificultadesFootnote 23. A partir de 1950, se toman única y exclusivamente los datos del Banco Central de Venezuela tal como aparecen en el rotulo información estadística de la página web. Conociendo el consumo privado, el gasto público, que incluye la inversión pública, la inversión privada y las exportaciones netas se realizan las operaciones procedentes para estimar el PIB a precios corrientes para el periodo 1830-1935. Para el periodo 1936-1949, se obtuvo también el producto en términos corrientes usando los datos disponibles que, como ya se mencionó, son numerosos y abarcan desde el comportamiento del circulante monetario hasta las exportaciones, las importaciones, el gasto fiscal, las inversiones públicas, etc., interpolando cuando fuere necesario y procedente algunos años. Para el resto de la serie, se usan, y conviene insistir en este hecho, los datos oficiales provenientes del BCV que son, técnicamente, rigurosos y confiables. El PIB a precios de mercado para toda la serie se deflacta usando como año base 1984 y así se elabora la serie a precios constantes, la cual, como suele hacerse en estos casos, se expresa en dólares internacionales de 1990Footnote 24.
El uso del método del gasto empleado para construir esta serie, partiendo del consumo de la población, tiene dos ventajas para el caso venezolano. En primer lugar, permite incluir la producción agrícola de subsistencia, es decir, traduce en valores monetarios aquella parte del producto orientada al autoconsumo. En segundo lugar, se tiene un buen conocimiento de lo que los venezolanos consumían, de las cantidades y los precios de los productos, y esta información era razonable utilizarla con provecho. Hay que tener presente que el consumo privado puede representar entre el 80 y el 90 % del PIB en una economía agrícola premodernaFootnote 25, la mayor parte en consumo de bienes alimenticios, y la venezolana mantuvo dicha armazón, grosso modo, hasta la llegada del petróleo en la década de 1920. El método aplicado es sencillo y directo, y no obstante su simplicidad, es efectivo y se podría utilizar con buenos resultados en aquellos países latinoamericanos que no disponen de largas series estadísticas de producción de bienes agrícolas, manufacturados y servicios, o información sólida por el lado de los ingresos, como sueldos, salarios, intereses, pagos de capital, etc.
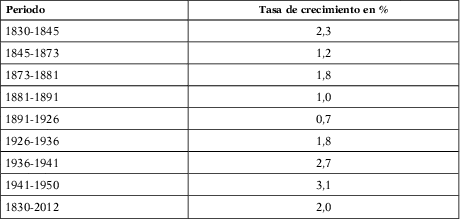
Para el cálculo de la población (Cuadro 1) se ha construido una serie interpolando, para tal propósito, entre una estimación propia para 1830, la estimación oficial de 1845 y los censos oficiales de 1873, 1881, 1891, 1926, 1936, así como las proyecciones de población del Instituto Nacional de Estadística para el periodo 1950-2050 y las cifras provisionales del censo de 2011Footnote 26. Por lo que respecta a la población urbana, si bien no se puede reconstruir para toda la serie, dada la ausencia de datos para gran parte el siglo XIX, sí que se puede estimar entre un 9 y un 12 % del total de la población para 1830 y, aproximadamente, entre un 14 y un 16 % en 1920Footnote 27. A partir de la década de 1930 se produce una verdadera explosión en el crecimiento de la población urbana; en 1936, según lo estimado, era del 19,55 %, y para 1950, según el censo oficial, alcanzaba el 42,03 %. Esta rápida urbanización está determinada por el cambio estructural, resultado del descubrimiento del petróleo. Para el año 1830 se partió de los datos de población de algunas ciudades durante el periodo 1800-1810Footnote 28 y se supuso la recuperación de los centros urbanos en 1830 tras la guerra de Independencia.
TASA DE CRECIMIENTO DE LA POBLACIÓN, 1830-2012
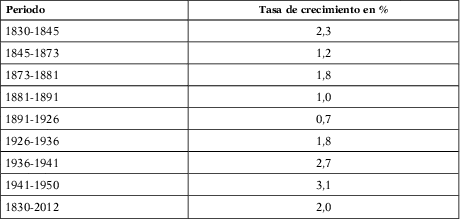
Fuente: XIII Censo General de Población y Vivienda, y Proyecciones de Población INE. Está excluida lo que los primeros censos oficiales denominaban «población indígena selvática», que suponía entre 50.000 y 80.000 habitantes.
Un tema poco indagado es el comportamiento de la tasas de crecimiento demográfico entre 1873 y 1926 que, por motivos que los demógrafos e historiadores no pueden explicar bien, se redujo del 1,8 % en el periodo 1873-1881, al 1 % en 1881-1891 y al 0,7 % para el periodo 1891-1926Footnote 29. ¿A qué se debió este lento pero notable descenso? La reducción de la tasa de natalidad parece descartada ¿Fue entonces producto de la extensión del paludismo, la tuberculosis y el mal de Chagas, y del recrudecimiento de estas enfermedades, que a su vez conllevó un incremento de la tasa de mortalidad? Aún se desconocen las respuestas a estas preguntas, que siguen siendo lo único que ayuda a comprender el estancamiento y el declive de la economía venezolana a finales del siglo XIX.
Lo cierto es que, seguramente, la reducción del crecimiento demográfico tuvo un efecto negativo sobre la capacidad de generar o sostener en el tiempo la progresión de la economía. Sobre todo en una economía agraria con una tasa de productividad cercana a cero y que, por lo tanto, dependía de una provisión fluida de fuerza de trabajo para, simplemente, evitar la contracción de la producción agrícola por habitante y sostener el crecimiento extensivo.
3 CICLOS POLÍTICO-ECONÓMICOS: 1830-2012
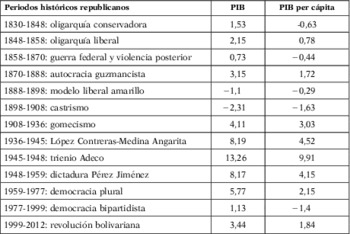
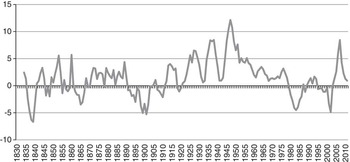
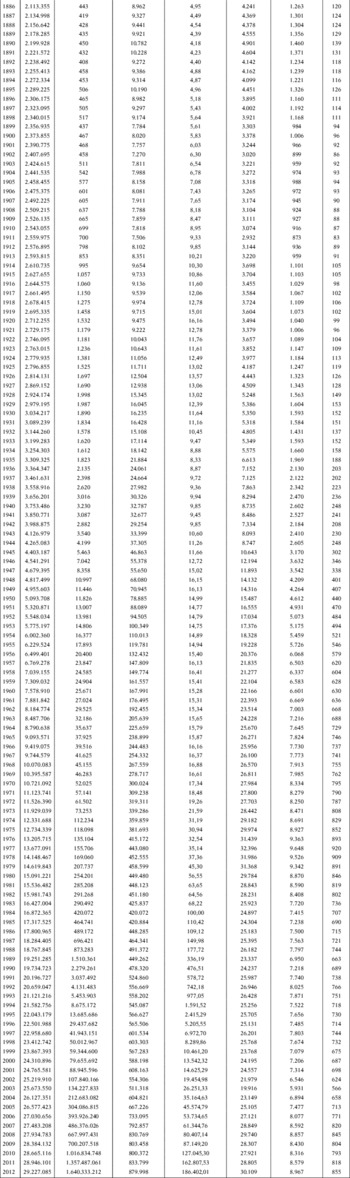
Con el fin de facilitar la interpretación de los datos que se presentan en el Cuadro A-1, se elabora el siguiente cuadro resumen (Cuadro 2) expresado en porcentajes y basado en las estimaciones PIB y PIB per cápita en términos constantes, base 1984, articulado con la periodización político-histórica que suele utilizar la historiografía venezolanaFootnote 30. Para tal propósito, se emplea una tasa compuesta de crecimiento interanual. Así mismo, se incluye el Gráfico 2 con el comportamiento del PIB per cápita en porcentajes, usando una media móvil de 5 años que abarca el periodo 1830-2012.
VENEZUELA, 1830-2012. PERIODOS HISTÓRICO-POLÍTICOS Y CRECIMIENTO ECONÓMICO (EN %)

Fuente: calculado a partir de los datos del Cuadro A-1.
PIB PER CÁPITA EN % MEDIA MÓVIL DE 5 AÑOS, 1830-2012
Fuente: véase el Cuadro A-1.

Para facilitar la lectura, la etapa del Régimen de los Andinos (Castro, Gómez, López Contreras, Medina Angarita) se descompuso en periodos presidenciales y el trienio Adeco se corresponde con la hegemonía del partido socialdemócrata (Acción Democrática). La democracia liberal representativa se segmentó en dos momentos: el plural, que abarca los tres primeros gobiernos (1960-1973) y en el cual el Congreso tiene una representación amplia de diversos partidos políticos, y el bipartidista, en el que la hegemonía es de COPEI (socialcristianos) y AD (socialdemócratas).
Si se observan con detalle el Cuadro 2 y el Gráfico 2 para el siglo XIX, se pueden inferir algunos momentos de crecimiento, como durante el periodo de la autocracia ilustrada del general Guzmán Blanco (1870-1888). Durante esos años, reinó la paz interna y se impulsó un conjunto de reformas institucionales, entre las que destaca el decreto de instrucción pública gratuita y obligatoria. Además, se propició la inversión extranjera en los sectores ferroviario y minero, se reorganizó el sistema cambiario con la creación de la unidad monetaria (el venezolano, más tarde reemplazado por el bolívar), se reordenaron las finanzas públicas y se amplió la producción y exportación del café. El periodo guzmancista, sin lugar a dudas, estimuló un aumento considerable y estable, para la época, del producto y del ingreso per cápita; sin embargo, es indudable que dicho crecimiento no logró sostenerse en el tiempo por las limitaciones inherentes al modelo.
La etapa correspondiente con la oligarquía liberal presenta un cuadro particular y sorprendente de crecimiento, que puede explicarse por dos factores: el considerable incremento del gasto fiscal, sostenido en una expansión sin paralelo en la historia económica venezolana de la deuda pública y el incremento de las exportaciones cafeteras.
Los momentos de peor desempeño del PIB coinciden con aquellos periodos que la historiografía venezolana ha descrito minuciosamente como épocas de fuerte contracción económica y aguda conflictividad socialFootnote 31. En primer término, siguiendo un orden cronológico, el periodo de la oligarquía conservadora, que después de gozar de una excepcional estabilidad en sus primeros años, muestra un cuadro ampliamente recesivo a partir de 1840. La guerra federal y su secuela de revueltas entre 1859-1870 provocaron una caída del producto, del ingreso real y de la inversión. En segundo lugar, el periodo presidencial de Cipriano Castro (1898-1908), en el cual se combinaron la depresión de los precios del café con nuevas revoluciones (la Libertadora), el bloqueo de las costas venezolanas por parte de algunas potencias europeas y, en general, un descomunal desorden de las finanzas públicas.
En líneas generales, la economía creció extensivamente durante el siglo XIX; es decir, su ingreso por habitante se mantuvo estancado con movimientos cíclicos, como consecuencia de factores ya bien conocidos, como los altísimos costos de los transportes de bienes y personas, que la construcción de ferrocarriles no logró abatir dada la abrupta topografía que vinculaba los centros de producción con el sistema portuario, la ausencia de monedas fraccionadas y de numerario suficiente que embotellaba el comercio, la ausencia de mercados de capitales articulados, la dependencia del sector externo de los ciclos del café, el altísimo endeudamiento y el desorden de las finanzas públicas y, aparentemente, cierto grado de desinterés por parte de la población ante las faenas del trabajoFootnote 32; y, no menos importante, el caudillismo con su secuela de revoluciones y revueltas que le costaron a Venezuela, según algunas estimaciones, alrededor de un millón de muertos durante el siglo XIXFootnote 33.
En el siglo XX, con el descubrimiento de los cuantiosos yacimientos petrolíferos en la cuenca del Lago de Maracaibo, la economía venezolana emprende la fase de crecimiento moderno, es decir intensivo. Cabe aquí destacar las altas tasas de incremento del PIB per cápita en el periodo 1925-1958. Al respecto creemos que vale la pena detenerse brevemente en el periodo mencionado y examinar más de cerca su evolución, pues todo indica que el crecimiento en el siglo XX se concentró en un delimitado intervalo de tiempo, probablemente fruto del impacto inicial que tuvo el descubrimiento, explotación y exportación del petróleo en una economía con un bajo ingreso per cápita y una población muy pobre.
Este periodo de tiempo se extendió, aproximadamente, desde 1908 hasta 1958. Se escogieron dichas fechas con toda la intención, tomándolas prestadas del libro de Martín Frechilla (Reference Martín Frechilla1994). La tesis central del autor es que Venezuela, durante esos años, realizó una inmensa obra de implantación física y de modernización de su territorio, con una continuidad independiente de quién ejerciera el poder y de cómo se ejerciera (autoritarismo o democracia). Las elites de poder, se tratara de militares profesionales, políticos provenientes de las organizaciones partidistas o generales del viejo orden gomecista, de manera sistemática y con una unidad de criterio inusual en la historia venezolana, aspiraban a convertir en realidad el viejo anhelo de orden y progreso. Lo que se consideraba una utopía inalcanzable en el siglo XIX, la modernización del país y su ingreso en el conjunto de las naciones occidentales en términos de paridad, lucía ahora como una posibilidad factible.
Martín Frechilla (Reference Martín Frechilla1994) pasa luego a analizar en profundidad, mediante un uso sofisticado y copioso de las fuentes primarias, justamente los planes, proyectos y programas de modernización de las infraestructuras, así como la ejecución de los mismos sin perder de vista la concepción global del «proyecto de país» y sus implicaciones en áreas como la industrialización, la electrificación, el poblamiento, la inmigración, la higiene y la sanidad. Vistos a posteriori, esos años se podrían definir como una edad de oro de la economía venezolana.
La aseveración anterior tiene un fundamento cuantitativo que Martín Frechilla procura demostrar, con acierto, mediante el uso de los datos de egresos fiscales, su composición en gastos de capital y corrientes, y las exportaciones petroleras. Aunque propone algunas cifras correspondientes al PIB, estas no bastan para captar en toda su magnitud la transformación que vive la economía venezolana durante esos años. Algunos guarismos pueden revelarnos con exactitud el cambio económico entre 1908 y 1958: el PIB se multiplicó por 19 y el ingreso real por habitante se multiplicó por 7. Por tanto, se puede afirmar que la tesis de Martín Frechilla es convincente al valorar aquellos años como fundamentales, usando sus palabras, en la construcción del país. Pero para ser más rigurosos, el crecimiento acelerado de la economía ocurre, principalmente, entre 1925 y 1957. En el trascurso de esos años, el país se moderniza de manera apresurada, la ciudad de Caracas alcanza el millón de habitantes, ingresan medio millón de inmigrantes europeos, casi un 8 % de la población, el ingreso por habitante se multiplica, en términos reales, por 5 y la producción de petróleo toca los 2,7 millones de barriles diarios, cerca de 0,40 barriles por persona. Durante este último intervalo, la economía creció a ritmos que se podrían calificar de «chinos».
En el periodo 1959-1977, el crecimiento se moderó y desaceleró, tras el impacto positivo inicial del oro negro, reduciéndose en alrededor de un 50 %. Aquella era ya una economía petrolera madura y la política económica de los gobiernos democráticos aventajaban el gasto corriente, encaminado a reforzar el consenso social y el modelo político de conciliación populista. No obstante, el proceso de modernización del país mantuvo una continuidad con el pasado, aunque a ritmos menos intensos y los logros fueron numerosos en el campo social. En 1977 el crecimiento se interrumpió y comenzó una larga fase de estancamiento.
La revolución bolivariana (1998-2012) ha logrado retomar la ruta del crecimiento de manera muy irregular y fuertemente subordinada a los vaivenes de los precios del petróleo. Sin embargo, hay que recalcar que el ingreso per cápita de los venezolanos sigue siendo, en la actualidad, inferior al de 1977.
Para concluir este apartado, se pueden proponer algunas reflexiones sobre el desempeño reciente de la economía venezolana. Con la explotación y exportación de los hidrocarburos, la economía venezolana comenzó a crecer velozmente, muy por encima del promedio de América LatinaFootnote 34. A mediados de la década de 1950, el ingreso real per cápita era superior al de naciones europeas como España e Italia, países que hoy en día triplican el ingreso venezolanoFootnote 35. En la década de 1960, el ingreso real per cápita era, posiblemente, el más alto de América Latina. En 1977, se alcanzó el máximo histórico de 32.395,79 Bs. a precios de 1984 o 9.648 dólares internacionales de 1990. Para ese año, el PIB per cápita venezolano, tomando como base el ingreso de 1830 y expresado en precios de 1984, había crecido 9,3 veces. Después de trascurridos 35 años, en 2012, el ingreso por habitante era de 30.108,98 Bs. u 8.967 dólares internacionales de 1990, es decir, 8,5 veces el ingreso de 1830 y 681 dólares de 1990 menos que en 1977. Esto a pesar de haber disfrutado de un nuevo auge petrolero entre 2004 y 2008, muy similar al experimentado en la década de 1970. La renta petrolera, desde finales de los años setenta, muestra una utilidad marginal decreciente. Los incrementos de la renta cada vez producen menos utilidad en términos de crecimiento económico y bienestar sostenido en el tiempo.
Fue durante el primer mandato de Carlos Andrés Pérez (1973-1978) que la economía perdió su rumbo y se intoxicó con la cuadruplicación de los precios del petróleo. La prudencia y la disciplina fiscal, instauradas por el Gobierno del general Gómez (1908-1935) y por su ministro de Hacienda, Román Cárdenas, que se mantuvo vigente como un principio en el manejo de las finanzas públicas hasta los tres primeros gobiernos democráticos (1960-1973), fueron suplantadas por el desorden fiscal, el endeudamiento y un esquema económico altamente intervencionista que desembocó en un acentuado capitalismo de Estado y en un fuerte asistencialismo clientelarFootnote 36. Visto retrospectivamente, y sin las pasiones que polarizan a la sociedad venezolana, el proyecto económico bolivariano parece ser una manifestación que hunde sus raíces en ese modelo intervencionista que se impuso en Venezuela a partir la primera administración de Pérez.
4 El CRECIMIENTO ECONÓMICO EN EL LARGO PLAZO: 1830-2012
El presente apartado contiene dos cuadros con diversos razonamientos basados, también, en las estimaciones del PIB y del PIB per cápita constante a precios de 1984. De nuevo, se utiliza una tasa compuesta de crecimiento interanual, pero se aplican criterios distintos con la finalidad de exhibir el desempeño de la economía venezolana en fases largas y en diversos subperiodos. De acuerdo con nuestras estimaciones, para el caso venezolano puede hablarse con bastante propiedad, siguiendo la vasta literatura sobre el tema, de la más absoluta perdida o retraso en el siglo XIXFootnote 37 para el crecimiento económico. El producto por habitante en 1900, en términos constantes, era prácticamente el mismo de 1830, si no ligeramente inferior. El crecimiento del PIB y el ingreso per cápita fueron, entre 1830 y 1900, de un 1,39 y un −0,06 %, respectivamente. Mientras la tasa de crecimiento de la población fue del 1,44 %.
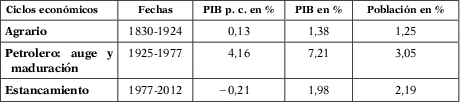
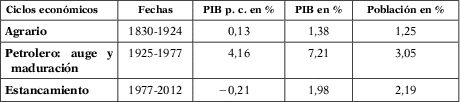
En el Cuadro 3 se pueden identificar las tres fases económicas de la Venezuela republicana. La primera se ha denominado «ciclo agrario» y comprende el periodo que va desde 1830 hasta 1924. Para establecer la frontera entre ambas etapas (agraria y minera) se selecciona el año 1924, cuando las exportaciones agrícolas y petroleras prácticamente se igualan. Una segunda fase, entre 1925 y 1977, corresponde con la expansión económica. El tercer momento, desde 1977 hasta 2012, está marcado por la depresión.
CICLOS DE LA ECONOMÍA DE VENEZUELA, 1830-2012
Fuentes: véase el Cuadro A-1.
El crecimiento del ingreso por habitante en el ciclo agrario es prácticamente nulo. Aquella es una economía casi inmóvil, cuyo producto agregado crece asociado al crecimiento de la población. Durante el tiempo del auge y la maduración de la economía petrolera, el crecimiento es alto, jalonado por el oro negro y, no menos importante, por una política económica muy ponderada hasta 1973. Durante el intervalo correspondiente al ciclo del estancamiento, que también forma parte de la etapa catalogada como «petrolera», el crecimiento del ingreso por habitante es ligeramente negativo y el país entra en una larga estación de desequilibrios macroeconómicos de todo tipo: fiscal, cambiario, monetarios y de alta inflación.
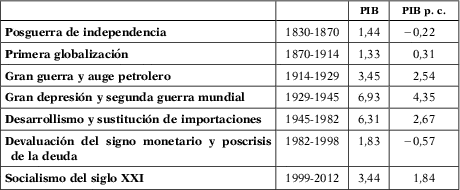
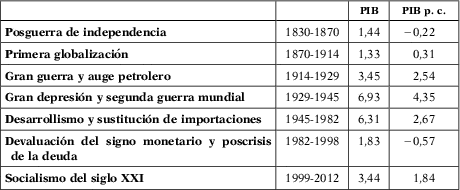
Así mismo, se pueden identificar diversos subperiodos que pueden ser útiles para hacer comparaciones internacionales y para entender los ritmos de la economía en un marco temporal vinculado a diversos acontecimientos globales y domésticos. Para tal propósito, se usará el esquema de periodización señalado en el Cuadro 4, y para cada lapso se ha escogido utilizar una tasa de crecimiento compuesta interanual del PIB y el PIB per cápita.
LA ECONOMÍA VENEZOLANA Y LAS FASES DE LA ECONOMÍA MUNDIAL, 1830-2012
Fuente: véase el Cuadro A-1.
Del cuadro se desprenden algunas informaciones útiles: en el lapso que abarca 1830-1870, aunque el PIB crece, el ingreso por habitante decrece ligeramente; durante la primera globalización, hay un crecimiento modesto del ingreso per cápita; aunque, si se seccionara el periodo en dos etapas: en la primera, hasta 1895, el ingreso crece rápidamente y se alcanza el pico máximo en 1890 (véase el Cuadro A-1); en cambio, a partir de 1895-1898, se inicia la segunda etapa marcada por la caída de los precios del café, el retroceso de la minería y el desorden de las finanzas públicas. El país ingresa, a finales del siglo XIX, en un periodo de abatimiento económico.
El periodo comprendido entre 1914 y 1945 puede caracterizarse como de preámbulo, impacto inicial, desarrollo y consolidación de la economía petrolera. La economía progresa velozmente a partir de 1925, con contracciones coyunturales durante la gran depresión y a comienzos de la segunda guerra mundial, impulsada por la siempre creciente producción y exportación del sector petrolero (véase Gráfico 2). El intervalo entre 1945 y 1982 es el de una economía petrolera que ensaya con el desarrollismo, muy pronunciado durante la década militar (1948-1958), y con el proceso de sustitución de importaciones, a partir de la década de 1960, con el objeto de diversificar su base productiva. Desde 1983, aunque los primeros síntomas irrumpieron a finales de la década de 1970, la economía entra en una fase de estancamiento. El experimento socialista ha implicado una mejoría económica muy frágil con un evidente retorno a la dependencia casi exclusiva del petróleo, incurriendo en los mismos errores de finales de los setenta.
5 COMPARACIÓN CON OTRAS SERIES HISTÓRICAS DE PIB PARA VENEZUELA
La serie más empleada de PIB para Venezuela es la del trabajo de Baptista (Reference Baptista2006), que fue elaborada originalmente de 1986 y ha tenido algunas variaciones. No es una serie confeccionada homogéneamente para todo el periodo 1830-2002 sino más bien dos series separadas para 1830-1920 y 1920-2002, expresadas en bolívares corrientes y constantes de 1936 y 1984. Por lo tanto, fue necesario efectuar la compleja labor de transformar las cifras propuestas por el trabajo «bases cuantitativas» en un conjunto uniforme y enlazado desde 1830 hasta el 2002 para poder realizar una comparación valida.
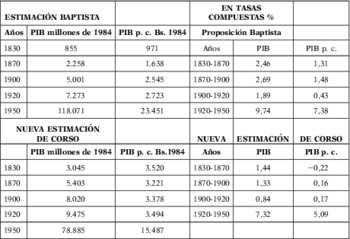
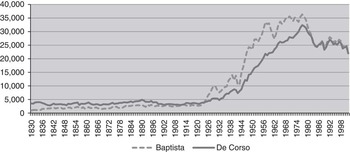
De los datos que propone Baptista interesan aquí unos pocos publicados en 2006 y que cubren la etapa que va desde 1830 hasta el 2002, que son: 1) el PIB medido a precios de 1936 y que comprende el periodo 1830-1920; 2) el PIB a precios corrientes y constantes de 1984 para la serie que abarca el periodo 1920-2002; 3) el índice general de precios 1830-1920 base 1913; 4) el deflactor del PIB 1920-2002 base 1984; 5) el índice de precios general 1830-2002 y, por último, 6) la serie de poblaciónFootnote 38. Con los datos anteriores se pudo elaborar, usando técnicas de empalme, una serie histórica del PIB y del ingreso per cápita que abarcara el periodo 1830-2002. Las operaciones que se realizaron para efectuar el cálculo incluyeron un empalme del índice de precios general con base 1913 y el deflactor del PIB base 1984, la transformación de los precios constantes a corrientes correspondientes al periodo 1830-1936, el cálculo correspondiente al producto interno bruto, el ingreso real por habitante en bolívares de 1984 y en dólares internacionales de 1990Footnote 39. De todo lo cual se obtienen el Cuadro 5 y el Gráfico 3.
PIB DE VENEZUELA, 1830-1950: ESTIMACIONES DE BAPTISTA Y NUEVAS ESTIMACIONES

Fuente: Baptista (Reference Baptista2006). Para la nueva estimación, véase el Cuadro A-1.
PIB PER CÁPITA DE VENEZUELA, 1830-2002: ESTIMACIONES DE BAPTISTA Y NUEVAS ESTIMACIONES
Fuentes: Baptista (Reference Baptista2006); para la nueva estimación, véase el Cuadro A-1.

Se aprovechó la elaboración de los datos para contrastar las estimaciones con las de Baptista (Reference Baptista2006). Se incluyó, entonces, el PIB, el ingreso per cápita en bolívares de 1984 y las tasas compuestas de crecimiento de la serie de «bases cuantitativas» y la que se propone en este artículo, para diversos periodos en el periodo comprendido entre 1830 y 1950.
Como puede observarse en el Cuadro 5 y en el Gráfico 3, las diferencias entre ambas series son sumamente pronunciadas hasta la década de 1970. De los datos de Baptista (Reference Baptista2006) puede interpretarse que la economía venezolana crece constantemente a lo largo del siglo XIX y hasta 1950, con una única desaceleración para el periodo 1900-1920. Por ejemplo, el ingreso real de los venezolanos entre 1830 y 1900 crecería 2,62 veces. De acuerdo con este escenario cuantitativo, excesivamente optimista, Venezuela habría disfrutado de un crecimiento próximo al chileno, una de las más exitosas economías del siglo XIX latinoamericano, que logró multiplicar su ingreso real por 3,3 entre 1830-1900Footnote 40. No parece que este sea el caso, dadas las condiciones precarias de las instituciones venezolanas y la relativa debilidad de su sector externo. En líneas generales, pues el análisis ameritaría un papel de trabajo, la serie de «bases cuantitativas», entre 1830-1920, es aproximada, con discrepancias importantes ente el valor final de la actividad económica y sus componentes. Si bien, el problema esencial, es que la serie expresa, fundamentalmente, el desenvolvimiento del comercio exterior y su índice de precios, de donde se deriva también el deflactor. El coeficiente de correlación entre las exportaciones y PIB per cápita en la serie de Baptista para el periodo 1830-1900 es de 0,8779, una relación de alta dependencia; en el caso de la serie que proponemos aquí, es de 0,655, una relación de moderada a acentuada, acorde con el balance que hay entre el sector externo y el doméstico en esos años. En nuestra opinión, el trabajo de Baptista subestima el tamaño del PIB de Venezuela y sobrestima su tasa crecimiento para el siglo XIX. Y lo mismo ocurre para gran parte del siglo XX, donde nuevamente el comportamiento del PIB es, en parte, un reflejo del sector externo, principalmente de las exportaciones petroleras.
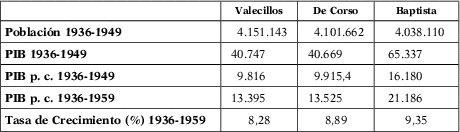
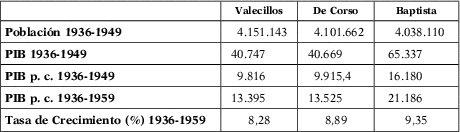
Existe otra serie poco conocida, la de Valecillos (2007), que limitada al periodo 1936-1959, pero sumamente útil para verificar nuestras estimaciones (Cuadro 6). Solo se utilizarán los datos correspondientes al periodo 1936-1949, que son las propias valoraciones del autor, porque el resto son datos del Banco Central (1950-1959).
PIB Y PIB PER CÁPITA DE VENEZUELA, 1936-1959. DIVERSAS ESTIMACIONES (PROMEDIOS DE CADA PERIODO)
Fuentes: Baptista (Reference Baptista2006), Valecillos Toro (Reference Valecillos Toro2007) y Cuadro A-1.
Valecillos Toro (Reference Valecillos Toro2007, p. 456) inicia su cálculo por lo que denomina «consumo global de la población», deducido en base a los ingresos medios de los hogares proletarios y burgueses. Ulteriormente, añade el consumo público, las inversiones y el neto de exportaciones. A precios de 1984, el ingreso promedio por habitante, entre 1936 y 1949, de acuerdo con este autor, es de 9.816 Bs., nuestra estimación alcanza los 9.915 Bs. y la de Baptista (Reference Baptista2006) se sitúa en 16.180 Bs., muy superior a los datos de Valecillos Toro y a los nuestros. La diferencia, mínima, entre nuestra valoración y la de Valecillos Toro es, efectivamente, el resultado de distintas estimaciones de población. En los datos de Baptista (Reference Baptista2006, p. 25-26), que usa el enfoque de la producción, el primer inconveniente adverso es que el PIB total entre 1920 y 1950 no se corresponde con las contribuciones sectoriales y la solución estadística no es la mejor. Eventualmente, la estrechez de las estadísticas de producción y el uso desproporcionado de ciertos sectores (petróleo, cemento, generación eléctrica), como reflejo del comportamiento general de la producción agregada, concluye perjudicando su resultado e inflando las estimaciones.
6 CONCLUSIONES
La nueva serie presentada en este trabajo implica una mejora metodológica fundamental en comparación con series previas. Su elaboración significó un estudio minucioso del consumo, la población y la inversión. El deflactor está construido en base a una amplia recopilación de estadísticas de precios internos y externos de exportación e importación, adecuadamente ponderados, para el periodo en cuestión, lo cual le da un rigor significativo. Los componentes del PIB (consumo, gasto público, inversiones y sector externo) fueron construidos cuidadosamente y elaborados para, prácticamente, cada año. Para la historia cuantitativa de Venezuela, esto implica contar con estimaciones macroeconómicas razonables, basadas en una extensa pesquisa, útil para la investigación histórico-económica. Aunque queremos resaltar que la serie no es un fin en sí mismo, sí es una herramienta idónea para complementar el análisis, no solo de la economía, sino también de la dinámica social y política venezolana en el largo plazo, e incluso, comparativamente, en su contexto regional.
Se puede deducir del análisis de la serie propuesta que el ingreso per cápita a lo largo del siglo XIX se mantuvo en una media de unos mil dólares de 1990, con fluctuaciones. Mientras que en el siglo XX, si bien el ingreso per cápita se eleva considerablemente, hasta alcanzar unos nueve mil dólares de 1990 gracias a la explotación petrolera, dicha alza es más moderada de lo que sugieren otros trabajos.
APÉNDICE
PIB DE VENEZUELA 1830-2012

COMPOSICIÓN DEL PIB EN PORCENTAJES, 1830-1949