Introduction
Retinal ganglion cells (RGCs) are the output neurons of the retina, and the visual information they send to the brain is coded in the firing of their axons, which form the optic nerves. There are many distinct types of RGCs, which code different aspects of the visual scene, and many types appear to be largely conserved across the mammals (reviewed by: Masland, Reference Masland2001; Wässle, Reference Wässle2004). In the rabbit retina, ~15 functional types of RGCs have been identified by recording their spike discharges and analyzing their receptive field properties in response to controlled visual stimulation (Barlow et al., Reference Barlow, Hill and Levick1964; Levick, Reference Levick1967; Caldwell & Daw, Reference Caldwell and Daw1978; Hamasaki et al., Reference Hamasaki, Tasaki and Suzuki1979; Vaney et al., Reference Vaney, Levick and Thibos1981; DeVries, Reference DeVries1999; Roska et al., Reference Roska, Molnar and Werblin2006). This physiological diversity is matched in the rabbit retina by a comparable diversity of morphological types, which have been identified by a variety of staining methods (Amthor et al., Reference Amthor, Oyster and Takahashi1983; Buhl & Peichl, Reference Buhl and Peichl1986; Peichl et al., Reference Peichl, Buhl and Boycott1987; Famiglietti, Reference Famiglietti1990; Pu & Amthor, Reference Pu and Amthor1990a,Reference Pu and Amthorb; Wong, Reference Wong1990; Famiglietti, Reference Famiglietti1992; Vaney, Reference Vaney1994a; Xin & Bloomfield, Reference Xin and Bloomfield1997; Rockhill et al., Reference Rockhill, Daly, MacNeil, Brown and Masland2002; Famiglietti, Reference Famiglietti2004, Reference Famiglietti2005, Reference Famiglietti2009). The morphological diversity of RGCs in the rabbit retina appears comparable to that described in other mammals (Cajal, Reference Cajal1893; Polyak, Reference Polyak1941; Kolb et al., Reference Kolb, Nelson and Mariani1981; Dacey et al., Reference Dacey, Peterson, Robinson and Gamlin2003). In many cases, functional and morphological types have been matched by combining electrophysiological recording with intracellular dye injection (Amthor et al., Reference Amthor, Oyster and Takahashi1983; Bloomfield & Miller, Reference Bloomfield and Miller1986; Amthor et al., Reference Amthor, Takahashi and Oyster1989a,Reference Amthor, Takahashi and Oysterb; Jensen, Reference Jensen1991; Bloomfield, Reference Bloomfield1994; He et al., Reference He, Levick and Vaney1998; Roska & Werblin, Reference Roska and Werblin2001, Reference Roska and Werblin2003; Ackert et al., Reference Ackert, Wu, Lee, Abrams, Hu, Perlman and Bloomfield2006; Roska et al., Reference Roska, Molnar and Werblin2006; van Wyk et al., Reference van Wyk, Taylor and Vaney2006; Sivyer et al., Reference Sivyer, Taylor and Vaney2010). However, comparisons between different studies are often not clear-cut, and a definitive physiological and morphological accounting of the distinct types of RGCs in the rabbit remains to be achieved, as in other mammalian retinae.
The dendritic morphology of a RGC will affect its functional properties in three general ways. First, the size of the dendritic field will limit the size of the receptive field and also determine the density of cells that are required to achieve complete retinal coverage by each type of RGC. Second, the pattern of dendritic branching, as seen in plan view, will affect how electrical signals generated in the dendrites interact with each other, either within the dendritic tree or at the soma. Third, the branching levels of the RGC, as seen in vertical view, will constrain the excitatory and inhibitory inputs the RGC may receive because different types of bipolar and amacrine cells branch at characteristic levels within the inner plexiform level (IPL). At the coarsest level, depolarizing (ON) bipolar cells terminate in sublamina b of the IPL, closer to the ganglion cell layer (GCL), while hyperpolarizing (OFF) bipolar cells terminate in sublamina a, closer to the inner nuclear layer (INL). This ON/OFF dichotomy is imposed on the RGCs that stratify in each sublamina, with most types responding either to the onset or to the termination of a light spot flashed in the receptive field center (Nelson et al., Reference Nelson, Famiglietti and Kolb1978). Those few types of RGCs that fire at both light ON and light OFF are either bistratified RGCs, like the ON–OFF direction-selective ganglion cells (DSGCs; Amthor et al., Reference Amthor, Oyster and Takahashi1984), or stratify at the boundary of sublaminae a and b, like the local edge detector RGCs (Amthor et al., Reference Amthor, Takahashi and Oyster1989b; Roska & Werblin, Reference Roska and Werblin2001; van Wyk et al., Reference van Wyk, Taylor and Vaney2006).
There are other ON–OFF RGCs in mammalian retinae that are unique in responding at both light ON and light OFF by reducing the maintained firing. These RGCs were originally termed “uniformity detectors” (UDs) in the rabbit retina (Levick, Reference Levick1967) and appear homologous to the “suppressed-by-contrast” RGCs described in the cat retina in the same year (Rodieck, Reference Rodieck1967). Although UDs are encountered only rarely in the rabbit retina (Caldwell & Daw, Reference Caldwell and Daw1978; Vaney et al., Reference Vaney, Levick and Thibos1981), two types had been distinguished in some studies. The firing of the “transient” UD is briefly interrupted at light ON and light OFF (Levick, Reference Levick1967; Sivyer et al., Reference Sivyer, Taylor and Vaney2010), whereas the “sustained” UD is suppressed for the step duration (Levick, Reference Levick1967; Amthor et al., Reference Amthor, Takahashi and Oyster1989b). Sivyer et al. (Reference Sivyer, Taylor and Vaney2010) recently showed that the spike suppression of the transient UDs is mediated by light-evoked glycinergic inhibition acting on both the ON- and the OFF-strata of the bistratified dendritic tree, and they illustrated one example of a dye-filled cell. Amthor et al. (Reference Amthor, Takahashi and Oyster1989b) filled one sustained UD and it had a bistratified dendritic tree that branched near the outer margins of the IPL, like the transient UDs. Famiglietti (Reference Famiglietti2009) identified a type of bistratified RGC in Golgi-stained rabbit retina that also branched near the outer margins of the IPL, and he proposed that its morphology corresponded to that of the UD injected by Amthor. These Golgi-stained cells were termed type 2 bistratified (BS2) RGCs to distinguish them from the type 1 bistratified (BS1) RGCs, which are the morphological correlate of the ON–OFF DSGCs (Amthor et al., Reference Amthor, Oyster and Takahashi1984). Although there is physiological evidence that the suppressed-by-contrast RGCs in the cat retina also fall into two functional groups (Cleland & Levick, Reference Cleland and Levick1974; Mastronarde, Reference Mastronarde1985), no information is available on their morphology.
It is generally accepted that each distinct type of RGC will be characterized by unique receptive field properties and a unique dendritic morphology. However, at present, it is not possible to say whether this holds for the sustained and transient types of UDs in the rabbit retina. Part of the problem is that Amthor et al. (Reference Amthor, Takahashi and Oyster1989b) recovered only a single sustained UD and no transient UD in their study, whereas Sivyer et al. (Reference Sivyer, Taylor and Vaney2010) only targeted transient UDs in their study. (The transient UDs produce characteristic complex spikes that enable them to be identified from their maintained firing alone, in the absence of any visual stimulation.) So side-by-side comparisons from the same study have not been possible.
In this study, we identified transient UDs in the isolated rabbit retina by making spike recordings in the cell-attached mode and then labeled the cells with Neurobiotin by loose-seal electroporation (Kanjhan & Vaney, Reference Kanjhan and Vaney2008). We have characterized the dendritic morphology and stratification of the UDs in detail and also shown that the cells are tracer coupled to underlying amacrine cells and neighboring RGCs. A close comparison with previous studies suggests that the morphology of the transient UDs differs in several respects from that of the BS2 cells stained by Famiglietti (Reference Famiglietti2009) and perhaps also from the sustained UD cell injected by Amthor et al. (Reference Amthor, Takahashi and Oyster1989b). Surprisingly, the dendritic morphology of the UDs appears indistinguishable from that of the “ON bistratified diving” RGCs, which have been described recently in the rabbit retina by Hoshi et al. (Reference Hoshi, Liu, Massey and Mills2009). These findings have interesting implications for the classification of RGCs in general and for bistratified cells in particular.
Materials and methods
Experiments were undertaken in accordance with the Australian code of practice, and the protocols were approved by the Animal Ethics Committee of the University of Queensland. Experiments were performed on retina taken from adult Dutch-belted (pigmented) rabbits of either sex. The procedures used have been described in detail previously (Hampson et al., Reference Hampson, Vaney and Weiler1992; Taylor & Vaney, Reference Taylor and Vaney2002; van Wyk et al., Reference van Wyk, Taylor and Vaney2006).
The rabbits were anaesthetized with 40 mg/kg ketamine (IM) and 40 mg/kg xylazine (intramuscularly) before being overdosed with 150 mg/kg pentobarbitone sodium (intravenously). Following overdose, the eyes were quickly enucleated and hemisected, and the eyecups placed in Ames medium gassed with carbogen (95% O2 and 5% CO2) at room temperature (pH 7.4). Under infrared (IR) illumination, the inferior portion was cut into two and forceps were used to grasp the myelinated band and peel the retina from the underlying sclera. The retina was then positioned photoreceptor side down in a tissue chamber (Warner 26-GLP, Warner Instruments, Hamden, CT), held in place with a grid, and mounted under an Olympus BX-51 WI microscope (Olympus, Tokyo, Japan). The dual-port microscope was used with a 20 × 0.95 N.A. (numerical aperture) objective, allowing both visual stimulation of a large retinal field of ~1.2 mm diameter at 20 × magnification and IR visualization of a smaller field of 110 × 85 μm at 80 × magnification using gradient contrast optics (Dodt et al., Reference Dodt, Eder, Frick and Zieglgansberger1999).
A recording electrode containing Ames medium was advanced onto the soma of RGCs after making a small hole in the inner limiting membrane. RGCs with a medium-sized round soma that had an indistinct nucleus were targeted, and cells that displayed the characteristic complex spiking of UDs were selected for testing with visual stimuli (Sivyer et al., Reference Sivyer, Taylor and Vaney2010). Following electrophysiological characterization, another electrode containing 2% Neurobiotin (Vector Laboratories, Burlingame, CA) was applied to the soma and the UD labeled by cell-attached electroporation of Neurobiotin (Kanjhan & Vaney, Reference Kanjhan and Vaney2008). Once a seal of >20 MΩ was achieved, the amplifier was set to current-clamp mode and the holding current was maintained around −50 pA. Square-wave pulses of 300–800 pA were then applied at 1 Hz, while the electrical access to the cell was monitored visually by examining the spike amplitudes. Once the electrode appeared to “break in”—which typically took 30–60 s—the pulses were ceased and the holding current was reduced to about −10 pA; pulses of ~50 pA were then applied for 3–5 min. This method of labeling has several advantages over dye filling by diffusion in the whole-cell configuration, reducing both the washout of intracellular constituents and the soma damage following electrode removal.
After filling one to three UDs in a piece of retina, the tissue was returned to the dissection bath and mounted on nitrocellulose filter paper, photoreceptor side down. The retina was fixed for 30 min in 4% paraformaldehyde in 0.1 m phosphate buffer and washed overnight in PBS (phosphate buffered saline) at room temperature. The retina was then removed from the filter paper and incubated at room temperature for 5–7 days in PBS with 2% bovine serum albumin (IgG-free BSA; Jackson ImmunoResearch Laboratories, West Grove, PA), 1% normal donkey serum (Jackson), 0.1% Triton-X 100, and anticholine acetyltransferase (ChAT), anti-γ-aminobuytyric acid (GABA), antiglycine, or antiglycine transporter 1a/1b (GlyT-1) antibody (Table 1). The antiglycine and anti-GlyT-1 antibodies were kindly provided by Professor David Pow, University of Queensland (Pow & Crook, Reference Pow and Crook1993; Vaney et al., Reference Vaney, Nelson and Pow1998; Pow & Hendrickson, Reference Pow and Hendrickson1999). The tissue was washed overnight in PBS and then incubated overnight in streptavidin conjugated to Cy-3 (1:500; Jackson) and anti-goat IgG or anti-rabbit IgG conjugated to Cy-2 or Cy-5 (1:500; Jackson).
Primary antisera

N/A, not applicable; PFA, paraformaldehyde; AAs, amino acids.
In other experiments, the retina was prelabeled with 4', 6-diamidino-2-phenylindole (Masland et al., Reference Masland, Mills and Hayden1984) and amacrine cells selected at random under ultraviolet illumination were impaled with a sharp electrode and iontophoretically injected with 2% Lucifer yellow using a negative current of 0.2 nA for 30 s. Following fixation, the tissue was immunolabeled with anti-Lucifer yellow and processed as described above.
Fluorescent-labeled tissue was imaged on a Zeiss LSM 510 Meta confocal microscope (Carl Zeiss, Jena, Germany), and LSM files were imported into ImageJ for quantitative analysis. The dendritic field area (A) was measured separately for the ON and OFF dendritic trees by tracing convex polygons around the dendritic tips using the “measure” function. The equivalent dendritic field diameter (D) was calculated by the formula:

Dendrites were traced in ImageJ using the “segmented line” tool, and dendritic lengths were measured using the “measure” tool. Dendritic branch points were counted using the “point selections” tool, and side projections were made using the “3D project” tool. Dual-color depth coding was achieved by combining the z-sections through the ON sublamina in one top projection (typically three 1-μm z-sections at 20× magnification) and the other sections in another top projection and then pasting the projections into separate color channels in Adobe Photoshop.
Results
Targeting and identification
Our initial recordings of UDs were made during experiments targeting other types of RGCs and occurred infrequently. However, once we established that these cells show a unique pattern of firing, due to bursts of complex spikes (Sivyer et al., Reference Sivyer, Taylor and Vaney2010), it was possible to reliably identify the transient UDs from their maintained firing alone, in the absence of visual stimulation. Consequently, we could screen many RGCs in succession by extracellular recording of their maintained firing in a loose-seal configuration. It became clear that the UDs had a fairly uniform somatic morphology, and by concentrating recording efforts on such somata and avoiding others known to correspond to different types of RGCs, the encounter rate could be increased well above chance. This enabled recordings to be made from multiple UDs in every experiment, although the success rate was lower than that obtained targeting local edge detectors or DSGCs, which are not only more common than UDs but have a more distinctive somatic morphology (Vaney, Reference Vaney1994a; van Wyk et al., Reference van Wyk, Taylor and Vaney2006).
The UDs had a medium-sized soma, and the nucleus was less distinct than that of many RGCs viewed under IR Dodt optics; they had a soma diameter of 13.9 ± 1.1 μm in the visual streak (n = 14; Fig. 1A). Loose-seal recordings showed that, in the absence of visual stimulation, the UDs produce regular bursts of complex spikes, with each burst usually containing two or three spikes of progressively smaller amplitude (Fig. 1B); we have previously shown that this distinctive pattern of maintained firing is due to slow calcium depolarization, which inactivates Na+ channels during the burst (Sivyer et al., Reference Sivyer, Taylor and Vaney2010). The burst firing was transiently suppressed at the onset and termination of a flashed spot, indicating that these RGCs are transient UDs (Fig. 1C). All targeted RGCs that fired bursts of complex spikes showed similar receptive field properties, and subsequent dye filling revealed that they had the same dendritic morphology.
Targeting and functional identification of UDs. (A) Micrograph of the RGC layer in the visual streak of rabbit retina taken with IR Dodt optics; the recording electrode is attached to a UD, which has a medium-sized round soma and an indistinct nucleus. Scale = 20 μm. (B) Extracellular recording of the maintained firing of a UD, showing the characteristic bursts of complex spikes. (C) A dark spot flashed in the receptive field for 6 s suppresses the maintained firing at both light OFF and light ON.

Following the functional characterization of a UD, a fresh electrode containing 2% Neurobiotin in a K+ internal solution was advanced onto the soma and the cell was labeled with Neurobiotin using a semi-loose–seal electroporation technique (Kanjhan & Vaney, Reference Kanjhan and Vaney2008). The light-driven responses of the cell could be monitored before and after dye filling, confirming the identity of the targeted cell. The electrical access to the cell reflected the level of electroporation, with lower access resistance typically resulting in stronger labeling. After 3–5 min of filling, the electrode was removed from the soma and the retina was either fixed immediately or left in the bath for up to an hour at 35°C, to allow diffusion of Neurobiotin through gap junctions (Vaney, Reference Vaney1991).
Dendritic morphology
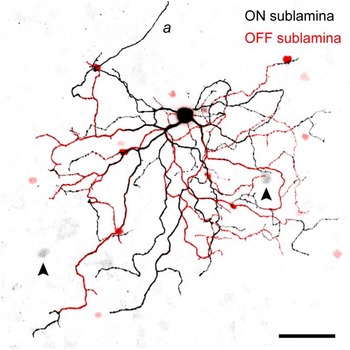
Neurobiotin injection revealed the full dendritic morphology of the UDs and also showed that the cells were tracer coupled to neighboring somata in the GCL and to smaller somata in the amacrine sublayer of the INL (Fig. 2). UDs had a large dendritic tree that branched in both sublamina a (the OFF sublamina) and sublamina b (the ON sublamina) of the IPL, consistent with their responses at both the onset and the termination of a visual stimulus (Fig. 2; Sivyer et al., Reference Sivyer, Taylor and Vaney2010). The soma was often located toward the dorsal edge of the dendritic field, as is typical of RGCs in the visual streak of rabbit retina. UDs gave rise to about four primary dendrites (mean = 3.8 ± 1.3, n = 19), which branched sparsely to form a dendritic tree with relatively few terminal dendrites (mean = 36 ± 9, n = 18). The dendrites often followed a meandering course, and most strikingly, dendrites in the distal OFF sublamina commonly dived back to the proximal ON sublamina (see below).
Negative image of a confocal projection of the bistratified dendritic tree of a physiologically characterized UD labeled with Neurobiotin. The OFF (red) and ON (black) arbors each represent the z-projection of three 1-μm confocal sections in the respective sublaminae; the axon (a) was taken from a single confocal section, which was combined with the z-projection through the ON arbor. The UD is tracer coupled to cells in the INL (smaller red somata) and the GCL (larger gray somata, arrowheads). Scale = 50 μm.

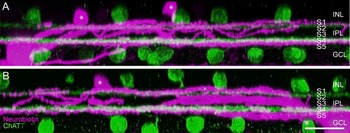
In some preparations, the retina was incubated with an antibody against choline acetyltransferase to label the two types of cholinergic amacrine cells, so as to provide fiducial reference levels for the stratification of the UDs (Fig. 3). The OFF cholinergic amacrine cells stratify at ~22% depth of the IPL, at the border of stratum 1 (S1) and S2, whereas the ON cholinergic amacrine cells stratify at ~69% depth of the IPL, in the middle of S4 (Brandon, Reference Brandon1987; Famiglietti, Reference Famiglietti1987). The OFF dendrites of the UDs branched in S1, distal to the OFF cholinergic amacrine cells, with the more distal dendrites lying at 5–10% depth of the IPL. The ON dendrites of the UDs branched near the border of S4 and S5 at 80–85% depth of the IPL, just proximal to the ON cholinergic amacrine cells. In the peak visual streak, where it is easier to resolve stratification because of the greater thickness of the IPL, it was apparent that some other dendrites branched at 30–50% depth of the IPL, near the border of the ON and OFF sublaminae; this middle ramification tended to be confined to the center of the dendritic field (Fig. 3B).
Dendritic stratification of a UD reconstructed from confocal micrographs. (A) Side projection of a UD labeled with Neurobiotin (magenta) and cholinergic amacrine cells labeled with anti-ChAT (green). The dendrites of the UD largely branch in either S1, distal to the OFF cholinergic stratum, or S4/5, proximal to the ON cholinergic stratum; asterisks denote the somata of tracer-coupled amacrine cells. (B) Side projection through a different plane of the same cell showing that some dendrites close to the soma branch in the middle of the IPL. S1–S5, stratum 1–5. Slice thickness = 50 μm, horizontal scale = 20 μm.

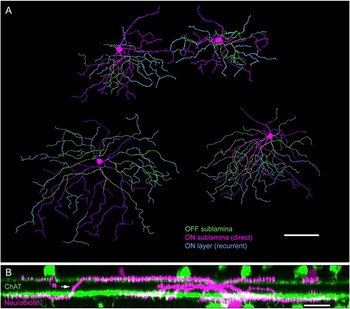
Although some primary dendrites ascended directly from the soma to the OFF sublamina, most of the OFF branching systems arose within 50–100 μm of the soma, as primary, secondary, or tertiary branches of dendrites running in the ON sublamina (Fig. 4A). The recurrent diving of dendrites from the OFF sublamina back to the ON sublamina was the most distinctive feature of the UDs’ dendritic morphology (Fig. 4B). Dendrites dived back at many points in the OFF arbor (mean = 14 ± 4; n = 18), leaving relatively few terminal dendrites in the OFF arbor; the ON arbor therefore contained about 4 times as many terminal dendrites as the OFF arbor (ON: mean = 30 ± 8, OFF: mean = 7 ± 4, n = 18, P < 0.0001).
Recurrent dendritic branching of UDs. (A) Neurobiotin-labeled UDs reconstructed from dendritic tracings of confocal micrographs showing a neighboring pair of UDs in the peak visual streak (top) and two other UDs located more peripherally. Some dendrites project and branch in either the ON arbor (magenta) or the OFF arbor (green), while characteristically many dendrites in the OFF arbor dive back to the ON arbor, where they branch and/or terminate (cyan). Scale = 100 μm. (B) Side projection of a UD labeled with Neurobiotin (magenta) and anti-ChAT (green) showing a recurrent dendrite diving from the OFF sublamina to the ON sublamina (arrow). The 50-μm slice is reconstructed from two z-series imaged at 63×, horizontal scale = 20 μm.

Because the recurrent ON dendrites often arose from the edge of the OFF arbor, they tended to occupy more peripheral parts of the ON arbor, whereas the ON dendrites arising directly from the soma occupied the central part of the ON arbor. Consequently, the ON arbor was consistently larger than the OFF arbor. The UDs in the peak visual streak had an ON arbor of 200 ± 20 μm diameter and an OFF arbor of 135 ± 15 μm diameter (n = 11). A few millimeters away, on the inferior slope of the visual streak, the UDs had an ON arbor of 320 ± 20 μm diameter and an OFF arbor of 220 μm ± 15 diameter (n = 4). The dendritic field areas were measured from confocal micrographs by tracing a convex polygon around the perimeter of the dendritic arbor in each sublamina (Fig. 5). The dendritic field area of the ON arbor was about twice that of the OFF arbor (mean = 2.2 ± 0.8×, n = 21, P < 0.001). The larger ON arbor contained a correspondingly larger length of dendrites (ON: mean = 1990 ± 750 μm, OFF: 950 ± 390 μm, n = 19, P < 0.0001); consequently, the density of dendrites was closely matched in the two arbors (ON: 44 ± 9 mm/mm2, OFF: 42 ± 10 mm/mm2, n = 19, P = 0.5).
Measurement of 20 Neurobiotin-filled UDs shows that the ON dendritic field is consistently larger than the OFF dendritic field.

Tracer-coupling pattern
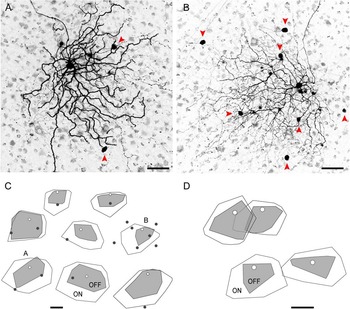
The Neurobiotin-labeled UDs showed a complex pattern of tracer coupling when the retina was left in the tissue chamber, allowing time for the Neurobiotin to diffuse through gap junctions. The UDs routinely showed tracer coupling to a population of small somata in the amacrine sublayer of the INL, and in many preparations, they also showed tracer coupling to one or more larger somata in the GCL (Figs. 2, 6A, and 6B). The GCL neurons appeared to be RGCs based on their soma size, and in the strongest coupled cells, a faintly labeled axon could be seen entering the nerve fiber layer, confirming that they were RGCs. In the same cells, faintly labeled dendrites could be followed into the IPL, where they were seen to branch in two layers, costratifying with the ON and OFF dendrites of the labeled UD. We conclude that the UDs are coupled to neighboring UDs because it is known that some types of RGCs show homologous tracer coupling to cells of the same type, but there are no reports that RGCs show heterologous coupling to other types of RGCs (Vaney, Reference Vaney1991; Völgyi et al., Reference Völgyi, Chheda and Bloomfield2009). Accidental labeling by Neurobiotin spillover could be discounted, as the coupled somata were located toward the edge of the dendritic field, away from the electrode track.
UDs show homologous tracer coupling to neighboring RGCs. (A, B) Negative images of a confocal z-projection through the GCL and the ON arbor of Neurobiotin-labeled UDs; the UD in (A) shows tracer coupling to two somata in the GCL, while the UD in (B) shows coupling to seven somata (arrowheads). Scales = 50 μm. (C) Drawings of the soma (white circle) and dendritic fields (OFF = gray, ON = white) of eight Neurobiotin-labeled UDs showing the location of tracer-coupled RGCs (black dots); the UDs are oriented with the dorsal edge toward the top. Scale = 100 μm. (D) Drawings of pairs of Neurobiotin-labeled UDs, one pair with ON dendritic fields that overlap widely and the other with ON dendritic fields that just touch. Scale = 100 μm.

Estimates of the cell density and dendritic field overlap of the UDs were made from the incomplete arrays of tracer-coupled UDs. In the eight UDs mapped in Fig. 6C, the distance from the Neurobiotin-filled soma to the nearest coupled soma was 0.45 ± 0.18 times the equivalent dendritic field diameter of the ON arbor. This ratio increases somewhat as more distant coupled somata are included. For two of the UDs, the mean distance to two coupled somata was 0.52 times the ON arbor diameter; for one particularly well coupled UD (Fig. 6B), the mean distance to six neighboring somata was 0.50 ± 0.18 times the ON arbor diameter. It therefore appears that the dendritic field of each UD extends about as far as the center of neighboring UDs, corresponding to a ratio of 0.5. In one case where sequential recordings were made from a pair of UDs with overlapping receptive fields, Neurobiotin filling confirmed that the ON arbors overlapped extensively, with each arbor almost reaching the center of the neighboring arbor; by contrast, the OFF arbors of this pair of cells were quite territorial, showing minimal overlap of their dendritic fields (Fig. 6D). In another pair of closely spaced UDs with largely separate receptive fields, the ON arbors barely touched, suggesting that they were separated by an unrecorded UD.
Assuming that (1) the UD somata approximate square packing and (2) the dendritic field of each UD extends to the center of neighboring UDs, then the cell density and dendritic field overlap of the UDs can be calculated from the dendritic field areas (A ON and A OFF) and the equivalent dendritic field diameter of the ON arbor (D ON)


For UDs on the peak visual streak, which had a mean dendritic field diameter of 200 and 135 μm for the ON and OFF arbors, respectively, the cell density is calculated to be 100 cells/mm2. The dendritic field overlap for the ON and OFF arbors is estimated to be 3.2 and 1.4×, respectively. Although the dendritic density was similar in the ON and OFF arbors for individual UDs, the greater overlap of the ON arbors means that, for the population of UDs, the dendritic density in the ON sublamina (~140 mm/mm2) would be over twice that in the OFF sublamina (~60 mm/mm2). If the UDs approximated hexagonal packing instead of square packing, their cell density and coverage factors would be increased by 2/√3 (1.15 ×).
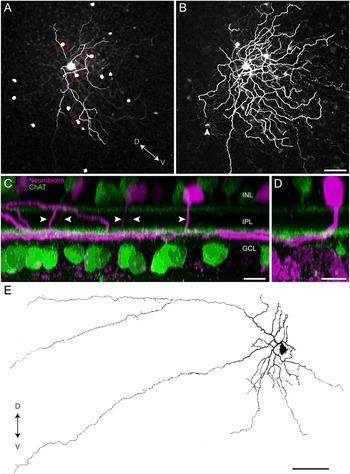
In addition to the homologous coupling to neighboring UDs, the Neurobiotin-labeled cells showed heterologous coupling to a uniform population of amacrine cells (Figs. 2A, 7A, and 7B). Their somata, which were present at a density of ~200 cells/mm2, formed a fairly regular array in the amacrine sublayer of the INL and were located both within and just outside the dendritic field of the Neurobiotin-labeled UD. In strongly coupled preparations, the detailed dendritic morphology of the coupled amacrine cells could be traced. Each soma gave rise to a single primary dendrite that descended vertically through much of the thickness of the IPL to S4, where the cells stratified tightly at the same level as the ON arbor of the UDs (Fig. 7C). The amacrine cells formed a loosely branched tree with a dendritic field diameter of ~200 μm, although some isolated processes extended more ventrally. The tracer-coupled amacrine cells would therefore have at least a sixfold dendritic field overlap in the visual streak. Interestingly, the soma was often located toward the dorsal edge of the dendritic field, as seen for the UDs, and this spatial offset accounts for the curving course apparent in some primary dendrites (Fig. 7D). In many instances, the primary dendrite appeared to make passing contact with a UD dendrite in the OFF sublamina, and the frequency of such contacts seemed higher than would be expected given the sparse branching of the OFF arbor (Fig. 7A).
UDs show heterologous tracer coupling to underlying amacrine cells. (A) Confocal z-projection through the INL and the OFF arbor of a Neurobiotin-labeled UD showing the somata of tracer-coupled amacrine cells; the primary dendrite of the amacrine cells often contacts the OFF arbor of the UD as it descends to the ON sublamina (red circles). (B) Single confocal section of the same UD taken at the level of the ON arbor showing the dendritic tree of the tracer-coupled amacrine cells. Scale for (A and B) = 50 μm. (C) Side projection of a Neurobiotin-labeled UD and tracer-coupled amacrine cells (magenta) and cholinergic amacrine cells (green) showing that the primary dendrite (arrowheads) of the amacrine cells descends vertically through the IPL to the ON sublamina. Slice thickness = 100 μm, horizontal scale = 10 μm. (D) The soma of the tracer-coupled amacrine cells is often shifted dorsally from the dendritic tree. Slice thickness = 30 μm, horizontal scale = 10 μm. (E) An amacrine cell injected with Lucifer yellow, 3.5 mm inferior of the visual streak, has the same distinctive morphology as the tracer-coupled amacrine cells; the complete dye filling reveals that this cell gives rise to two axon-like processes. D = dorsal, V = ventral, scale = 100 μm.

Random filling of amacrine cells with Lucifer yellow in the inferior retina revealed the full morphology of an amacrine cell that appeared identical to the tracer-coupled cells (Fig. 7E). The Lucifer-filled cell, which was located 3.5 mm inferior of the visual streak, gave rise to a single primary dendrite that descended through the depth of the IPL before stratifying close to the GCL. The proximal dendritic tree had a diameter of ~300 μm diameter and gave rise to two axon-like processes that extended for ~700 μm. These processes appeared to arise from a waist-like dendritic thinning, similar to that described for several types of axon-bearing amacrine cells in the rabbit retina (Vaney et al., Reference Vaney, Peichl and Boycott1988; Vaney, Reference Vaney2004). The soma of the Lucifer-filled cell was located toward one side of the dendritic tree, opposite the axon-like processes, similar to the tracer-coupled cells. However, the soma of the Lucifer-filled cell in midperipheral retina was shifted laterally, whereas the somata of the tracer-coupled cells in the visual streak were shifted dorsally.
It would be expected that unistratified medium-field amacrine cells would be GABAergic (Vaney, Reference Vaney1990); so to test this hypothesis, tracer-coupled cells were immunolabeled with a variety of markers to test whether the cells are GABAergic or glycinergic (Wright et al., Reference Wright, Macqueen, Elston, Young, Pow and Vaney1997). The tracer-coupled amacrine cells were immunonegative for both glycine (Fig. 8A) and glycine transporter 1 (GlyT-1; Fig. 8B), but were weakly immunopositive for GABA (Fig. 8C), indicating that they are indeed GABAergic.
Neurotransmitter characterization of tracer-coupled amacrine cells. The tracer-coupled somata (left panels) are immunonegative for glycine (A) and the glycine transporter GlyT-1 (B) but immunopositive for GABA (C). Scale = 10 μm.

Discussion
In this study, we have characterized the dendritic morphology of a large sample of transient UDs, whose functional identity was confirmed by mapping their receptive field properties before dye filling. There are only two examples of the morphology of physiologically identified UDs in the literature: Amthor et al. (Reference Amthor, Takahashi and Oyster1989b) showed a sustained UD in rabbit retina that had been filled with horseradish peroxidase, while we showed a transient UD that had been labeled with Neurobiotin in our recent paper characterizing the complex firing and inhibitory inputs of the UDs (Sivyer et al., Reference Sivyer, Taylor and Vaney2010). We argue below that the dendritic morphology of our Neurobiotin-labeled transient UDs differs in at least one respect from the HRP-filled sustained UD and from the Golgi-stained type 2 bistratified (BS2) cells that Famiglietti (Reference Famiglietti2009) considered to be equivalent to the HRP-filled cell.
The dendritic tree of the transient UDs is largely bistratified, and a prominent feature of the transient UDs is their recurrent branching, with many of the dendrites in the OFF sublamina not terminating there but diving back to the ON sublamina, where they branch further or terminate. Consequently, the ON dendritic field is about 50% wider than the OFF dendritic field, having an equivalent dendritic field diameter of 200–300 μm in the visual streak. The Neurobiotin-labeled UDs showed weak homologous tracer coupling to nearby UDs. The ON arbors extend as far as the center of neighboring UDs, indicating that they have about a 3.2-fold dendritic field overlap, which is similar to the 3.1-fold overlap of the OFF beta RGCs in cat retina (Wässle et al., Reference Wässle, Boycott and Illing1981). By contrast, the smaller OFF arbors have about a 1.4-fold dendritic field overlap, similar to the 1.3- and 1.5-fold overlap of the ON and OFF arbors, respectively, of the ON–OFF DSGCs in rabbit retina (Vaney, Reference Vaney1994a). With a 3.2-fold dendritic field overlap, the transient UDs would be present at a density of ~100 cells/mm2 on the peak visual streak. Given that the density of RGCs at that location is ~5000 cells/mm2 (Provis, Reference Provis1979; Vaney, Reference Vaney1980; Oyster et al., Reference Oyster, Takahashi and Hurst1981), we estimate that the transient UDs account for only 2% of all the RGCs in rabbit retina.
Distinguishing UDs from other RGCs
At first glance, the transient UDs appear to have the same morphology as both the sustained UD injected with HRP by Amthor et al. (Reference Amthor, Takahashi and Oyster1989b) and the Golgi-stained BS2 cells labeled by Famiglietti (Reference Famiglietti2009). All have large, sparsely branched bistratified dendritic trees, with an ON arbor that is larger than the OFF arbor. Measurements of the stratification of the BS2 ganglion cells showed that they branch at 5–15% and 80–90% depth of the IPL in S1 and S4/5, respectively, very similar to the stratification of our Neurobiotin-labeled UDs. However, the cells in the other studies largely lack the recurrent dendrites that are so prominent in the transient UDs: the 18 analyzed cells averaged 14 ± 4 recurrent dendrites per cell and all had at least 8 recurrent dendrites. The sustained UD that was filled with HRP had only one recurrent dendrite (Amthor et al., Reference Amthor, Takahashi and Oyster1989b) and the six BS2 cells illustrated by Famiglietti (Reference Famiglietti2009) gave rise to two, one, or no recurrent dendrites. While incomplete impregnation may be a problem with Golgi staining, it is notable that the smallest BS2 on the peak visual streak had a dendritic field diameter of ~275 μm, which is 1.6 × wider than the smallest transient UDs measured in this study (~175 μm). This adds further support to the idea that the BS2 cells are a different cell type than those characterized in this study. Whether they correspond to the HRP-filled sustained UD, or perhaps to a type of bistratified orientation-selective RGC that was filled in the same study (Amthor et al., Reference Amthor, Takahashi and Oyster1989b), remains to be determined.
While closer examination revealed that the dendritic morphology of the UDs differed in important ways from the drawings of Golgi-stained BS2 cells, the same could not be said when the UDs were compared with the “bistratified diving” RGCs that were described recently by Hoshi et al. (Reference Hoshi, Liu, Massey and Mills2009). The stratification levels, dendritic branching pattern, and recurrent dendrites of the diving cells are very similar to those of the transient UDs, although a quantitative comparison would be premature without knowing the retinal eccentricity of the diving cells. Whereas the maintained firing of the UDs is suppressed at both light ON and light OFF, the diving cells fire strongly at light ON. The diving cells probably correspond to the “ON bistratified” cells recorded by Roska and Werblin (Reference Roska and Werblin2001) and Roska et al. (Reference Roska, Molnar and Werblin2006), who showed that they receive excitation but not inhibition at light ON and only inhibition at light OFF. By contrast, the UDs receive substantial inhibition but negligible excitation at both light ON and light OFF (Sivyer et al., Reference Sivyer, Taylor and Vaney2010), further arguing that they are functionally distinct from the ON bistratified cells.
This raises two very interesting possibilities. First, the transient UDs and the ON bistratified cells are distinct RGC types with dendritic morphologies that are qualitatively identical but may be separated in the future by quantitative analysis. Second, they are the same type of RGC but their receptive field properties differ radically in different experiments, perhaps as a consequence of the adaptational state or the recording conditions. For example, opening the gap junctions between the UDs and the coupled ON amacrine cells could elicit excitation at light ON. However, it is not clear how the inhibition seen in UDs at light ON could be abolished because the synaptic inputs to the UDs were very robust over a wide range of stimulus conditions. Roska and Werblin (Reference Roska and Werblin2001) noted that 5% of the ~200 RGCs recorded in their combined physiological and morphological study were ON bistratified cells, but they did not report finding any UDs. We note that, until recently, most recordings of UDs have been made in vivo, indicating that their unusual receptive field properties are not a pathological response to in vitro conditions (Levick, Reference Levick1967; Caldwell & Daw, Reference Caldwell and Daw1978; Vaney et al., Reference Vaney, Levick and Thibos1981).
The key to addressing these two possibilities may lie in the identity of the coupled amacrine cells. Different types of RGCs show different patterns of tracer coupling, and this can be as useful as either dendritic morphology or receptive field properties for classifying RGCs (Vaney, Reference Vaney1994b; Völgyi et al., Reference Völgyi, Chheda and Bloomfield2009). The Neurobiotin-labeled UDs showed heterologous tracer coupling to a population of GABAergic amacrine cells that give rise to a single dendrite that descends vertically to the border of S4 and S5, where it branches in the same plane as the UDs. These cells we call here “St4/5 amacrine cells.”
The coupled St4/5 cells are present at a density of ~200 cells/mm2 on the visual streak and therefore account for only 0.7% of the ~30,000 amacrine cells/mm2 at that location (Strettoi & Masland, Reference Strettoi and Masland1995). Interestingly, only 0.8% of the amacrine cells randomly injected with Lucifer yellow in midperipheral retina had the distinctive morphology of St4/5 amacrine cells (1 cell out of 131 injected cells). It appears that the St4/5 cells are not included in the extensive catalog of rabbit amacrine cells compiled by MacNeil and Masland (Reference MacNeil and Masland1998) and MacNeil et al. (Reference MacNeil, Heussy, Dacheux, Raviola and Masland1999), perhaps because those studies were based on random photo filling of only 261 cells, which should have encountered only two St4/5 cells. These authors report that only four types of medium- or wide-field amacrine cells stratify in S4 or S5, namely the two types of indoleamine-accumulating cells, the displaced starburst (cholinergic) cells, and the WF4 cells, whose wide-field morphology is similar to that of the neurofibrillar amacrine cells (Vaney et al., Reference Vaney, Peichl and Boycott1988).
The GABAergic St4/5 cells are connected to the UDs by electrical synapses and, therefore, could not mediate the pronounced glycinergic inputs to UDs at light ON and OFF. Hoshi et al. (Reference Hoshi, Liu, Massey and Mills2009) did not report whether the Neurobiotin-labeled bistratified diving ganglion cells showed tracer coupling, but if they did show coupling to the St4/5 cells, this would provide strong support for the possibility that UDs and diving cells are the same type of RGC.
Diversity of bistratified RGCs
For the time being, we assume that the diving bistratified cells (Hoshi et al., Reference Hoshi, Liu, Massey and Mills2009) are the same type as the ON bistratified cells (Roska & Werblin, Reference Roska and Werblin2001; Roska et al., Reference Roska, Molnar and Werblin2006) and that these cells are a distinct type from the transient UDs, notwithstanding the close similarities in their morphology. We argue above that the transient UDs are morphologically distinct from the BS2 cells (Famiglietti, Reference Famiglietti2009), which resemble the HRP-filled sustained UD (Amthor et al., Reference Amthor, Takahashi and Oyster1989b). This suggests that the transient and sustained UDs are distinct types of RGCs rather than being the same type recorded under different adaptational states, for example. Further support for this conclusion is provided by studies on the homologous cells in cat retina, where transient and sustained types of suppressed-by-contrast RGCs have been identified (Rodieck, Reference Rodieck1967; Cleland & Levick, Reference Cleland and Levick1974; Mastronarde, Reference Mastronarde1985). Other types of bistratified RGCs in rabbit retina include the ON–OFF DSGCs (Amthor et al., Reference Amthor, Oyster and Takahashi1983), the G3 ganglion cells (Rockhill et al., Reference Rockhill, Daly, MacNeil, Brown and Masland2002; Hoshi et al., Reference Hoshi, Liu, Massey and Mills2009), and possibly the type 3 bistratified (BS3) cell, whose characterization depends on a single Golgi-stained example (Famiglietti, Reference Famiglietti2009). In addition, we have recently characterized a novel type of RGC in rabbit retina that is narrowly bistratified in S2 and S3 of the IPL and responds transiently at light ON and light OFF (B. Sivyer, unpublished) These “transient ON–OFF” cells are morphologically distinct from the local edge detectors, which give more sustained responses at light ON and OFF, and they appear morphologically and functionally homologous to the theta cells in cat retina (O’Brien et al., Reference O’Brien, Isayama and Berson1999; Isayama et al., Reference Isayama, Berson and Pu2000).
It appears, therefore, that there are at least six or seven distinct types of bistratified RGCs in rabbit retina. Other types may remain to be discovered. For example, the melanopsin-containing RGCs have not been characterized in rabbit retina and may include a homolog of the bistratified type 3 melanopsin cell in mouse retina (Viney et al., Reference Viney, Balint, Hillier, Siegert, Boldogkoi, Enquist, Meister, Cepko and Roska2007). There are clearly many more types of bistratified RGCs in rabbit retina than the two types (ON–OFF DSGCs, G3 cells) identified in a photo-filling study that is regarded as the definitive morphological survey of rabbit RGCs (Rockhill et al., Reference Rockhill, Daly, MacNeil, Brown and Masland2002). However, it would not be difficult to accommodate four or five additional types of bistratified RGCs if each type accounted for only 2% of the RGCs, as is the case with the transient UDs. The number of types of bistratified RGCs in rabbit retina appears similar to the four to six morphological types identified in mouse retina in recent years (Badea & Nathans, Reference Badea and Nathans2004; Coombs et al., Reference Coombs, van der List, Wang and Chalupa2006; Völgyi et al., Reference Völgyi, Chheda and Bloomfield2009).
Given that the suppressed-by-contrast RGCs in cat retina are homologous to the UDs in rabbit retina, the cat retina should contain RGCs with a bistratified morphology comparable to that of the rabbit cells. However, only two types of bistratified RGCs have been identified in the cat: one is the theta cell (Isayama et al., Reference Isayama, Berson and Pu2000) and the other has the characteristic morphology of an ON–OFF DSGC (Famiglietti, Reference Famiglietti1987). In mouse retina, conversely, there are no recordings of RGCs that are suppressed by contrast, but RGCs have been identified with a similar morphology to rabbit UDs. The type 1 bistratified ganglion cell in mouse retina has a large sparsely branched dendritic tree and the dendrites stratify proximal and distal to the cholinergic strata (Schubert et al., Reference Schubert, Maxeiner, Kruger, Willecke and Weiler2005); the type 1 bistratified cell type may correspond to the G12 cell described by Völgyi et al. (Reference Völgyi, Chheda and Bloomfield2009). Although the dendrites of the type 1 bistratified cell may dive retroflexively from the OFF sublamina to the ON sublamina, neither the type 1 cell nor the G12 cell in mouse retina showed tracer coupling, unlike rabbit UDs.
Acknowledgments
We thank Rowland Taylor for writing the visual stimulus software, Nick Nacsa for technical assistance, Refik Kanjhan for helpful suggestions, and David Pow for his generous donation of antibodies. This research was supported by Australian Research Council Centre of Excellence Grant (CE0561903) to D.I.V., National Health & Medical Research Council Project Grant (511242) and Principal Research Fellowship (to D.I.V.), and a University of Queensland Postgraduate Scholarship (to B.S.).