Introduction
Natural hazards remain a major threat to population health and the resilience of health systems, and their consequences extend well beyond the immediate destructive phase.Reference Nuzzo, Meyer and Snyder 1 –Reference Leaning and Guha-Sapir 3 Geophysical and hydrological hazard-related emergency events can result in prolonged displacement, disruption of essential services, environmental contamination, and sustained pressure on emergency and public health infrastructures.Reference Euripidou and Murray 4 –Reference Saulnier, Brolin Ribacke and Von Schreeb 7 In Europe, repeated catastrophic flooding and earthquakes in the Mediterranean basin highlight the continent’s ongoing vulnerability to both rapid-onset and cascading hazards.Reference Llasat, Llasat-Botija and Prat 8 , Reference Dallo, Marti and Valenzuela 9 Furthermore, the intensification of heavy precipitation due to climate change, combined with the increasing concentration of populations and assets in hazard-prone areas, accentuates the need for a precise characterization of disaster patterns across the region.Reference Di Martire, De Rosa and Pesce 10
Importantly, disaster frequency should not be interpreted as a direct proxy for human impact. Event counts capture the recurrence of hazard-related emergencies, whereas disaster burden depends on the interaction between hazard characteristics, population exposure, and vulnerability.Reference Peduzzi, Dao and Herold 11 –Reference Formetta and Feyen 13 Recurrent events may therefore generate limited casualties when exposure or vulnerability is low, while less frequent but high-intensity events affecting vulnerable or densely exposed populations may produce substantial mortality, injuries, displacement, and health-service disruption. This distinction emphasizes the need to move beyond preparedness strategies based primarily on event recurrence or probability, toward resilience-oriented approaches to disruptive events.Reference McMillan, Pescaroli and Gordon 14 At the same time, the analysis of past catastrophic events remains valuable, as it can identify recurrent vulnerability pathways, service disruptions, and response gaps that inform future risk-reduction strategies.
In this study, disaster human impact is defined operationally as the number of deaths and injured people reported for each event in the Emergency Events Database (EM-DAT, CRED/UCLouvain, Brussels, Belgium).Reference Delforge, Wathelet and Below 15 Although this definition does not encompass the entire range of disaster-related health consequences, it provides a standardized basis for comparing mortality and injury burdens across hazard groups and European subregions.
Within this analytical framework, geophysical hazards include earthquakes, volcanic activity, and dry mass movements, whereas hydrological hazards include floods, wet mass movements, and wave action, according to the EM-DAT classification.Reference Delforge, Wathelet and Below 15 Landslides are therefore included when recorded as mass-movement events, either under dry geophysical conditions or under wet hydrological conditions.Reference Delforge, Wathelet and Below 15 This distinction is relevant in Europe because the two hazard groups are associated with different spatial patterns and public health implications. Hydrological hazards are closely linked to river basins, intense or prolonged precipitation, floodplain exposure, transportation interruption, displacement, and economic losses.Reference Di Martire, De Rosa and Pesce 10 , Reference Silva, Eleutério and Apel 16 Geophysical hazards are more strongly concentrated in seismically and volcanically active areas, particularly in the Euro-Mediterranean region, where they may produce abrupt trauma burden, infrastructure damage, hospital disruption, and long recovery needs. Reference Di Martire, De Rosa and Pesce 10 , Reference Mavrouli, Mavroulis and Lekkas 17
Recent European events, including the 2021 Ahr Valley flood, the 2023 floods in Emilia-Romagna, and the widespread 2024 flooding associated with Storm Boris and the Valencia event, illustrate how hydrological hazards can cause substantial mortality, displacement, health care system impacts, and economic losses.Reference Silva, Eleutério and Apel 16 , Reference Thieken, Bubeck and Heidenreich 18 –Reference Valente, Zanellati and Facci 20 Similarly, major European earthquakes, particularly in Italy and other Mediterranean regions, show how less frequent geophysical events can produce concentrated mortality, injuries, structural damage, and prolonged public health consequences.Reference Mavrouli, Mavroulis and Lekkas 17 , 21 From our perspective, these patterns reinforce the need for systematic and comparable evidence that distinguishes disaster occurrence from reported human impact across hazard types and European subregions. This rationale is consistent with the Sendai Framework for Disaster Risk Reduction, which identifies understanding disaster risk as its priority and emphasizes the systematic collection, analysis, and use of disaster-risk and loss data to inform prevention, preparedness, response, and recovery. 22
EM-DAT addressed this need by providing harmonized information on the occurrence and human impact of major catastrophic events, and it is one of the most widely used international resources for disaster epidemiology.Reference Delforge, Wathelet and Below 15 Previous analyses using EM-DAT data indicate that hydrological events, particularly floods, account for a substantial share of global disaster occurrence, while geophysical events, such as earthquakes, although less frequent, are often associated with high mortality in individual events.Reference Tin, Cheng and Le 23 However, global analyses often aggregate findings at the worldwide or multi-continental level, limiting the resolution of region-specific patterns. European studies have predominantly focused on specific aspects, such as earthquake early warning systems,Reference Cremen, Galasso and Zuccolo 24 flood risk communication,Reference Thieken, Bubeck and Heidenreich 18 , Reference Fernández-Nóvoa, González-Cao and García-Feal 25 , Reference Papagiannaki, Kotroni and Lagouvardos 26 or post-volcanic health effects,Reference Hansell, Horwell and Oppenheimer 27 , Reference Hlodversdottir, Petursdottir and Carlsen 28 rather than on integrated, cross-hazard epidemiological comparisons at the continental scale. To our knowledge, no prior study has systematically compared the frequency and reported human impacts, specifically fatalities and injuries, of geophysical and hydrological hazard-related disasters across all European subregions over a 26-year period using a harmonized analytical framework.
In brief, this study was designed to provide a standardized descriptive comparison of geophysical and hydrological hazard-related disasters recorded in Europe over a 26-year period (2000–2025), utilizing the event definitions and reporting structure of the EM-DAT database.Reference Delforge, Wathelet and Below 15 The primary objective is to describe the frequency, geographical distribution, mortality, and injury burden of these two hazard groups across European subregions. A secondary objective is to formally compare the distributions of deaths and injuries across geophysical and hydrological events using statistical tests. Through this approach, the study seeks to produce data-driven analyses that may contribute to research development and policy planning for disaster risk reduction and public health policy in Europe.
Methods
Study Design and Data Sources
This study is a retrospective, observational, secondary analysis of publicly available disaster records, specifically examining geophysical and hydrological hazard-related disasters. The study was reported in accordance with the Strengthening the Reporting of Observational Studies in Epidemiology (STROBE) Statement for cross-sectional studiesReference Von Elm, Altman and Egger 29 (see Supplementary Materials—A).
Data were obtained from the Emergency Events Database (https://www.emdat.be/), maintained by the Centre for Research on the Epidemiology of Disasters (CRED), UCLouvain, Brussels, Belgium. 30 The database provides open-access data for non-commercial use and compiles disaster information from multiple validated sources, including United Nations agencies, governmental and non-governmental organizations, insurance and reinsurance companies, research institutes, and press agencies. Within EM-DAT, a disaster is defined as a situation or event that overwhelms local capacity and necessitates external assistance at the national or international level, typically an unforeseen, often sudden event causing major damage, destruction, and human suffering.Reference Delforge, Wathelet and Below 15 Events are entered into the database when at least one of the following criteria is fulfilled: (i) 10 or more deaths, including missing persons presumed dead; (ii) 100 or more affected persons; (iii) declaration of a state of emergency; or (iv) a call for international assistance.Reference Delforge, Wathelet and Below 15 All hazard categories, definitions, and hierarchical classifications were prespecified by the database. For natural hazards, EM-DAT currently follows the 2014 Integrated Research on Disaster Risk (IRDR) Peril Classification and Hazard Glossary, which organizes natural disasters into six main subgroups: geophysical, hydrological, meteorological, climatological, biological, and extra-terrestrial, with additional type and subtype levels.Reference Delforge, Wathelet and Below 15 , 31 Because the database reports disaster impacts at the country level, a single transboundary disaster may generate multiple country-specific entries in the public table. As the present investigation used only aggregate, anonymized, publicly accessible data and did not involve human participants, animals, or identifiable personal information, ethics committee approval and informed consent were not required.
Study Region
The analysis was restricted to Europe, as defined in the EM-DAT public table according to the United Nations M49 regional framework adopted by the database.Reference Delforge, Wathelet and Below 15 Accordingly, Europe was subdivided into Eastern Europe (Belarus, Bulgaria, Czechia, Hungary, Poland, Republic of Moldova, Romania, Russian Federation, Slovakia, and Ukraine), Northern Europe (Åland Islands, Denmark, Estonia, Faroe Islands, Finland, Guernsey, Iceland, Ireland, Isle of Man, Jersey, Latvia, Lithuania, Norway, Svalbard and Jan Mayen Islands, Sweden, and the United Kingdom of Great Britain and Northern Ireland), Southern Europe (Albania, Andorra, Bosnia and Herzegovina, Croatia, Gibraltar, Greece, Holy See, Italy, Malta, Montenegro, North Macedonia, Portugal, San Marino, Serbia, Slovenia, and Spain), and Western Europe (Austria, Belgium, France, Germany, Luxembourg, Monaco, the Netherlands, Liechtenstein, and Switzerland). Because the public table of the database also includes certain historical or broader territorial entities, records attributed to entities such as Czechoslovakia, Yugoslavia, Serbia and Montenegro, the Soviet Union, the Azores Islands, and the Channel Islands were retained whenever present and analyzed according to the European subregion assigned by the database at the time of extraction.
Search Strategy
On 8 March 2026, the EM-DAT database (https://www.emdat.be/) was queried for hazard-related disasters using an a priori search strategy with the following filters: group “natural,” region “Europe,” and occurrence period between 1 January 2000 and 31 December 2025. From this dataset, records were further restricted to 2 subgroups—geophysical and hydrological—to enable a focused descriptive comparison between hazard types with distinct occurrence patterns and reported impacts. Eligible geophysical hazard-related disaster types included earthquake, mass movement (dry), and volcanic activity. Eligible hydrological hazard-related disaster types included flood, mass movement (wet), and wave action. Due to the hierarchical classification structure of the database, subgroup, type, and subtype assignments were retained as originally coded and were not reclassified by the investigators.
Data Extraction
For each eligible record, the following variables were extracted: subgroup, type, country, European subregion, event start date, event end date, total deaths, and number of injured persons. In accordance with EM-DAT definitions, “Total Deaths” includes confirmed deaths and missing persons presumed dead, whereas “No. Injured” refers to individuals sustaining physical injuries, trauma, or illness requiring immediate medical assistance because of the disaster.Reference Delforge, Wathelet and Below 15 Given the known variability in completeness across disaster databases, all variables were analyzed as reported in the database, without post hoc reconstruction of missing counts. No imputation procedures were applied, and complete available-case analysis was used for each variable-specific summary, given the descriptive nature of the study.
Analysis
Extracted records were first organized in Microsoft Excel (Microsoft Corp., Redmond, WA, USA) and subsequently imported into RStudio (version 2024.12.1; Posit Software, Boston, MA, USA) for statistical analysis in R (version 4.4.2; R Core Team, 2024). In line with the study objectives, analyses were descriptive and comparative. Categorical variables were summarized as absolute frequencies and percentages, whereas continuous variables were summarized as mean and standard deviation when normally distributed, or as median when non-normally distributed, as determined by the Shapiro-Wilk test. Results were stratified by geographic location, subgroup, and type, with particular attention to event-related deaths, injuries, and dates of occurrence.
For variable-specific inferential analyses, only records with complete data for the outcome of interest were included, following an available-case analysis approach. The number of records with available data is reported alongside each comparison. Before group comparison, the normality of the distributions of total deaths and the number of injured persons for the geophysical and hydrological groups was assessed using the Shapiro-Wilk test, with a significance threshold set at P <0.05. Given the significant departure from normality observed for all outcome variables in both subgroups, non-parametric methods were used for inferential comparisons. Specifically, the Wilcoxon rank-sum test (Mann-Whitney U) was used to compare the medians of total deaths and the number of injured persons between the geophysical- and hydrological-hazard-related disaster subgroups. A 2-sided P-value <0.05 was considered statistically significant for all tests.
In addition to subgroup-level comparisons, a focused comparison was performed between earthquakes and floods, as the most frequently reported event types within the geophysical and hydrological subgroups, respectively. Descriptive statistics were reported separately for each group. Given the non-normal distribution of the outcome variables, differences in deaths and injuries between earthquakes and floods were assessed using the Wilcoxon rank-sum test. To explore potential temporal trends, correlations between calendar year and outcome variables (deaths and injuries) were evaluated using Spearman’s rank correlation coefficient, as a non-parametric measure of monotonic association.
Results
Overall Frequency and Annual Distribution
From 2000 to 2025, a total of 566 events were recorded, including 56 geophysical and 510 hydrological events. On average, 19.62 hydrological events occurred each year (SD 10.15), compared with 2.15 geophysical events annually (SD 1.4). The annual distribution of hydrological events showed marked interannual variability, with the highest number recorded in 2005. Geophysical events consistently remained low, never surpassing 5 occurrences per year (Figure 1).
Yearly Counts of Geophysical and Hydrological Hazard-Related Disasters in Europe, 2000-2025.

Figure 1. Long description
The vertical Y axis is labeled Number of events and ranges from 0 to 45 in increments of 5. The horizontal X axis is labeled Year and spans from 2000 to 2025. A legend at the bottom identifies solid black bars as Geophysical and patterned gray bars as Hydrological.
Throughout the period, hydrological events consistently outnumber geophysical events. Key data points include
* 2000: 4 geophysical, 37 hydrological.
* 2005: 0 geophysical, 41 hydrological (the peak for hydrological events).
* 2010: 2 geophysical, 35 hydrological.
* 2015: 0 geophysical, 16 hydrological.
* 2017: 5 geophysical (the peak for geophysical events), 11 hydrological.
* 2021: 2 geophysical, 30 hydrological.
* 2025: 1 geophysical, 6 hydrological.
The trend for hydrological events shows significant volatility with major peaks in 2000, 2005, 2010, and 2021, while geophysical events remain relatively low, fluctuating between 0 and 5 events per year.
Distribution of Disaster Types and Subtypes
Of the 566 events recorded in Europe from 2000 to 2025, floods were the predominant type, accounting for 492 events (86.93%). Earthquakes accounted for 52 events (9.19%), wet mass movements for 18 events (3.18%), while volcanic activity accounted for 3 events (0.53%), and dry mass movements for a single event (0.18%) (Table 1).
Distribution of geophysical and hydrological hazard-related disasters by type in Europe, 2000-2025

Table 1. Long description
The table presents data on 5 natural disaster types recorded in Europe from 2000 to 2025. Three metrics are reported for each type: the number of disaster events, total deaths, and number of injured persons, each expressed as a count and as a percentage of the overall total.
-
Earthquake recorded 52 events, 788 deaths, and 5,368 injured. These represent 9.19% of events, 22.22% of deaths, and 37.10% of injuries.
-
Flood recorded 492 events, 2,493 deaths, and 9,037 injured. These represent 86.93% of events, 70.28% of deaths, and 62.45% of injuries.
-
Mass movement (dry) recorded 1 event, 8 deaths, and 0 injured. These represent 0.18% of events, 0.23% of deaths, and 0% of injuries.
-
Mass movement (wet) recorded 18 events, 258 deaths, and 37 injured. These represent 3.18% of events, 7.27% of deaths, and 0.26% of injuries.
-
Volcanic activity recorded 3 events, 0 deaths, and 28 injured. These represent 0.53% of events, 0% of deaths, and 0.19% of injuries.
-
Total across all types: 566 events, 3,547 deaths, and 14,470 injured.
Floods are by far the most frequent disaster type, accounting for nearly 87% of all events, 70% of deaths, and 62% of injuries. Earthquakes, while less frequent, are responsible for the highest share of injured persons per event, representing over 37% of all injuries.
Source: Emergency Events Database (EM-DAT), CRED/UCLouvain, Brussels, Belgium.
During the study period, riverine floods were the most common subtype, accounting for 281 events (49.65%), followed by general floods with 104 events (18.37%) and flash floods with 102 events (18.02%) (Table 2).
Distribution of geophysical and hydrological hazard-related disasters by subtype in Europe, 2000-2025

Table 2. Long description
The table presents data on 12 natural disaster subtypes recorded in Europe from 2000 to 2025. Three metrics are reported for each subtype: the number of disaster events, total deaths, and number of injured persons, each expressed as a count and as a percentage of the overall total.
-
Ash fall recorded 2 events, 0 deaths, and 0 injured. These represent 0.35% of events, 0% of deaths, and 0% of injuries.
-
Avalanche (wet) recorded 8 events, 192 deaths, and 0 injured. These represent 1.41% of events, 5.41% of deaths, and 0% of injuries.
-
Coastal flood recorded 5 events, 13 deaths, and 0 injured. These represent 0.88% of events, 0.37% of deaths, and 0% of injuries.
-
Flash flood recorded 102 events, 606 deaths, and 5,241 injured. These represent 18.02% of events, 17.08% of deaths, and 36.22% of injuries.
-
Flood (general) recorded 104 events, 780 deaths, and 1,467 injured. These represent 18.37% of events, 21.99% of deaths, and 10.14% of injuries.
-
Ground movement recorded 51 events, 788 deaths, and 5,364 injured. These represent 9.01% of events, 22.22% of deaths, and 37.07% of injuries.
-
Landslide (wet) recorded 7 events, 47 deaths, and 32 injured. These represent 1.24% of events, 1.33% of deaths, and 0.22% of injuries.
-
Mudslide recorded 3 events, 19 deaths, and 5 injured. These represent 0.53% of events, 0.54% of deaths, and 0.03% of injuries.
-
Riverine flood recorded 281 events, 1,094 deaths, and 2,329 injured. These represent 49.65% of events, 30.84% of deaths, and 16.10% of injuries.
-
Rockfall (dry) recorded 1 event, 8 deaths, and 0 injured. These represent 0.18% of events, 0.23% of deaths, and 0% of injuries.
-
Tsunami recorded 1 event, 0 deaths, and 4 injured. These represent 0.18% of events, 0% of deaths, and 0.03% of injuries.
-
Volcanic activity (general) recorded 1 event, 0 deaths, and 28 injured. These represent 0.18% of events, 0% of deaths, and 0.19% of injuries.
-
Total across all subtypes: 566 events, 3,547 deaths, and 14,470 injured.
Riverine flood is the most frequent subtype, accounting for nearly 50% of all events. Flash floods and riverine floods together represent the largest share of injuries with over 52%. Ground movement, while representing 9% of events, accounts for the highest share of injured persons with 37.07%, followed closely by flash floods with 36.22%.
Source: Emergency Events Database (EM-DAT), CRED/UCLouvain, Brussels, Belgium.
Geographical Distribution Across European Subregions
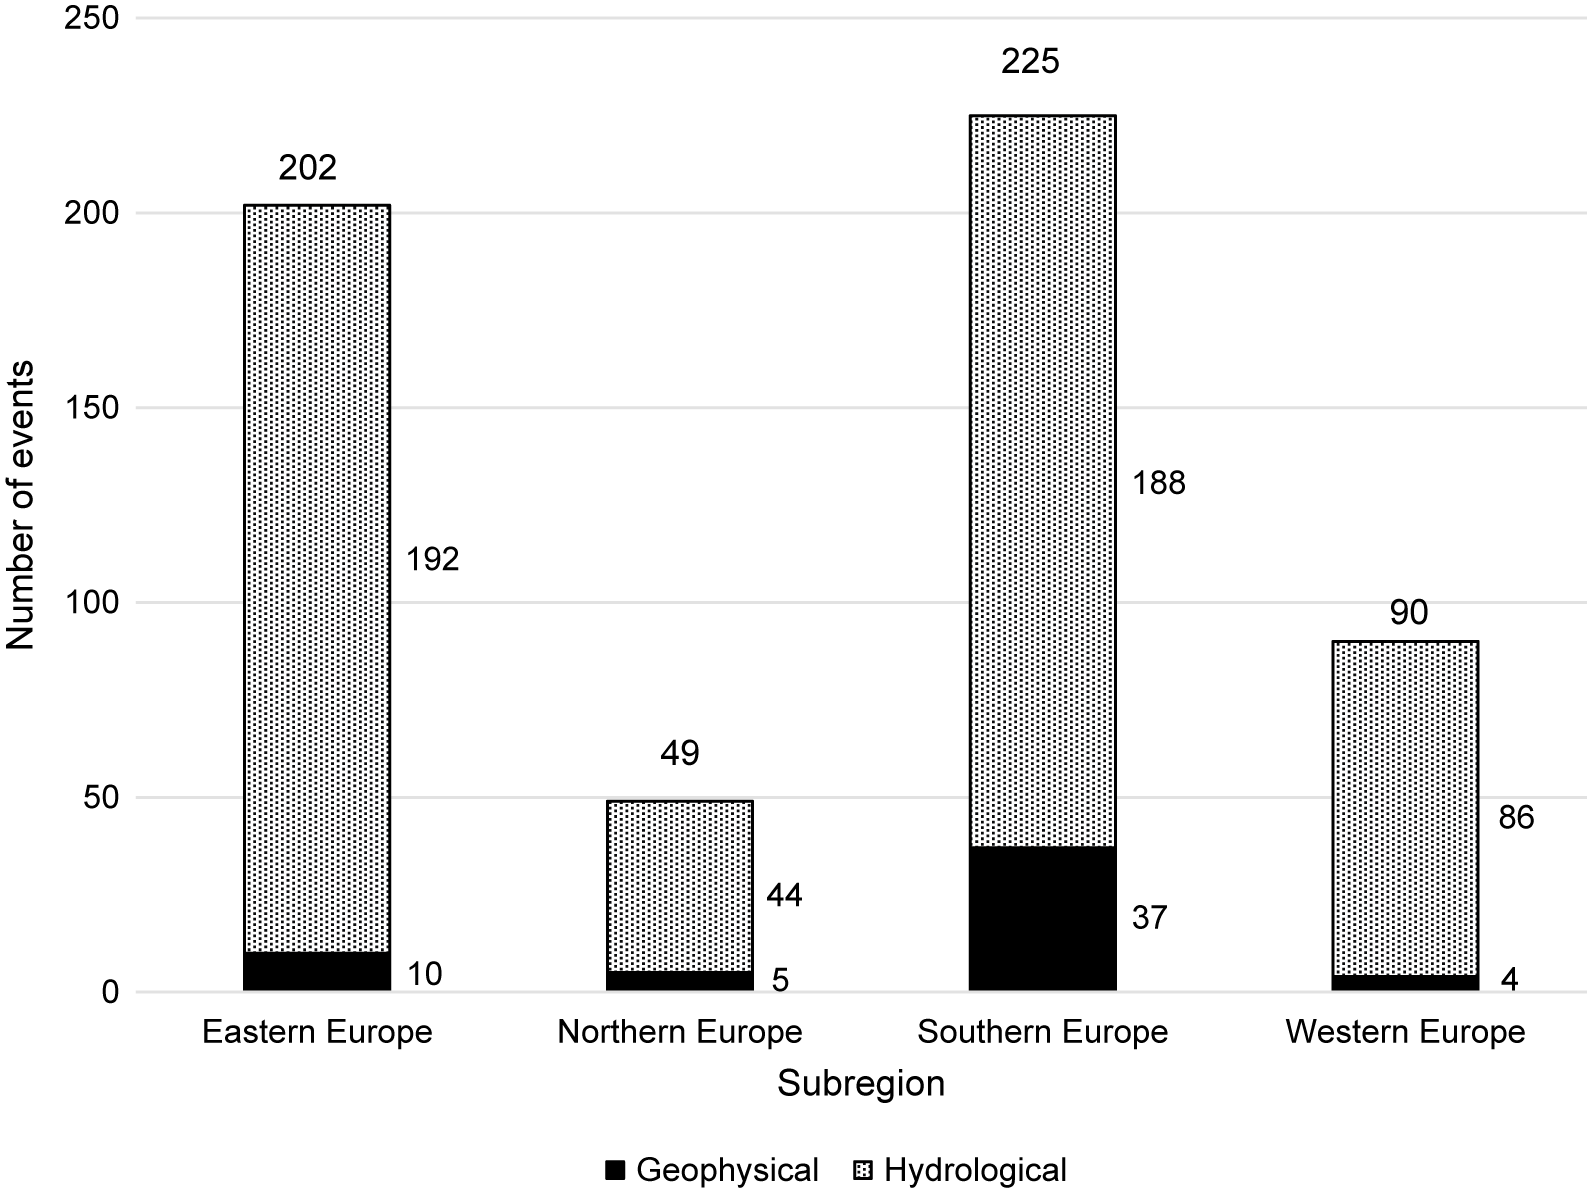
The largest proportion of events occurred in Southern Europe (225; 39.8%), followed by Eastern Europe (202; 35.7%), Western Europe (90; 15.9%), and Northern Europe (49; 8.7%).
Hydrological hazard-related disasters accounted for the majority of events across all subregions. Southern and Eastern Europe recorded the highest numbers of disasters, with hydrological events constituting the predominant hazard type (188 of 225 and 192 of 202 events, respectively), while geophysical events were less frequent. Western and Northern Europe exhibited a similar pattern, as hydrological hazard-related disasters also predominated despite lower overall event counts (Figure 2).
Distribution of Geophysical and Hydrological Hazard-related Disasters Across European Subregions, 2000 to 2025.

Figure 2. Long description
The Y-axis is labeled Number of events with increments of 50 from 0 to 250. The X-axis is labeled Subregion and contains four categories. A legend at the bottom indicates that solid black represents Geophysical hazards and dotted pattern represents Hydrological hazards. Total values are written above each bar and individual component values are written to the right of each segment.
* Eastern Europe. Total 202 events. Geophysical accounts for 10 and Hydrological accounts for 192.
* Northern Europe. Total 49 events. Geophysical accounts for 5 and Hydrological accounts for 44.
* Southern Europe. Total 225 events. Geophysical accounts for 37 and Hydrological accounts for 188.
* Western Europe. Total 90 events. Geophysical accounts for 4 and Hydrological accounts for 86.
Hydrological events significantly outnumber geophysical events in all subregions. Southern Europe has the highest total number of events and the highest number of geophysical events.
Human Impact (Fatalities and Injuries)
During the study period, the analyzed disasters resulted in 3,547 deaths and 14,470 injuries across Europe. Hydrological events accounted for most fatalities (2,751; 78%) and injuries (9,074; 63%). Geophysical events, although less frequent, caused 796 deaths (22%) and 5,396 injuries (37%) (Table 1).
Geophysical events showed a mean of 29.48 deaths per event (SD 78.27) with a median of 2 deaths, whereas hydrological events showed a lower mean mortality of 9.52 (SD 24.54) but a slightly higher median of 3 deaths, reflecting a highly skewed distribution in both groups. For injuries, geophysical events had a mean of 122.64 injuries (SD 330.27) and a median of 21.5 injuries, while hydrological events showed a higher mean of 189.04 injuries (SD 653.95), but a lower median of 8 injuries, again indicating substantial variability driven by extreme events (see Supplementary Materials—B: Table 1 sup).
Consistent with this variability, no statistically significant difference in median deaths was observed between geophysical and hydrological events (P = 0.791), whereas injuries were significantly higher in geophysical events (median 21.5 vs 8; P = 0.036) (see Supplementary Materials—B: Table 2 sup and Table 3 sup).
Floods accounted for the highest number of deaths (2,493; 70.28%), followed by earthquakes (788; 22.22%) and wet mass movements (258; 7.27%). Collectively, these events represented nearly all fatalities recorded during the study period (Table 1). A comparable distribution was observed for injuries, with floods and earthquakes accounting for the majority of non-fatal physical harm: 9,037 (62.45%) and 5,368 (37.10%) injured individuals, respectively, over the study period (Table 1).
Analysis by event type indicates that earthquakes (n = 52) resulted in an average of 30.3 deaths (SD 79.7) and a median of 2 deaths, as well as an average of 125 injuries (SD 334) and a median of 20 injuries. In contrast, floods (n = 492) were associated with a lower average number of deaths (9.2; SD 24.4; median 3) but a higher average number of injuries (215; SD 696; median 8.5). No statistically significant differences were identified between earthquakes and floods regarding median deaths (P = 0.823) or injured individuals (P = 0.093) (see Supplementary Materials—B: Table 4 sup, Table 5 sup, and Table 6 sup).
Spearman’s correlation analysis showed no significant association between calendar year and event-related physical impact on humans. For earthquakes, correlations were weak and not statistically significant for both deaths (rho = −0.163; P = 0.427) and injured individuals (rho = 0.028; P = 0.859). Similarly, for floods, correlations were negligible and not significant for deaths (rho = −0.020; P = 0.746) and injured individuals (rho = 0.013; P = 0.937) (see Supplementary Materials—B, Table 7 sup).
When examining event subtypes, riverine floods emerged as the leading cause of death, accounting for 1,094 fatalities (30.84%), followed by ground movement events with 788 deaths (22.22%) and general floods with 780 (21.99%). Flash floods, despite their high frequency, caused 606 deaths (17.08%). Wet avalanches also contributed meaningfully to total mortality with 192 deaths (5.41%), while all remaining subtypes individually accounted for less than 2% of fatalities (Table 2). The injury burden followed a partially different pattern. Ground movement events and flash floods accounted for the largest shares of injuries, with 5,364 (37.07%) and 5,241 (36.22%) cases, respectively. Riverine floods caused 2,329 injuries (16.10%), followed by general floods with 1,467 (10.14%). All remaining subtypes contributed marginally to the overall injury count, with no other subtype exceeding 35 cases (Table 2).
The distribution of event-related deaths and injuries varied substantially across European subregions (Figure 3). Southern Europe recorded the highest number of deaths (1,620), whereas Eastern Europe showed the greatest number of injured individuals (7,652). Western Europe reported a lower overall burden (567 deaths and 1,239 injuries), while Northern Europe showed minimal impact (62 deaths and 20 injuries).
Regional and Subregional Distribution of Deaths and Injuries, 2000-2025.

Figure 3. Long description
The Y-axis is labeled Number of people, ranging from 0 to 16000 in increments of 2000. The X-axis is labeled Subregion. A legend at the bottom indicates that solid black bars represent Deaths and patterned grey bars represent Injuries. Data is presented in five groups from left to right.
* Europe: 3547 deaths and 14470 injuries.
* Eastern Europe: 1298 deaths and 7652 injuries.
* Northern Europe: 62 deaths and 20 injuries.
* Southern Europe: 1620 deaths and 5559 injuries.
* Western Europe: 567 deaths and 1239 injuries.
The chart shows that the total for Europe is the sum of its subregions, with injuries being the dominant category in most areas.
At the continental level, hydrological events accounted for 2,751 deaths compared with 796 from geophysical events. When deaths and injuries are disaggregated by event type, the contrasting vulnerability profiles of each subregion become more apparent. Hydrological events were the predominant driver of mortality across most of Europe, with Eastern Europe bearing the heaviest toll (1,280 deaths), followed by Southern Europe (850 deaths), Western Europe (559 deaths), and Northern Europe (62 deaths). Southern Europe was the only subregion in which geophysical events contributed substantially to the death count, with 770 deaths, approaching the hydrological figure and suggesting a distinct regional exposure to seismic and volcanic hazards. Eastern, Western, and Northern Europe reported 18, 8, and 0 deaths from geophysical events, respectively.
Across Europe as a whole, geophysical events caused 5,396 injuries and hydrological events 9,074. Eastern Europe again led in hydrological injuries (7,411), while Southern Europe accounted for the largest share of geophysical-related injuries (5,147), reflecting the long-standing seismic activity historically concentrated in that subregion. Northern Europe and Western Europe contributed relatively little to the overall injury count: Northern Europe recorded just 2 geophysical and 18 hydrological injuries across the entire 26-year period, while Western Europe reported 6 and 1,233 injuries, respectively.
High-Impact Events
The ten deadliest events were predominantly earthquakes and floods, with a concentration in Southern and Eastern Europe (Table 3). The highest mortality was observed in the 2009 earthquake in Italy (300 deaths), followed by the 2016 earthquake in Italy (296 deaths). Among hydrological events, major floods in Spain (2024) and Germany (2021) were associated with substantial mortality (232 and 226 deaths, respectively). Several high-impact events were also recorded in the Russian Federation, primarily related to flooding and mass movements.
Top 10 geophysical and hydrological hazard-related disaster events by number of deaths in Europe, 2000-2025

Table 3. Long description
The table lists the 10 individual geophysical and hydrological disaster events recording the highest number of deaths in Europe between 2000 and 2025. For each event, the year, country, disaster type, and total number of deaths are reported, ordered by number of deaths in descending order.
-
2009, Italy, Earthquake: 300 deaths.
-
2016, Italy, Earthquake: 296 deaths.
-
2024, Spain, Flood: 232 deaths.
-
2021, Germany, Flood: 226 deaths.
-
2012, Russian Federation, Flood: 172 deaths.
-
2002, Russian Federation, Mass movement (wet): 122 deaths.
-
2002, Russian Federation, Flood: 117 deaths.
-
2002, Russian Federation, Flood: 82 deaths.
-
2019, Albania, Earthquake: 51 deaths.
-
2014, Serbia, Flood: 51 deaths.
Italy accounts for the 2 deadliest events, both earthquakes. The Russian Federation appears 4 times in the list, with 3 flood events and 1 mass movement (wet) event. . Overall, 6 of the 10 events are floods, 3 are earthquakes, and 1 is a mass movement (wet).
Source: Emergency Events Database (EM-DAT), CRED/UCLouvain, Brussels, Belgium.
The events associated with the highest number of injuries were mainly floods and earthquakes (Table 4). The largest number of injuries was reported during the 2012 flood in the Russian Federation (3,910), followed by major flood events in 2014 and 2002. Among geophysical events, the 2009 earthquake in Italy accounted for 2,000 injuries. Other high-impact events included the 2021 flood in Germany and multiple earthquakes across Southern Europe.
Top 10 geophysical and hydrological hazard-related disaster events by number of injuries in Europe, 2000-2025

Table 4. Long description
The table lists the 10 individual geophysical and hydrological disaster events recording the highest number of injured persons in Europe between 2000 and 2025. For each event, the year, country, disaster type, and number of injured are reported, ordered by number of injured in descending order.
-
2012, Russian Federation, Flood: 3,910 injured.
-
2014, Russian Federation, Flood: 2,000 injured.
-
2009, Italy, Earthquake: 2,000 injured.
-
2002, Russian Federation, Flood: 1,200 injured.
-
2021, Germany, Flood: 1,000 injured.
-
2019, Albania, Earthquake: 913 injured.
-
2016, Italy, Earthquake: 400 injured.
-
2012, Italy, Earthquake: 350 injured.
-
2011, Spain, Earthquake: 300 injured.
-
2008, Greece, Earthquake: 240 injured.
Flood events in the Russian Federation account for the 2 highest injury counts. Italy appears 3 times in the list, all due to earthquakes. Overall, 6 of the 10 events are earthquakes and 4 are floods.
Source: Emergency Events Database (EM-DAT), CRED/UCLouvain, Brussels, Belgium.
Discussion
This study provided a standardized descriptive analysis and comparison of geophysical and hydrological hazard-related disasters recorded in Europe in EM-DAT between 2000 and 2025, focusing on frequency, geographical distribution, mortality, and injury burden. Although hydrological hazard-related disasters accounted for most recorded events, the overall human burden was concentrated in a limited number of severe earthquakes and major floods. These findings reinforce that disaster frequency alone is a poor proxy for health impact, which instead reflects the interaction between hazard characteristics, population exposure, and vulnerability.
Previous EM-DAT-based research showed that hydrological events account for a large share of disaster occurrences, while geophysical events, particularly earthquakes, can cause high mortality in individual events. 21 , Reference Tin, Cheng and Le 23 , 32 This analysis also showed that deaths and injuries were concentrated in a smaller group of high-impact geophysical and major hydrological events. The absence of statistically significant differences in median mortality between geophysical and hydrological events is compatible with a pattern in which apparent differences in severity are shaped by isolated extreme events rather than by stable differences between the two hazard categories.
The absence of significant temporal trends in deaths or injuries over the study period does not indicate that the total health burden of hydrological and geophysical disasters remained unchanged. Improvements in preparedness, warning systems, emergency response, and medical management may have mitigated the human impact of some events, while shifts in exposure and vulnerability may have had the opposite effect. Additionally, EM-DAT inclusion criteria may have affected observed trends, as events below reporting thresholds are likely underrepresented. The apparent stability in recorded deaths and injuries may therefore reflect both mitigation effects and reporting limits. Changes in hazard frequency or intensity do not translate directly into recorded mortality or injury when exposure, vulnerability, and response capacity also change over time.
The regional heterogeneity of deaths and injuries observed in this study reflects vulnerability as a multidimensional condition (spanning physical, socioeconomic, and institutional dimensions) that changes over time as cities develop, populations age, environments degrade, and governance capacity shifts. 33 Similar hydrological or geophysical hazard-related disasters may therefore generate different mortality and injury profiles depending on how exposed and socioeconomically resilient the affected population is, and on how quickly local health and emergency systems can respond. 33 , Reference Del Prete, Valente and Mitiku Saji 34 Recent evidence on flood-induced disasters in high-income settings supports this view of vulnerability as an evolving and multilayered condition rather than a fixed population characteristic.Reference Del Prete, Valente and Mitiku Saji 34 Thus, although our study was not designed to identify causal mechanisms, the observed regional patterns are consistent with differences in hazard exposure across Europe. Southern Europe is characterized by greater seismic exposure within the Euro-Mediterranean belt, whereas the high injury burden observed in Eastern Europe may reflect the cumulative impact of recurrent flooding interacting with heterogeneous exposure, infrastructure, and response capacities.
Our findings reinforce the need for an all-hazards approach to disaster preparedness, as advocated by WHO and international disaster risk reduction frameworks. 35 Both frequent hydrological events and less frequent geophysical events generated substantial health-system demands in this study, so preparedness built around a single dominant hazard risks leaving systems unprepared for the other. The EU Preparedness Union Strategy follows this direction, calling for an integrated all-hazards, whole-of-society approach that anticipates risk and coordinates response across borders. 36 Beyond preparedness for individual events, our findings also support strengthening health-system resilience, understood as the capacity to absorb, adapt to, and recover from repeated disasters while maintaining essential health services, consistent with the priorities of the Sendai Framework. 22
Floods usually give some warning, since rainfall and river levels can often be forecast hours or days ahead, opening a window in which preventive action can still change the outcome. 22 , Reference Papagiannaki, Kotroni and Lagouvardos 26 , Reference Dillenardt and Thieken 37 , Reference Maidl and Buchecker 38 In contrast, earthquakes strike without warning, so the health system’s response must rely on capacity that is already in place rather than on time to prepare.Reference Mavrouli, Mavroulis and Lekkas 17 , 22 , Reference Musacchio, Saraò and Falsaperla 39 Considering the above, European preparedness strategies should therefore integrate flood risk management with seismic resilience and health-service continuity, adapted to local risk profiles.Reference Cremen, Galasso and Zuccolo 24 , 35 , Reference Dillenardt and Thieken 37 , 40 In practice, this requires shared capacities that can be activated across hazard types, including governance, early warning, contingency planning, resource mobilization, training, and structured lessons-learned processes, with hazard-sensitive prioritization. 41 Where flood forecasting provides actionable lead time, preparedness should focus on converging warning into actions, including timely evacuation planning, for at-risk populations before access routes become compromised or exposure becomes life-threatening.Reference Valente, Zanellati and Facci 20 , Reference Del Prete, Valente and Mitiku Saji 34 , 42 –Reference Wassmer, Bryant and Schimansky 44 Effective preventive evacuation requires clear triggers for when to act, accessible routes and transport for people who cannot move on their own, and proper shelter, including vertical sheltering options where evacuation is not possible.Reference Silva, Eleutério and Apel 16 , Reference Thieken, Bubeck and Heidenreich 18 , Reference Del Prete, Valente and Mitiku Saji 34 , 42 , 45 It should also include plans for residents’ return and restoration of local health services after the danger has passed. Conversely, earthquakes leave no such lead time, so priorities shift to the acute response: emergency departments and hospitals able to absorb a sudden surge of trauma cases, functioning triage and search-and-rescue coordination, and hospitals that can keep operating even when their own buildings have been damaged.Reference Yilmaz, Tatliparmak and Karakayali 46 – 49
Moreover, we acknowledge that our analysis captured only part of the health burden associated with the recorded events, as deaths and injuries primarily reflect immediate physical outcomes. Particularly, ineffective response and recovery processes can generate secondary health surges and prolonged public health consequences, especially when a damaged health system leaves medically vulnerable populations without routine care.Reference Runkle, Brock-Martin and Karmaus 50 For these reasons, mortality and injury data presented in this study should therefore be interpreted as conservative indicators of health impact.
Several methodological constraints influence the interpretation of these findings. First, the analysis utilizes EM-DAT country-level records instead of event-level reconstructions, which may result in multiple entries for a single transboundary disaster and highlight broader limitations in source reporting and database coding, such as under-reporting, inconsistent injury ascertainment, numerical approximations, and outcome misclassification. Second, because the analysis reports absolute counts rather than population-standardized or exposure-adjusted measures, the results characterize patterns of documented burden rather than comparative risk. Third, as a retrospective analysis of a secondary database, this study does not establish causal relationships between hazard type, regional vulnerability, preparedness, and health outcomes. Additionally, missing data, non-normal distributions of outcome variables, and variation in reporting practices across countries and over time further constrain statistical comparisons and diminish the consistency of observed patterns, particularly for non-fatal outcomes.
Considering the above, future research should integrate standardized disaster records with indicators of vulnerability, exposure, health-service disruption, delayed morbidity, and recovery. From our perspective, comparative European studies should evaluate how well health systems anticipate, respond to, and recover from different hazards across European regions, testing preparedness indicators that capture both acute casualties and secondary health burdens.
Conclusions
This study presents a standardized descriptive comparison of geophysical and hydrological hazard-related disasters recorded across Europe from 2000 to 2025, offering a continental-scale perspective on event frequency, geographical distribution, and human harm (fatalities and injuries) across these 2 hazard categories.
Hydrological hazard-related disasters, predominantly floods, accounted for most of the recorded events. However, the overall human burden was concentrated in a limited number of severe earthquakes and catastrophic flood episodes, demonstrating that event frequency alone is a poor proxy for disaster impact. Instead, the health consequences of disasters reflect the interaction between hazard characteristics, population exposure, and vulnerability.
Regional patterns further underscore the heterogeneity of disaster burden across Europe, highlighting the importance of preparedness and resilience strategies tailored to local hazard profiles, exposure, and vulnerability.
Supplementary material
The supplementary material for this article can be found at http://doi.org/10.1017/dmp.2026.10453.
Acknowledgments
The authors gratefully acknowledge Dr. Diego Sodini for his valuable support in data analysis, as well as Prof. Cole Garrett Westerland, Professor of English Language, for his assistance in the linguistic revision of the manuscript.
Author contribution
All authors contributed equally to this manuscript. All authors read and approved the final manuscript.
Funding statement
The authors declare that no funds, grants, or other support were received during the preparation of this manuscript.
Competing interests
The authors have no relevant financial or non-financial interests to disclose. Mention of any brand-name product or service does not imply endorsement or commercial relationships. The views, conclusions, and considerations expressed in this article are solely those of the authors and do not necessarily reflect the views of their affiliated institution.
Ethical approval
This research is based solely on previously published data and literature. No ethical approval was required.
Use of AI
While an early version of the text was reviewed by a native English speaker, substantial post-revision editing was supported by Grammarly (Grammarly Inc., https://www.grammarly.com) to enhance language clarity due to the unfunded nature of the project. The authors independently verified all changes and accept full responsibility for the final manuscript.