


Introduction
Primary care practice-based research is well positioned to address clinically relevant research questions of broadly generalizable studies that include the people, patients, and communities where most people receive their health care [1,Reference Green, Fryer, Yawn, Lanier and Dovey2]. This research is necessary as findings can inform real-world practice.
Unfortunately, many practices are not equipped to participate in research for a variety of reasons, including a lack of familiarity with research processes, lack of interest in particular research topics, and resource limitations. Even among practices that initially demonstrate interest in research participation, some withdraw after a project is initiated for similar reasons. Further, those that do engage are often unable to meet participant enrollment targets, a key reason for studies ultimately being underpowered to provide informative findings or studies being terminated outright [Reference Carlisle, Kimmelman, Ramsay and MacKinnon3–Reference Peters-Lawrence, Bell and Hsu5].
Trial conduct may be enhanced by formally assessing general capacity for engaging in research at the practice level, as well as practice-level readiness to participate in a specific research project prior to engaging in research studies. Furthermore, understanding practice-level readiness is critical as people with diverse roles within a practice may need to engage as a team to support research conduct. Such actions may optimize practice recruitment, subject enrollment and trial conduct.
Wandersman’s Interactive Systems Framework highlights the importance of considering both general capacity and readiness for a specific change (e.g., a particular type of research study) because general capacity does not ensure that an organization (e.g., physician practice) is willing and able to make a specific change [Reference Wandersman, Duffy and Flaspohler6]. In the context of participation in research, key aspects of general capacity include perceptions about the value of research in general (e.g., whether research is important for improving quality of care); the available resources (people, space, and technology) needed for participating in research; and having leadership, teamwork, and process improvement capabilities [Reference Jaen, Crabtree and Palmer7–Reference Nutting, Crabtree and Stewart10]. In summary, these dimensions of general capacity are expected to influence the readiness of a practice for a specific type of research study.
Some key aspects of general capacity, such as having supportive leadership and the ability to function as a team, align with the concept of adaptive reserve [Reference Jaen, Crabtree and Palmer7–Reference Nutting, Crabtree and Stewart10], a concept developed for the primary-care context. More specifically, adaptive reserve was measured in a national survey of primary care practices participating in patient centered medical home initiatives to assess the ability of a practice to make change.
Readiness for a specific type of research study aligns with concepts included in Weiner’s Theory of Organizational Readiness for Change [Reference Weiner11]. Organizational readiness refers to “the extent to which organizational members are psychologically and behaviorally prepared to implement organizational change” [Reference Weiner, Amick and Lee12]. The Organizational Readiness of Implementing Change (ORIC) survey, based on Weiner’s theory, assesses two dimensions of readiness, change commitment, and change efficacy [Reference Shea, Jacobs, Esserman, Bruce and Weiner13]. ORIC has been used in prior studies to characterize how ready health care organizations are to implement changes needed to implement research protocols [Reference Cykert, Keyserling and Pignone14–Reference Safford, Cummings and Halladay16], which illustrates the potential utility of the change commitment and change efficacy constructs for measuring research readiness. However, the ORIC instrument has not undergone psychometric assessment to validate its use for assessing readiness to engage in practice-based research.
Although there are a few validated research readiness instruments in the literature [Reference Revelle17–Reference Hair, Black, Babin and Anderson19] none of these were designed to understand practice-level readiness to engage in research with research teams external to the practices, or to understand a practice’s readiness for particular types of research projects. To facilitate the preparation of practices for participating in research, we set out to adapt the ORIC [Reference Shea, Jacobs, Esserman, Bruce and Weiner13] and adaptive reserve [Reference Jaen, Crabtree and Palmer7–Reference Nutting, Crabtree and Stewart10] constructs for a new assessment tool to understand both capacity for research in general and readiness for specific types of research studies. In this manuscript, we describe the development, pilot testing, and psychometric evaluation of the Practice Assessment for Research Readiness (PAR2), a novel tool designed for use in healthcare systems and community practices. The PAR2 assesses multiple dimensions of general research capacity including leadership, change management capabilities, and attitudes toward research in general, as well as dimensions of readiness for specific types of research studies, including availability of particular types of resources, level of commitment for different types of studies, and perceived ability to participate in specific types of studies. We envision that a reliable readiness assessment instrument helps align research teams and practices with shared interests, while also providing research support staff with valuable data to help build capacity for practices to engage in research. Investigators can use the PAR 2 data to address noted gaps, for instance by providing additional education, training, mentorship, and resources where feasible. Thus, PAR2 is not intended solely to determine whether a practice is ready to participate, but also to facilitate targeted capacity building with practices for becoming engaged.
Methods
Phases
We planned 4 distinct phases to our work to devise, test, and validate a primary-care-practice research readiness assessment instrument: (1) initial survey development based upon our expertise with the ORIC development and validation [Reference Weiner, Amick and Lee12], our experiences with conducting diverse types of research in practices, and via our partnership with UNC health’s research leadership (DP) whose teams document the existence and nonexistence of resources required to engage in health system level traditional clinical trials; (2) partner engagement and input, during which two experienced practice managers provided responses to our index research readiness survey, guided us to reword some survey questions to enhance comprehension and outlined an optimal method for administering the surveys; (3) initial psychometric analysis using pilot data from 10 practices which informed our sample size estimate and psychometric analysis plan for our final data collection effort; and (4) the final psychometric analyses based upon 249 responses from a total of 50 primary care practices that included family medicine, pediatrics, and internal medicine.
Survey question selection
Our initial PAR2 survey content was created using a combination of ORIC survey items, items used in the ORIC development process, and four adaptive reserve items [Reference Jaen, Crabtree and Palmer7–Reference Nutting, Crabtree and Stewart10,Reference Shea, Jacobs, Esserman, Bruce and Weiner13] (See Appendix 1 “PAR2 Survey” for numbered/lettered survey questions). The survey was divided into 2 parts. Part 1 questions inquired about how much practice members value research; availability of people, space, and equipment relevant to conducting research; and the environment for implementing changes in their practice. In Part 2, respondents were presented with three different one-page vignettes of studies previously conducted where the time and skills required of the practice members varied by vignette. Practice members then provided responses when considering their interests and ability to engage in these three different types of studies: a single focus group; a study where patients are referred out to an external research team for consent, data collection, and where the study lead physician prescribed the initial study medications as determined by the randomization schema; and a study where all tasks were performed within a practice and by practice members (Figure 1).
Brief description of 3 vignettes.

PAR2 subscale creation (Figure 2 conceptual model):
For part 1, the two subscales were generated to capture Perceived Value of Research (i.e., Value) and Capacity for Change . The Value subscale consists of six items that measure how respondents value different aspects of research participation, for instance if participation may positively impact patient outcomes, patient satisfaction, and/or care quality. The Capacity for Change subscale consists of five items that measure general approaches to practice process improvement, if practice leadership creates an environment where things can be accomplished, if people function as a team, and if workflows are challenging to change. The five items about people, space and equipment were not assessed as a subscale because they were dichotomous measures of the presence or absence of a resource (e.g., private space for research activities, IT support). Part 1 survey items in the two subscales (i.e., Perceived Value of Research and Capacity for Change) used a combination of three-, four-, or five-point Likert scales for response options.
Conceptual model for the survey development.

For Part 2 of the survey, we used and/or adapted 14 items that either are included in the ORIC scale [Reference Weiner, Amick and Lee12] or were used in prior psychometric assessments for that scale. The 14 items are divided into four subscales ( Change Commitment, Change Efficacy, Task Knowledge, Resource Availability ). Change Commitment and Change Efficacy are two subscales of the ORIC measure of readiness, whereas Task Knowledge and Resource Availability are hypothesized moderators of readiness. We presented three vignettes in Part 2, and the 14 items were repeated for each vignette example. One Change Efficacy question was omitted from vignette 1 as it was not fitting when considering a research study that did not have any follow-up time points to consider (i.e., a one-time focus group study). All items in Part 2 of our survey used a five-point Likert scale for response options.
Process/content validation
Our Initial PAR2 development began through a series of collaborative meetings that involving an expert who developed the ORIC (CS), two practice-based research network (PBRN) directors with over 20 years of practice research experience (JH, KD), and a health system research compliance director with experienced in evaluating hospital practices for research regulatory needs (DP). The PAR2 survey emerged as a product of these collaborative discussions. Additionally, two seasoned practice managers who have helped to organize communications and meetings with practice staff and providers in prior research initiatives reviewed the preliminary PAR2 research readiness survey, provided feedback to improve question clarity, and recommended an optimal method for administering the surveys.
Survey deployment strategy:
We used Qualtrics as our survey platform. To optimize response rates, practice managers were given anonymous survey links to distribute via email to people with specific roles within each practice. All response data were maintained on secure servers at the Cecil G Sheps Center for Health Services Research. The PAR2 study received an exempt determination from the UNC Chapel Hill Institutional Review Board.
Study practices and participants
Among the 50 participating practices located in 16 counties in North Carolina (see Figure 3), 18 were pediatric practices; 24 served both adults and children, and 8 served only adults. Forty practices are part of the statewide UNC Physician’s Network (private practices affiliated with UNC Healthcare) and 10 were either private or academic practices in southeastern NC. Data were collected from 249 participants including providers (MD/DO/PA/NP, n = 47), other clinical staff (n = 107), those with administrative roles (n = 79), and those with a combination of roles (n = 16). The mean number of participants per practice was 4.98.
NC counties (orange colored) with PAR 2 practices.

Analysis
For our study, data processing and analysis were primarily carried out in R program. The psych package [Reference Revelle17] was used for reliability calculations. Mplus program version 8 [Reference Muthén and Muthén18] was only used for multilevel CFA modeling.
Reliability. Cronbach’s alpha (raw score based) and composite reliability (CR; factor loading based) were calculated to assess internal consistency reliability of each subscale. Alpha/CR >0.7 indicates good reliability [Reference Hair, Black, Babin and Anderson19].
Structural/factorial validity. The intraclass correlations of the survey questions ranged between 0 and 0.28, which suggests sufficient amount of between-cluster variation that warrants a multilevel model. Thus, we employed multilevel categorical CFA modeling techniques to assess the structural validity of the subscales while accounting for the nested nature of the data (individuals nested within practices). For simplicity, the same factor structure was applied at both the within and between levels, and we focus on the within level for the purpose of the current study. To evaluate the overall model-data fit, we compared several fit indices, including comparative fit index (CFI), root mean square error of approximation (RMSEA), standardized root mean square residual (SRMR), and weighted root mean square residual (WRMR), against the commonly accepted evaluation criteria (CFI > 0.95, RMSEA < 0.06, SRMR < 0.10, and WRMR < 1.0 for a satisfactory fit) [Reference Hu and Bentler20,Reference Kline21].
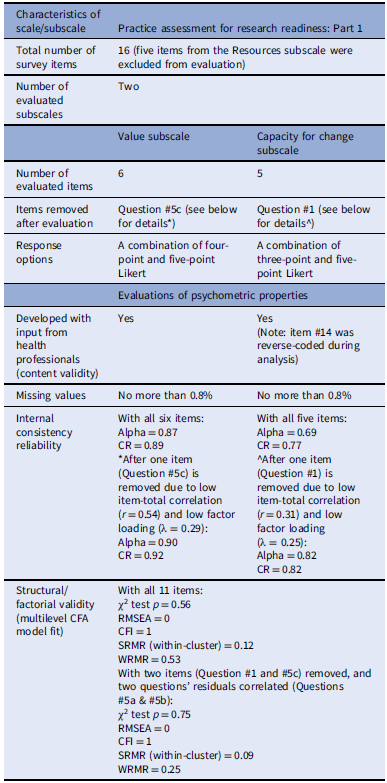
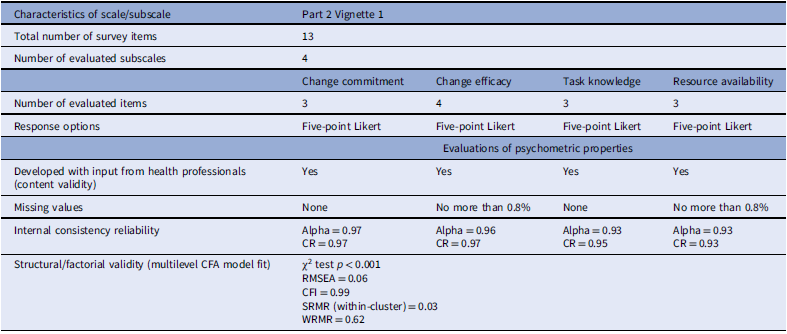
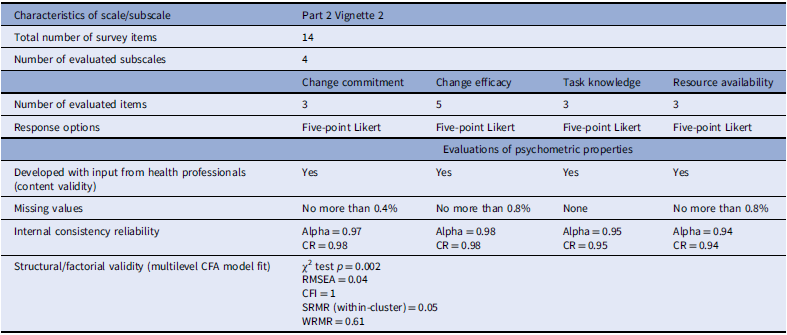
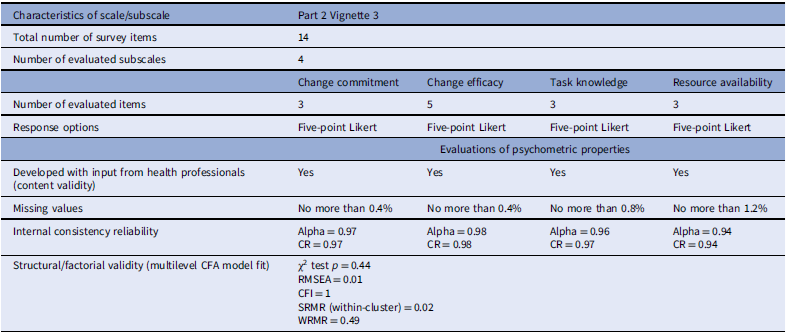
Part 1 and each vignette in Part 2 were analyzed separately (i.e., four models in total; see Table 1 through Table 4 for details) to ensure convergence of the multilevel models and stable estimation of the model parameters.
Evaluation of psychometric properties for subscales measured in part 1 of the PAR2 survey

Table 1. Long description
A table evaluating psychometric properties of subscales in a survey. The table has 11 rows and 4 columns. The columns are Characteristics of scale/subscale, Practice assessment for research readiness: Part 1, Value subscale, and Capacity for change subscale. The rows are Total number of survey items, Number of evaluated subscales, Number of evaluated items, Items removed after evaluation, Response options, Developed with input from health professionals (content validity), Missing values, Internal consistency reliability, and Structural/factorial validity (multilevel CFA model fit). Row 1: Total number of survey items, 16 (five items from the Resources subscale were excluded from evaluation), Value subscale, Capacity for change subscale. Row 2: Number of evaluated subscales, Two, Value subscale, Capacity for change subscale. Row 3: Number of evaluated items, 6, 5. Row 4: Items removed after evaluation, Question #5c (see below for details*), Question #1 (see below for details^). Row 5: Response options, A combination of four-point and five-point Likert, A combination of three-point and five-point Likert. Row 6: Developed with input from health professionals (content validity), Yes, Yes (Note: item #14 was reverse-coded during analysis). Row 7: Missing values, No more than 0.8 percent, No more than 0.8 percent. Row 8: Internal consistency reliability, With all six items: Alpha = 0.87 CR = 0.89 *After one item (Question #5c) is removed due to low item-total correlation (r = 0.54) and low factor loading (λ = 0.29): Alpha = 0.90 CR = 0.92, With all five items: Alpha = 0.69 CR = 0.77 ^After one item (Question #1) is removed due to low item-total correlation (r = 0.31) and low factor loading (λ = 0.25): Alpha = 0.82 CR = 0.82. Row 9: Structural/factorial validity (multilevel CFA model fit), With all 11 items: χ² test p = 0.56 RMSEA = 0 CFI = 1 SRMR (within-cluster) = 0.12 WRMR = 0.53 With two items (Question #1 and #5c) removed, and two questions’ residuals correlated (Questions #5a & #5b): χ² test p = 0.75 RMSEA = 0 CFI = 1 SRMR (within-cluster) = 0.09 WRMR = 0.25.
Results
Prior to evaluations of psychometric properties, we examined the data for any missing values. Other than the resources subscale in vignette 3 (which had up to 1.2% cases with missing values on the items), all items had less than 0.8% of cases with missing values. Given the small number of missing values, we did not employ any advanced missing data handling techniques (e.g., multiple imputations).
Reliability
The internal consistency reliability of each subscale is high across the board (alpha and CR > 0.7) except for the Capacity for Change subscale (CR = 0.77 but alpha = 0.69). After leaving out PAR2 Part 1 survey question #1 (“We have experience participating in research”) from the Capacity for Change subscale due to its low item-total correlation (r = 0.31), the subscale’s reliability improved and met the evaluation criteria (Alpha and CR = 0.82).
Structural/factorial validity
All three vignettes in Part 2 of the survey showed good structural validity with satisfactory model-data fit. However, for subscales in Part 1, model-data fit of the originally proposed factor structure did not fully meet the predefined criteria (RMSEA = 0, CFI = 1, within-cluster SRMR = 0.12, WRMR = 0.53). Thus, we had to make several modifications, including the removal of two items from the subscales and a freely estimated residual correlation between two items. Specifically, PAR 2 survey questions #1 (“We have experience participating in research.”) and #5c (“When your practice is considering whether to participate in a research study, how important are the following factors: Whether the study could benefit the clinic/practice financially”) had low factor loadings – question #1’s factor loading was 0.25 and question #5c’s was 0.29. A factor loading smaller than 0.32 indicates that a question shares less than 10% variance with other items within the same subscale, which is problematic. The two items removed from the Part 1 subscale will be retained in future versions of the survey only as independent, standalone questions because of their unique content coverage and practical value. They will not be included in the Part 1 subscale score or any related psychometric analyses. In addition, our results also suggest that questions #5a (“When your practice is considering whether to participate in a research study, how important are the following factors: Whether the study could contribute to improved health outcomes for our patients”) and #5b (“When your practice is considering whether to participate in a research study, how important are the following factors: Whether the study could contribute to improved patient satisfaction/experience in the clinic/practice”) have a strong residual correlation (r = 0.79) that is unexplained by the common factor for the Value subscale in Part 1. Further review of these two items revealed that the strong residual correlation might be attributed to the two items’ distinct format (they were asked as a set of related questions under the same topic along with PAR2 survey Part 1 question #5c) and response options (they use a four-point Likert scale as opposed to other items’ five-point Likert scale). After leaving out questions #1 and #5c from the subscales and allowing free estimation of the residual correlation between questions #5a and #5b, the model-data fit improved and fully met the predefined evaluation criteria (RMSEA = 0, CFI = 1, within-cluster SRMR = 0.09, WRMR = 0.25). Please see Appendix 2 for a list of survey questions listed by subscale and information about which were included in our final psychometric analyses, and which were retained due to their unique content coverage and practical use.
Although the goal of this analysis is to validate a practice level assessment of research readiness, as it may be informative to understanding gaps and prioritizing training and educational opportunities, we analyzed if there were differences in responses by subscale between group of people with different practice roles, specifically among primary care providers (MD/DO/NP/PA) vs. other clinical staff vs. the administrative staff members. Administrative and clinical staff reported higher levels of research readiness than the provider group with small to medium effect sizes (partial-eta-squared ranged between 0.01 and 0.05). Statistically significant differences were noted for the Value, Change Efficacy, Task Knowledge and Resource Availability subscales, while such differences were not noted for Change Capacity or Change Commitment subscales, suggesting that providers and the rest of the clinic employees are less divergent on how they view their capacity for making necessary changes to support research and their commitment to participate in specific types of research projects.
Discussion
We developed, pilot tested and assessed psychometric properties of the Practice Assessment for Research Readiness (PAR2) survey, a tool designed to capture the collective perceptions of practice members regarding their readiness to engage in research. Specifically, the PAR2 assesses how practices value research, their capacity for implementing necessary changes, and their preparedness to participate in specific types of research projects. The instrument demonstrated strong reliability and structural validity across most subscales, with minor refinements improving model fit. It additionally highlighted role-based differences indicating that the tool captures within practice variation.
Although there are some research readiness assessment tools available in the literature [Reference Humphries, Gupta, Dukpa and Wangmo22,Reference Smith, Wright, Morgan, Dunleavey and Moore23], a description of key components of conceptual models to guide efforts at capturing research readiness [Reference Carr, de Lusignan, Liyanage, Liaw, Terry and Rafi24] and efforts more recently that focus on the availability and quality of data from electronic health records to optimize trial participation [Reference Jennings, De Lusignan and Michalakidis25,Reference Marsolo, Marsolo and Qualls26], we found no survey instruments that focus specifically on the readiness of primary care practices and their readiness for different types of research projects. We believe the PAR2 tool is an important contribution to practice-based research as physician led practices may value and engage in research for different reasons compared to other types of health care organizations (i.e. public health practice, specialty medical practices, inpatient hospital systems). Furthermore, health services research within outpatient practices include various types of studies. Readiness to participate in one type of research project does not necessarily indicate readiness for another due to the varying levels of complexity, for example, participating in interviews or focus groups versus participating in a clinical trial,
In addition to the constructs described above, we explored the tool’s potential to identify clinics that may be interested in participating in research specific to patient populations. In the PAR2 survey version we sent to the 40 non-pilot stage practices (Appendix 1), we asked if motivation to engage in research would be enhanced if populations such as patients with intellectual and developmental conditions, people with vision or hearing impairments, people who are elderly and other categories were the target population. Although we did not view interest in a particular population as a dimension of “readiness,” we included the item because the information may be useful for research teams seeking practices to participate in projects focused on specific populations.
We believe that the PAR2 survey will be specifically useful for PBRNs, which are groups of ambulatory primary care practices that collaborate with researchers to generate evidence directly relevant to clinical care [27]. In the US, there are over 120 primary care PBRNs. As these networks continue to grow and conduct complex, multi-site studies in real-world settings, pragmatic tools such as PAR2 are needed to systemically assess and inform the types of support provided to practices participating in research.
In practice, the PAR2 research vignettes are flexible and can be modified by other PBRNs according to the research studies they conduct.
Limitations
Our study is not without limitations. For example, we had small sample sizes at a few sites (as few as two respondents), we did not conduct test–retest reliability assessment, nor did we conduct convergent or discriminant validity testing. Additionally, we removed 2 question items from the validation results due to low factor loading and impact on model data fit but retained them for their unique content. Additionally, predictive validity for example, the instruments’ ability to predict which practices are better able to meet a specific study’s milestones, such as meet site activation timelines and enrollment targets, was not evaluated. Future work should examine the predictive value of PAR2 across diverse practice contexts and study designs. Lastly, we did not conduct a content validity index (CVI) as this index requires independent ratings from a panel of subject-matter experts during the instrument development stage. Because such expert ratings were not collected as part of the present study, CVI cannot be calculated retrospectively from the available data.
Conclusion
The PAR2 extends prior readiness tools by providing a practice-level, research-specific measure tailored to community-practice partnerships. We expect that its use could prospectively align practices with studies suited to their readiness, potentially improving recruitment, reducing attrition, and guiding capacity-building interventions.
Evaluation of psychometric properties for subscales measured in part 2 Vignette 1 of the PAR2 survey

Table 2. Long description
A table evaluating psychometric properties of subscales in part 2 vignette 1 of the PAR2 survey. The table has 10 rows and 5 columns. The columns are labeled Characteristics of scale/subscale, Part 2 Vignette 1, Change commitment, Change efficacy, Task knowledge, and Resource availability. The rows are labeled Total number of survey items, Number of evaluated subscales, Number of evaluated items, Response options, Evaluations of psychometric properties, Developed with input from health professionals (content validity), Missing values, Internal consistency reliability, and Structural/factorial validity (multilevel CFA model fit). Row 1: Total number of survey items, 13. Row 2: Number of evaluated subscales, 4. Row 3: Number of evaluated items, Change commitment 3, Change efficacy 4, Task knowledge 3, Resource availability 3. Row 4: Response options, Change commitment Five-point Likert, Change efficacy Five-point Likert, Task knowledge Five-point Likert, Resource availability Five-point Likert. Row 5: Evaluations of psychometric properties. Row 6: Developed with input from health professionals (content validity), Change commitment Yes, Change efficacy Yes, Task knowledge Yes, Resource availability Yes. Row 7: Missing values, Change commitment None, Change efficacy No more than 0.8 percent, Task knowledge None, Resource availability No more than 0.8 percent. Row 8: Internal consistency reliability, Change commitment Alpha 0.97 CR 0.97, Change efficacy Alpha 0.96 CR 0.97, Task knowledge Alpha 0.93 CR 0.95, Resource availability Alpha 0.93 CR 0.93. Row 9: Structural/factorial validity (multilevel CFA model fit), 2 test p less than 0.001 RMSEA 0.06 CFI 0.99 SRMR (within-cluster) 0.03 WRMR 0.62.
Evaluation of psychometric properties for subscales measured in part 2 Vignette 2 of the PAR2 survey

Table 3. Long description
A table evaluating psychometric properties of subscales in part 2 Vignette 2 of the PAR2 survey. The table has 10 rows and 5 columns. The columns are Characteristics of scale/subscale, Part 2 Vignette 2, Change commitment, Change efficacy, Task knowledge, and Resource availability. The rows are Total number of survey items, Number of evaluated subscales, Number of evaluated items, Response options, Evaluations of psychometric properties, Developed with input from health professionals (content validity), Missing values, Internal consistency reliability, and Structural/factorial validity (multilevel CFA model fit). Row 1: Total number of survey items, 14. Row 2: Number of evaluated subscales, 4. Row 3: Number of evaluated items, Change commitment 3, Change efficacy 5, Task knowledge 3, Resource availability 3. Row 4: Response options, Change commitment Five-point Likert, Change efficacy Five-point Likert, Task knowledge Five-point Likert, Resource availability Five-point Likert. Row 5: Evaluations of psychometric properties. Row 6: Developed with input from health professionals (content validity), Change commitment Yes, Change efficacy Yes, Task knowledge Yes, Resource availability Yes. Row 7: Missing values, Change commitment No more than 0.4 percent, Change efficacy No more than 0.8 percent, Task knowledge None, Resource availability No more than 0.8 percent. Row 8: Internal consistency reliability, Change commitment Alpha 0.97 CR 0.98, Change efficacy Alpha 0.98 CR 0.98, Task knowledge Alpha 0.95 CR 0.95, Resource availability Alpha 0.94 CR 0.94. Row 9: Structural/factorial validity (multilevel CFA model fit), 2 test p 0.002 RMSEA 0.04 CFI 1 SRMR (within-cluster) 0.05 WRMR 0.61.
Evaluation of psychometric properties for subscales measured in part 2 vignette 3 of the PAR2 survey

Table 4. Long description
A table comparing psychometric properties of subscales in part 2 vignette 3 of a survey. The table has 10 rows and 5 columns. The columns are labeled Characteristics of scale/subscale, Part 2 Vignette 3, Change commitment, Change efficacy, Task knowledge, and Resource availability. The rows are labeled Total number of survey items, Number of evaluated subscales, Number of evaluated items, Response options, Evaluations of psychometric properties, Developed with input from health professionals (content validity), Missing values, Internal consistency reliability, and Structural/factorial validity (multilevel CFA model fit). The table provides detailed information on the number of survey items, evaluated subscales, evaluated items, response options, and various psychometric properties for each subscale. For example, the Change commitment subscale has 3 evaluated items with five-point Likert response options, no more than 0.4 percent missing values, and an internal consistency reliability of Alpha equals 0.97 and CR equals 0.97. The Structural/factorial validity section includes values for chi-squared test p-value, RMSEA, CFI, SRMR (within-cluster), and WRMR.
Supplementary material
The supplementary material for this article can be found at https://doi.org/10.1017/cts.2026.10811.
Acknowledgments
We would like to acknowledge our participating practice staff and providers and individuals who guided our practice recruitment, namely Dr Marzena Krawiec and Susan Beymer.
Author contributions
Jacqueline Halladay: Conceptualization, Funding acquisition, Investigation, Methodology, Project administration, Visualization, Writing - original draft, Writing - review & editing; Katrina Donahue: Conceptualization, Funding acquisition, Investigation, Methodology, Project administration, Resources, Visualization, Writing - original draft, Writing - review & editing; Michelle L. Hernandez: Conceptualization, Investigation, Methodology, Visualization, Writing - original draft, Writing - review & editing; Mian Wang: Formal analysis, Investigation, Methodology, Validation, Writing - original draft, Writing - review & editing; Jennifer Rees: Writing - original draft, Writing - review & editing; Kathleen Mottus: Data curation, Methodology, Project administration, Visualization, Writing - review & editing; Diane Powers: Conceptualization, Writing - original draft, Writing - review & editing; J. Tommy White: Conceptualization, Investigation, Methodology, Writing - original draft, Writing - review & editing; Christopher Shea: Conceptualization, Investigation, Methodology, Validation, Visualization, Writing - original draft, Writing - review & editing.
Funding statement
This work was supported by
-
1. The National Center for Advancing Translational Sciences of the NIH (grant numbers UL1TR002489 and UM1TR004406). The content is solely the responsibility of the authors and does not necessarily represent the official views of the NIH.
-
2. UNC Chapel Hill Department of Family Medicine
-
3. The project described was supported by the Research Advisory Council of Novant Health, Novant Health New Hanover Regional Medical Center, University of North Carolina Health Care System, and University of North Carolina at Chapel Hill School of Medicine through the Capacity Building Grant. The content is solely the responsibility of the authors and does not necessarily represent the official views of the granting organizations.
Competing interests
The authors declare none.




 Open access

