I INTRODUCTION
Efficient design of electromagnetic (EM) systems using accurate scalable macromodels is an active field of research [Reference Ferranti, Knockaert and Dhaene1–Reference Ferranti, Knockaert and Dhaene6]. These scalable macromodels are computationally cheap and they act as a replacement model for the expensive EM solvers thereby reducing the overall computational burden. The scalable macromodeling schemes are also able to preserve system properties such as stability and passivity and hence can be used in time-domain simulations [Reference Ferranti, Knockaert and Dhaene1–Reference Ferranti, Knockaert and Dhaene6]. However, these state-of-the-art macromodeling schemes suffer from the fact that the sample distribution over the design variable space should be known a priori based on rules of thumb [Reference Ferranti, Knockaert and Dhaene1–Reference Ferranti, Knockaert and Dhaene6].
Several sequential sampling algorithms have been suggested in the literature for automatically building scalable macromodels for the EM systems [Reference Peik, Mansour and Chow7–Reference Basl, Gohary, Bakr and Mansour12]. All of these sampling schemes are global but often fail to guarantee stability and passivity. Preserving system properties is very important especially if the model thus generated is employed in time-domain simulations [Reference Rohrer and Nosrati13]. Also, for relatively high dimensions the memory requirement for these methods can be relatively high since big matrices has to be solved, limiting their applicability [Reference Peik, Mansour and Chow7–Reference Cuyt, Lenin, Becuwe and Verdonk9, Reference Basl, Gohary, Bakr and Mansour12]. Recently a local tree-based sequential sampling has been proposed in [Reference Chemmangat, Ferranti, Dhaene and Knockaert14] which uses interpolation-based local scalable macromodeling method to build accurate parameterized macromodels. The method is able to preserve system properties and can also build multi-fidelity models. This means that the designer can already begin the design process once sufficient accuracy is reached for the intermediate model while the model is still being refined. Also, the method is implemented as a tree with independent branches for different regions of the design space making it easily expandable and portable to parallel computing platforms.
In this paper, we improve the method of [Reference Chemmangat, Ferranti, Dhaene and Knockaert14], which we refer throughout this paper as grid method, on the following aspects:
-
(1) The grid method deals with hyperrectangular regions of the design space which are called subspaces in this paper. In the previous method, after performing an edge-based division the algorithm finally divides along the center of the subspace. This is an exploratory step which tends to generate a considerable number of samples per division. This becomes more critical with higher dimension. In this work, the final refinement after the edge-based division is performed using a scattered division with well-conditioned simplicial partitions called path-simplexes [Reference Brandts, Korotov and Krizek15, Reference Brandts, Korotov, Krizek and Solc16] reducing the overall complexity of the problem.
-
(2) The grid method requires validation samples to access the accuracy of the terminal subspaces which need not be used further in the final model. In this paper, the validation samples are altogether eliminated using a level-based check wherein two subsequent levels of models are compared for convergence. This results in a considerable reduction in the overall number of points required.
The refinement on the simplexes can be done in many ways such as dividing along in-center. However, this might lead to the creation of ill-conditioned simplexes called slivers. Generation of slivers can be avoided by refining either locally [Reference Brandts, Korotov and Krizek15, Reference Brandts, Korotov, Krizek and Solc16] or globally [Reference Li17, Reference Constantiniu, Steinmann, Bobach, Farin and Umlauf18]. The local refinement scheme [Reference Brandts, Korotov and Krizek15, Reference Brandts, Korotov, Krizek and Solc16] starts from the corner points of an N-cube and then refines it into smaller simplexes in a tree-based way like the sequential sampling method of [Reference Chemmangat, Ferranti, Dhaene and Knockaert14], whereas the global refinement schemes [Reference Li17, Reference Constantiniu, Steinmann, Bobach, Farin and Umlauf18] work on a primary Delaunay tessellation and then refine it to improve the condition of simplexes. Hence the local path-simplex method [Reference Brandts, Korotov and Krizek15, Reference Brandts, Korotov, Krizek and Solc16] assures a good condition number from the beginning of the sampling process and is suitable for the application of different passivity-preserving scalable macromodeling algorithms on scattered grids [Reference Ferranti, Knockaert and Dhaene2, Reference Ferranti, Knockaert and Dhaene5]. On the other hand, if the global refinement schemes [Reference Li17, Reference Constantiniu, Steinmann, Bobach, Farin and Umlauf18] were used, the existing mesh has to undergo global refinement indicating that the local interpolated models may change significantly with a consequent computational burden. So, a path-simplex-based refinement is employed in this paper.
However, since the path-simplex method gives more importance to conditioning of the simplexes, it is more a space-filling strategy. So, in this work a hybrid scheme which combines all the benefits of the grid-based refinement and the path-simplex refinement is used to get an efficient sequential sampling strategy requiring less computational resources.
This paper is organized as follows: Section II briefly describes a scalable macromodeling method which is employed in this paper and the grid method of [Reference Chemmangat, Ferranti, Dhaene and Knockaert14]. Section III defines a path-simplex and its well-conditioned refinement with its relative merits and demerits with respect to the grid-based scheme of [Reference Chemmangat, Ferranti, Dhaene and Knockaert14] and states why a hybrid strategy which combines an edge-based and a scattered refinement is required. Section IV demonstrates how the error can be estimated without having to use expensive validation points. The complete flowchart of the proposed sequential sampling is given with description in Section V followed by three numerical examples in Section VI. Section VII concludes the paper.
II PRELIMINARIES
This section briefly explains a robust scalable macromodeling method used in the paper and also recapitulate the grid-based sequential sampling method of [Reference Chemmangat, Ferranti, Dhaene and Knockaert14].
A) Passivity preserving scalable macromodeling
In this work, we use one of the local scalable macromodeling schemes which use the vector fitting (VF) technique [Reference Gustavsen and Semlyen19] to build frequency-dependent rational models called root macromodels at the selected design space samples and then parameterize them, see [Reference Ferranti, Knockaert and Dhaene1–Reference Ferranti, Knockaert and Dhaene6]. These methods preserve stability and passivity over the complete design space, and therefore are suitable for time-domain simulations. The scalable macromodeling process starts with a set of multivariate data samples
 $\left\{{\lpar s\comma \; \vec g\rpar _k \comma \; {\bf H}\lpar s\comma \; \vec g\rpar _k } \right\}_{k = 1}^{K_{tot} }$
, which depends on frequency and additional design variables. From these data samples, a set of root macromodels in pole-residue form are built for a set of design space samples
 $\vec g_k$
by means of VF yielding a set of root macromodels
 ${\bf R}\lpar s\comma \; \vec g_k \rpar $
. Stability and passivity are enforced using robust standard techniques [Reference Gustavsen and Semlyen19, Reference Gustavsen20], resulting in a set of stable and passive root macromodels. The next step of these scalable macromodeling algorithms is the parameterization of the set of root macromodels
 ${\bf R}\lpar s\comma \; \vec g_k \rpar $
.
In [Reference Ferranti, Knockaert and Dhaene1, Reference Ferranti, Knockaert and Dhaene2, Reference Ferranti, Knockaert and Dhaene5], a scalable macromodel is built by interpolating a set of root macromodels at an input–output level, whereas in [Reference Triverio, Nakhla and Grivet-Talocia3, Reference Ferranti, Knockaert, Dhaene and Antonini4], both poles and residues are parameterized by interpolating the internal state-space matrices, resulting in higher modeling capability with respect to [Reference Ferranti, Knockaert and Dhaene1, Reference Ferranti, Knockaert and Dhaene2, Reference Ferranti, Knockaert and Dhaene5]. In [Reference Ferranti, Knockaert and Dhaene6], a novel enhanced interpolation of root macromodels at an input–output level is described, which is based on the use of some coefficients: one coefficient as a multiplicative factor at the input/output level of the system and the other coefficient as a compression or expansion term for the Laplace variable s. It results in high modeling capability and robustness and it is used in our sequential sampling.
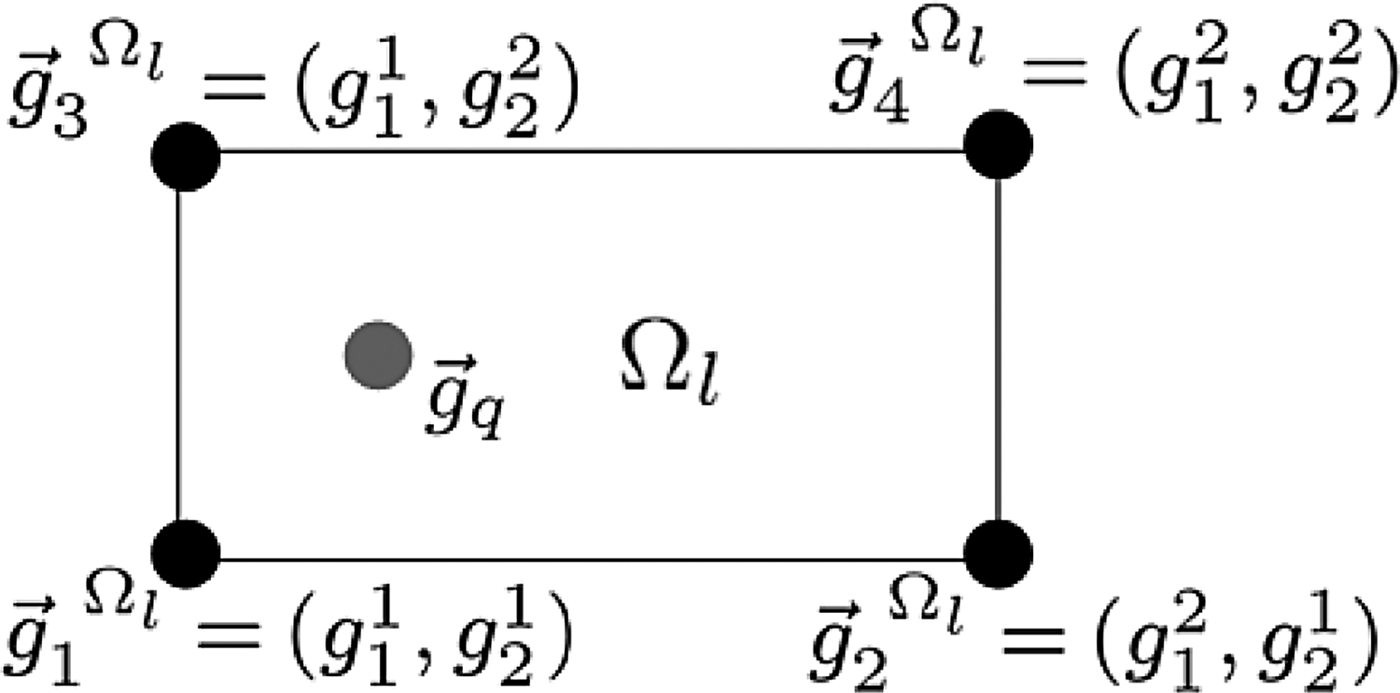
To understand the macromodeling method of [Reference Ferranti, Knockaert and Dhaene6], let us consider a two variable design space region Ω
l
, l = 1, … , L given in Fig. 1. A two variable description is presented here for clarity and ease of notation, even though the method is general for any dimension N of the design space. The rational root macromodels
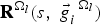 ${\bf R}^{\Omega _l } \lpar s\comma \; \vec g_i^{\; \; \Omega _l } \rpar $
, i = 1, … , 2
N
contained in the N-box region Ω
l
are represented in a pole-residue form:
 $${\bf R}^{\Omega _l } \lpar s\comma \; \vec g_i^{\; \; \Omega _l } \rpar = \sum\limits_{p = 1}^{P_i^{\Omega _l } } \displaystyle{{C_{p\comma i}^{\Omega _l } } \over {s - a_{p\comma i}^{\Omega _l } }} + D_i^{\Omega _l } \; \; \semicolon \; p = 1\comma \; \ldots \comma \; P_i^{\Omega _l }\comma \;$$
where C p, i Ω l represents the residue matrices, a p, i Ω l the pole P i Ω l . D i Ω l is the direct-term matrix.
A two dimensional design space with four root macromodels.

Later, the parametric macromodeling is applied on these N-box regions Ω
l
. The design space region Ω
l
is defined by four bounding corners
 $\vec g_1^{\; \; \Omega _l } = \lpar g_1^1 \comma \; g_2^1 \rpar $
,
 $\vec g_2^{\; \; \Omega _l } = \lpar g_1^2 \comma \; g_2^1 \rpar $
,
 $\vec g_3^{\; \; \Omega _l } = \lpar g_1^1 \comma \; g_2^2 \rpar $
, and
 $\vec g_4^{\; \; \Omega _l } = \lpar g_1^2 \comma \; g_2^2 \rpar $
as in Fig. 1. Each corner possesses a different root macromodel
 ${\bf R}^{\Omega _l } \lpar s\comma \; \vec g_i \rpar $
, i = 1, … , 4. We will discuss the interpolation of the root macromodels next. For simplicity and ease of notation, we omit the superscript Ω
l
. In [Reference Ferranti, Knockaert and Dhaene6], one amplitude scaling and one frequency scaling coefficient (α1, α2) are calculated using the optimization.
 $$\eqalign{\lpar \alpha _{1\comma ij}^\ast \comma \; \alpha _{2\comma ij}^\ast \rpar &= \mathop {{\rm argmin}}\limits_{_{\lpar \alpha _{1\comma ij} \comma \alpha _{2\comma ij} \rpar } } \left[{{\rm Err}\lpar {\bf \tilde R}^j \lpar s\comma \; \vec g_i \rpar \comma \; {\bf R}\lpar s\comma \; \vec g_j \rpar \rpar } \right].\; \cr i &= 1\comma \; \ldots \comma \; 4\semicolon \; \; j = 1\comma \; \ldots \comma \; 4.}$$
In (2),
 ${\bf \tilde R}^j \lpar s\comma \; \vec g_i \rpar = \alpha _{1\comma ij} {\bf R}\lpar s\alpha _{2\comma ij} \comma \; \vec g_i \rpar $
, is the interpolated response of
 ${\bf R}\lpar s\comma \; \vec g_i \rpar $
obtained to match
 ${\bf R}\lpar s\comma \; \vec g_j \rpar $
and Err(·) is a suitable error measure between the two responses [Reference Ferranti, Knockaert and Dhaene6]. Note that, α1,ij
* = α2,ij
* = 1 when i = j.
The evaluation of the model taken at a generic point
 $\vec g_q $
in the design space (Figure 1) is done similarly to [Reference Ferranti, Knockaert and Dhaene6] as:
-
(1) For each root macromodel
 ${\bf R}\lpar s\comma \; \vec g_i \rpar$
, i = 1, … , 4, the amplitude scaling coefficient α1,ij
and frequency scaling coefficient α2,ij
are interpolated using a multilinear interpolation [Reference Weiser and Zarantonello21] over
$\vec g$
at the point
$\vec g_q $
to find α1,iq
and α2,iq
. This results in the modified root macromodels,
${\bf \tilde R}_q \lpar s\comma \; \vec g_i \rpar = \alpha _{1\comma iq} \sum\nolimits_{p = 1}^{P_i } \displaystyle{{C_{p\comma i} } \over {s\alpha _{2\comma iq} - a_{p\comma i} }} + D_i $
at
$\vec g_q $
,
-
(2) Then the models
${\bf \tilde R}_q \lpar s\comma \; \vec g_i \rpar $
are interpolated using the multilinear interpolation [Reference Weiser and Zarantonello21] over
$\vec g$
to get the final model interpolated at the points
$\vec g_q $
,
${\bf R}\lpar s\comma \; \vec g_q \rpar $
.


This parametric macromodeling approach is performed for each region Ω l , which can either be a N-dimensional hyperrectangle or a N-simplex to cover the complete design space.
B) Sequential sampling using grid-based refinement
The grid-based refinement scheme of [Reference Chemmangat, Ferranti, Dhaene and Knockaert14] works on hyperrectangular grids and generates local scalable macromodel for each and every subspace. The grid-based sequential sampling algorithm begins from a single subspace with 2 N corners defined by the design parameter ranges [Reference Chemmangat, Ferranti, Dhaene and Knockaert14]. Then it finds the maximum sensitive edge by checking difference between two responses of every edge and selects the edge with maximum difference. Later, a (N − 1)-Hyperplane perpendicular to the selected edge is used to divide the subspace into two child subspaces if the accuracy is not satisfactory. This procedure is repeated until all the subspaces are accurate and then finally a center refinement is used to complete the process as clearly explained in [Reference Chemmangat, Ferranti, Dhaene and Knockaert14].
The idea of selecting the maximum sensitive edge is slightly modified in this work to make use of the available information generated by [Reference Ferranti, Knockaert and Dhaene6]. The idea here is to find the most difficult-to-model edge in terms of the macromodeling method of [Reference Ferranti, Knockaert and Dhaene6] as explained in detail below.
As in Section II. A, let us consider a two variable design space
 $\vec g \in \lpar g_1 \comma \; g_2 \rpar $
defined by four corners
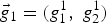 $\vec g_1 = \lpar g_1^1 \comma \; g_2^1 \rpar $
,
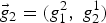 $\vec g_2 = \lpar g_1^2 \comma \; g_2^1 \rpar $
,
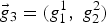 $\vec g_3 = \lpar g_1^1 \comma \; g_2^2 \rpar $
, and
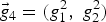 $\vec g_4 = \lpar g_1^2 \comma \; g_2^2 \rpar $
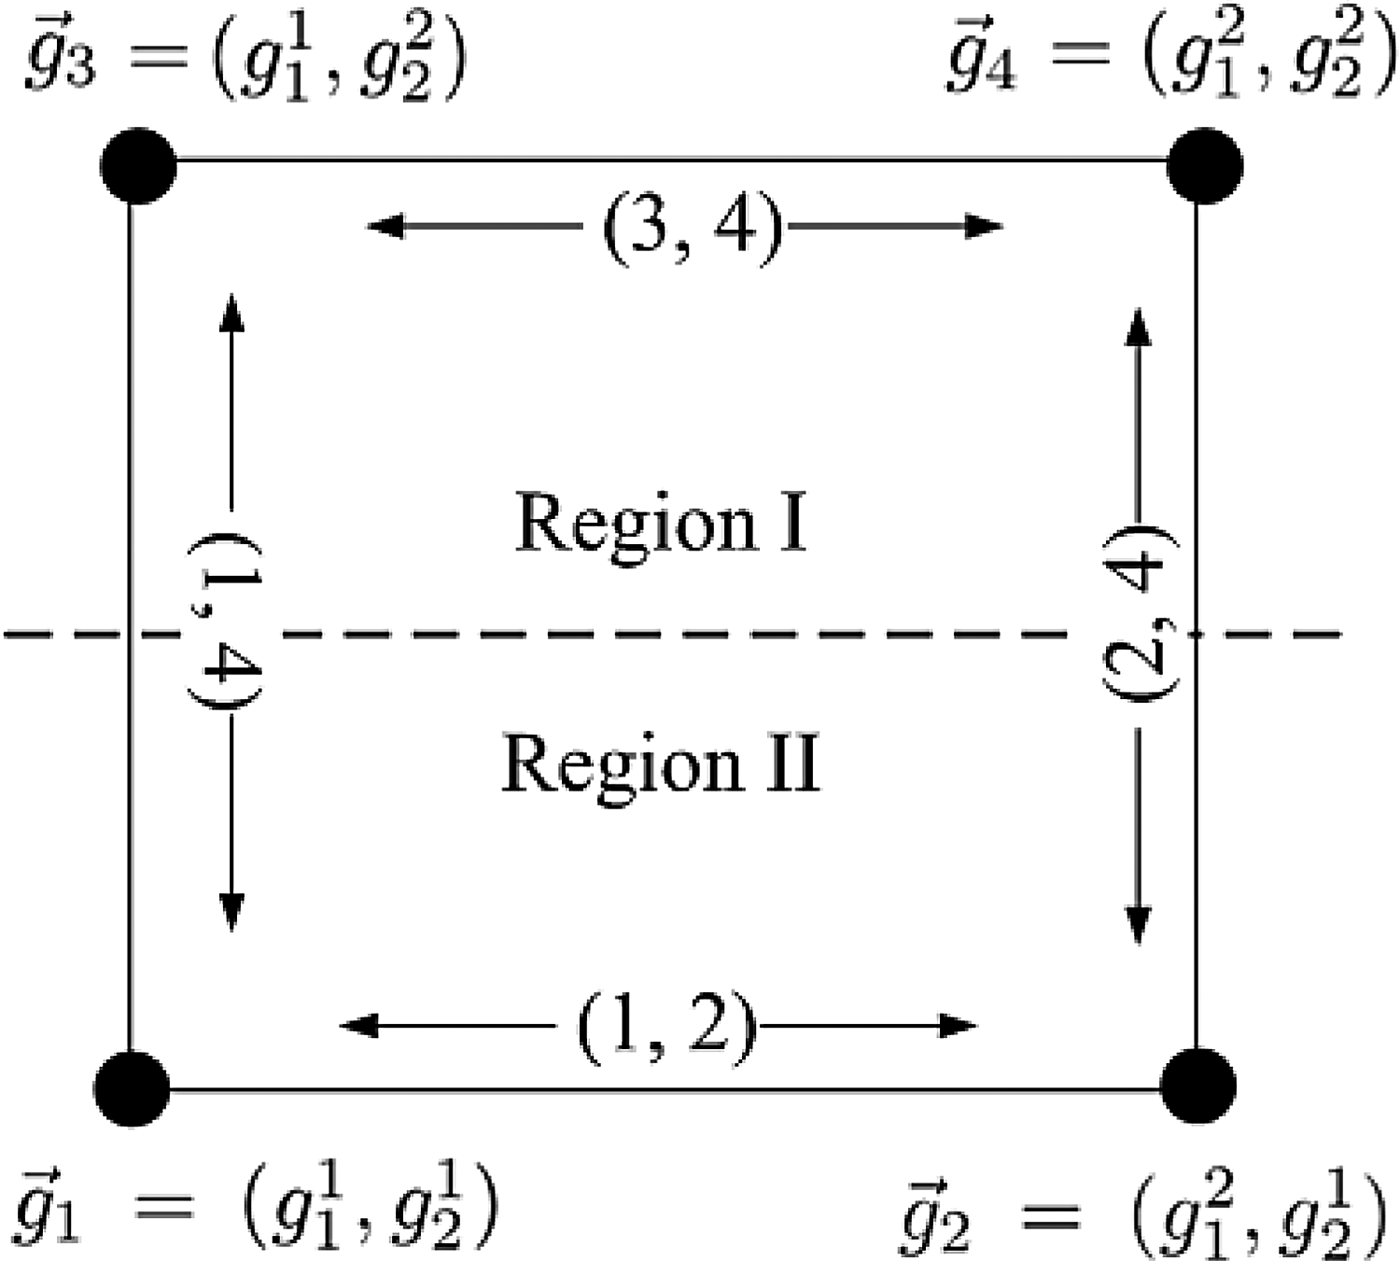
of a rectangular region (two dimensional subspace) as in Figure 2. In the scalable macromodeling method of [Reference Ferranti, Knockaert and Dhaene6], one scaling and another frequency shifting coefficients (α1,ij
*, α2,ij
*) are calculated as in (2). The error information obtained from (2) can be used as a measure of the modeling difficulty of each and every edge 1 ≤ (i, j)edge ≤4 (see Fig. 2), and the most difficult-to-model edge is the edge with the worst-case error given by the formula,
 $$\lpar i\comma \; j\rpar _{{\rm edge}}^{{\rm max}} = \mathop {{\rm argmax}}\limits_{_{\lpar i\comma j\rpar \, _{{\rm edge}} } } \;\left({\mathop {min}\limits_{\lpar \alpha _{1\comma ij} \comma \alpha _{2\comma ij} \rpar } \;\left[{{\rm Err}\lpar {\bf \tilde R}\lpar s\comma \; \vec g_i \rpar \comma \; {\bf R}\lpar s\comma \; \vec g_j \rpar \rpar } \right]} \right).$$
Subspace division along the most difficult-to-model edge.

Then, a hyperplane perpendicular to the edge (i, j)edge max is used to divide the subspace into two halves. In Fig. 2, the pair (2, 4) was selected as the most difficult-to-model edge and a line perpendicular to that edge is used to divide the subspace into two. However, the grid-based scheme suffers from the following:
-
(1) The final refinement after the edge-based refinement of each subspace is performed at the center [Reference Chemmangat, Ferranti, Dhaene and Knockaert14], and to keep the hyperrectangular nature of the grid all the lower dimensional hyperplanes such as edges, faces etc., of the subspace are divided generating a lot of points.
-
(2) The local scalable macromodel is build by linearly interpolating 2 N root macromodels for every subspace [Reference Chemmangat, Ferranti, Dhaene and Knockaert14]. Since the root macromodel transfer functions are appended as in [Reference Ferranti, Knockaert and Dhaene6], the order of the final scalable macromodel inside a subspace can have high values (in proportion to 2 N ). This increases the evaluation time for the macromodel especially for time-domain simulations.
Both of the above mentioned issues become even more troublesome with higher dimensions. Therefore, a scattered refinement using well-conditioned simplexes becomes necessary to overcome these issues and such a scheme is presented in detail in Section III.
III PATH-SIMPLEXES
A path-simplex in ℝ N , N ∈ (1, 2, …), is defined as an N-simplex having N mutually orthogonal edges which, in the sense of graph theory, form a path [Reference Brandts, Korotov, Krizek and Solc16]. Path-simplex has the following properties, which makes it useful for the proposed sequential sampling [Reference Brandts, Korotov, Krizek and Solc16]:
-
(1) a path-simplex in ℝ N is a non-obtuse simplex and all its (N − i) simplexes, i = 1, 2, …(N − 1) are also path-simplexes,
-
(2) it contains its circumcenter ensuring good condition,
-
(3) path-simplex refinement is assured to be Delaunay by construction,
-
(4) every alternate division performed on path-simplex generates geometrically similar simplexes.
The above mentioned points ensures that slivers are never created during the local refinement of a simplex, ensuring convergence of the algorithm. Also, the path-simplex based division has already been applied to the sequential sampling process and a preliminary work can be found in [Reference Chemmangat, Dhaene and Knockaert22]. A more elaborate description is given in this paper. The proposed sequential sampling algorithm starts from an edge-based refinement scheme described above and then uses the result of [Reference Brandts, Korotov, Krizek and Solc16] to refine a N-box region of the design space into N! path-simplexes. Then these path-simplexes are further divided as in the Coxeter's trisection method [Reference Brandts, Korotov and Krizek15], which is described below.
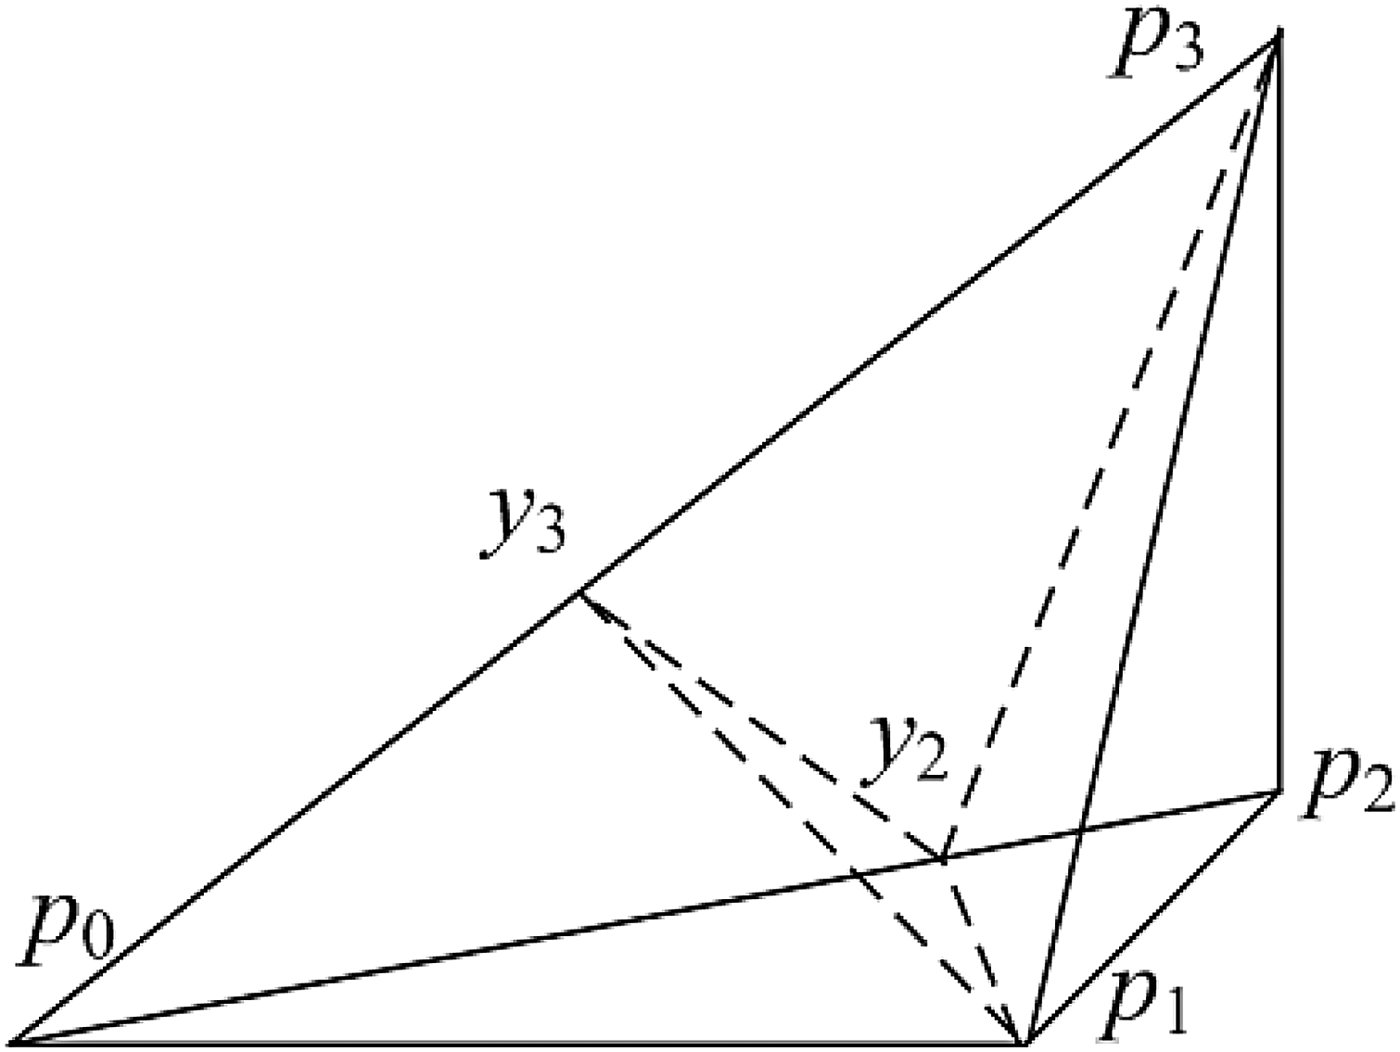
In [Reference Brandts, Korotov and Krizek15], Brandts et al. prove that given a path-simplex in ℝ N , it can be divided into N path-subsimplexes using Coxeter's trisection method generating N − 1 new sample points. Figure 3 shows such a division for a path-simplex in ℝReference Triverio, Nakhla and Grivet-Talocia 3 . The corners of the path-simplex are represented by the position vectors p 0, p 1, p 2, and p 3 with respect to any arbitrary origin, and the edges p 0 − p 1, p 1 − p 2, and p 2 − p 3 forming a path. Three new path-simplexes are formed using the points y 2 and y 3 calculated as
 $$y_j = p_j \times \displaystyle{{\left \Vert {p_1 } \right \Vert ^2 } \over {\left \Vert {p_j } \right \Vert ^2 }}\comma \; \; j = 2\comma \; 3\comma \; ...N\comma$$
where, ‖·‖ is the Euclidean norm [Reference Brandts, Korotov and Krizek15]. Generation of slivers during the local refinement can be monitored by calculating the aspect ratio,
 $$R_{{\rm asp}} = N\displaystyle{d \over D}.$$
in (5), d and D are the diameters of the inscribing and circumscribing N-spheres of the N-simplex, respectively. Root macromodels are created at the corner points of these simplexes and using the scalable macromodeling method of [Reference Ferranti, Knockaert and Dhaene6], passive interpolated models are created for the parameterized frequency responses.
Coexter's trisection of the path-simplex in ℝ3 (as in [Reference Brandts, Korotov and Krizek15]).

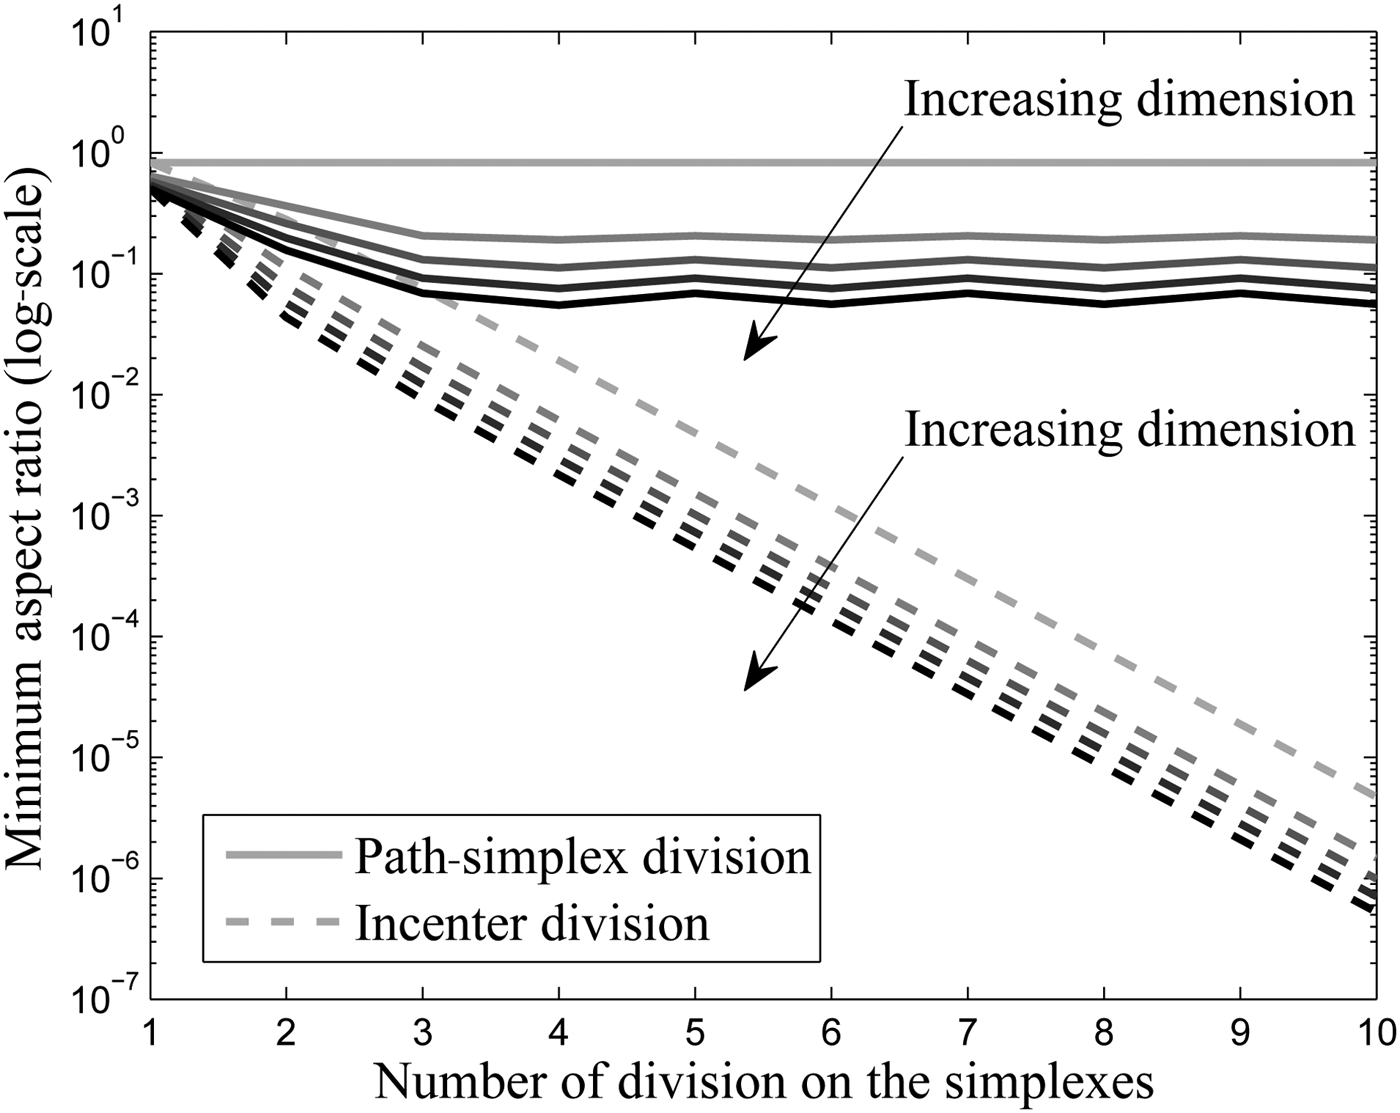
To see the advantage of using a path-simplex division, it is compared with respect to a division at the incenter of the simplex and the minimum aspect ratio (5) for each level of division is plotted in Figure 4. The comparison is made with respect to the number of times the simplex is divided as well as the number of dimension N of the simplex. Both the division techniques start from a path-simplex of unit orthonormal edges. As seen in Figure 4, the path-simplex division preserves the aspect ratio of the simplexes thereby assuring a good condition number. This is much better as compared to the incenter division. As stated in [Reference Brandts, Korotov and Krizek15], a path-simplex if divided twice, one of the sub-sub-simplexes is similar to the original simplex keeping its aspect ratio. This can also be seen in Figure 4, where the aspect ratio shows oscillatory behavior showing each alternate division levels are similar.
Comparison of Coxeter's trisection method versus incenter-based division.

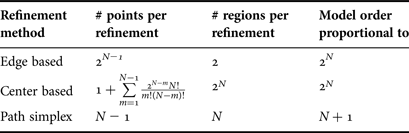
Next, to show why a scattered sampling is required, some important parameters for the edge-based and center-based subspace division of [Reference Chemmangat, Ferranti, Dhaene and Knockaert14] is compared with the path-simplex division and is tabulated in Table 1. Using a simplex-based division, the number of expensive samples generated per refinement can be brought down to (N − 1). Note that the number of points created per center-based division is calculated by summing all the possible hyperplanes such as edges, faces, etc., which are divided. Also, the order of the final macromodel can be reduced from that proportional to a factor of 2 N for the grid-based scheme to a factor of (N + 1) for the scattered scheme. This creates considerable speed-ups in macromodel evaluations both in frequency and time-domain. However, one of the issues with the path-simplex-based division is that the method acts as a space-filling strategy by generating well-conditional simplexes with less emphasis on sequential sampling. Therefore a hybrid method is proposed in this paper which brings the advantages of both schemes to get a better sequential sampling strategy as will be explained in Section V.
Comparison of different refinement strategies.

IV ERROR ESTIMATION WITHOUT VALIDATION POINTS
In [Reference Chemmangat, Ferranti, Dhaene and Knockaert14], the accuracy of the model is calculated by comparing the scalable macromodel with the actual EM simulations at each and every terminal subspaces. When a subspace is found to be accurate, it is not further divided and the expensive validation points from the EM solver may not used [Reference Chemmangat, Ferranti, Dhaene and Knockaert14]. This can be tackled to a certain extend by performing an estimation of the accuracy or the error at each and every subspace as described here.
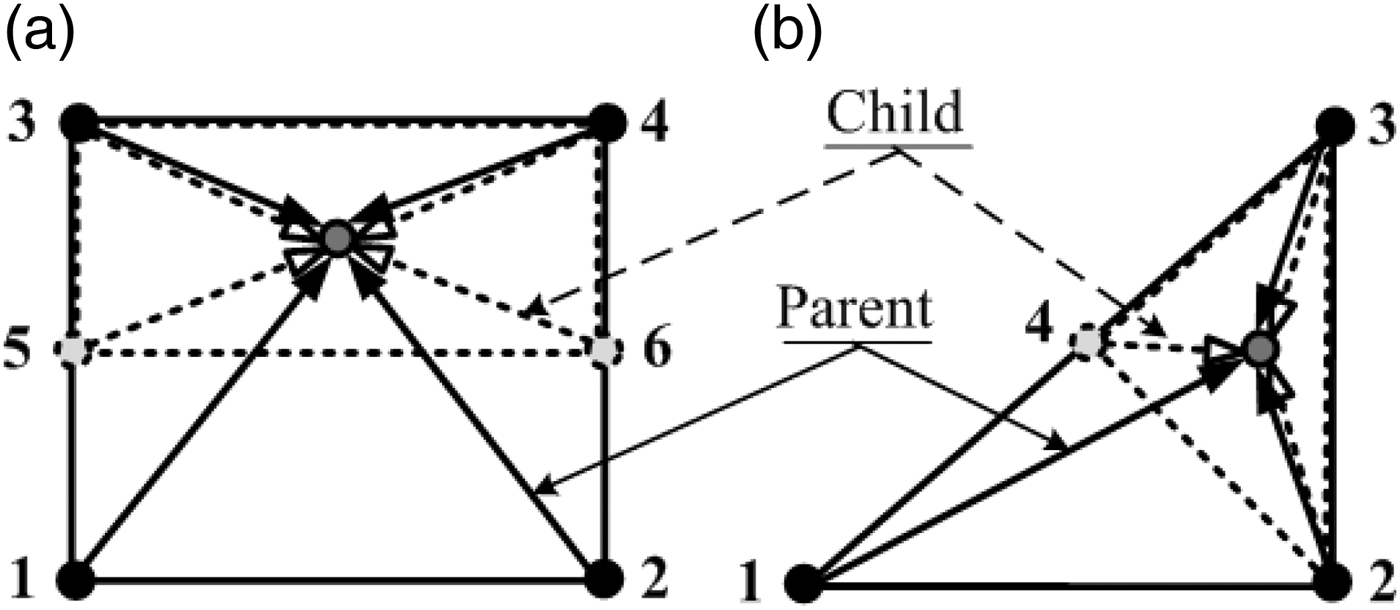
In this paper, a comparison between two subsequent levels of scalable macromodels is proposed to assess the convergence of the sequential sampling as shown in Figure 5(a) for a 2D case on a rectangular grid. Two different scalable macromodels are compared, one from the parent subspace (region 1-2-3-4, solid line arrows) and the other from the child subspace (region 5-6-3-4, dashed line arrows) at the center of the child subspace region. On the other hand, if the simplexes are divided, a similar strategy is used, wherein the two macromodels are compared at the incenter of the child simplex as shown in Figure 5(b) When a convergence is observed between the two levels, the algorithm is terminated.
Error estimation with two subsequent model levels: (a) Rectangular region and (b) Simplicial region.

V PROPOSED SEQUENTIAL SAMPLING ALGORITHM
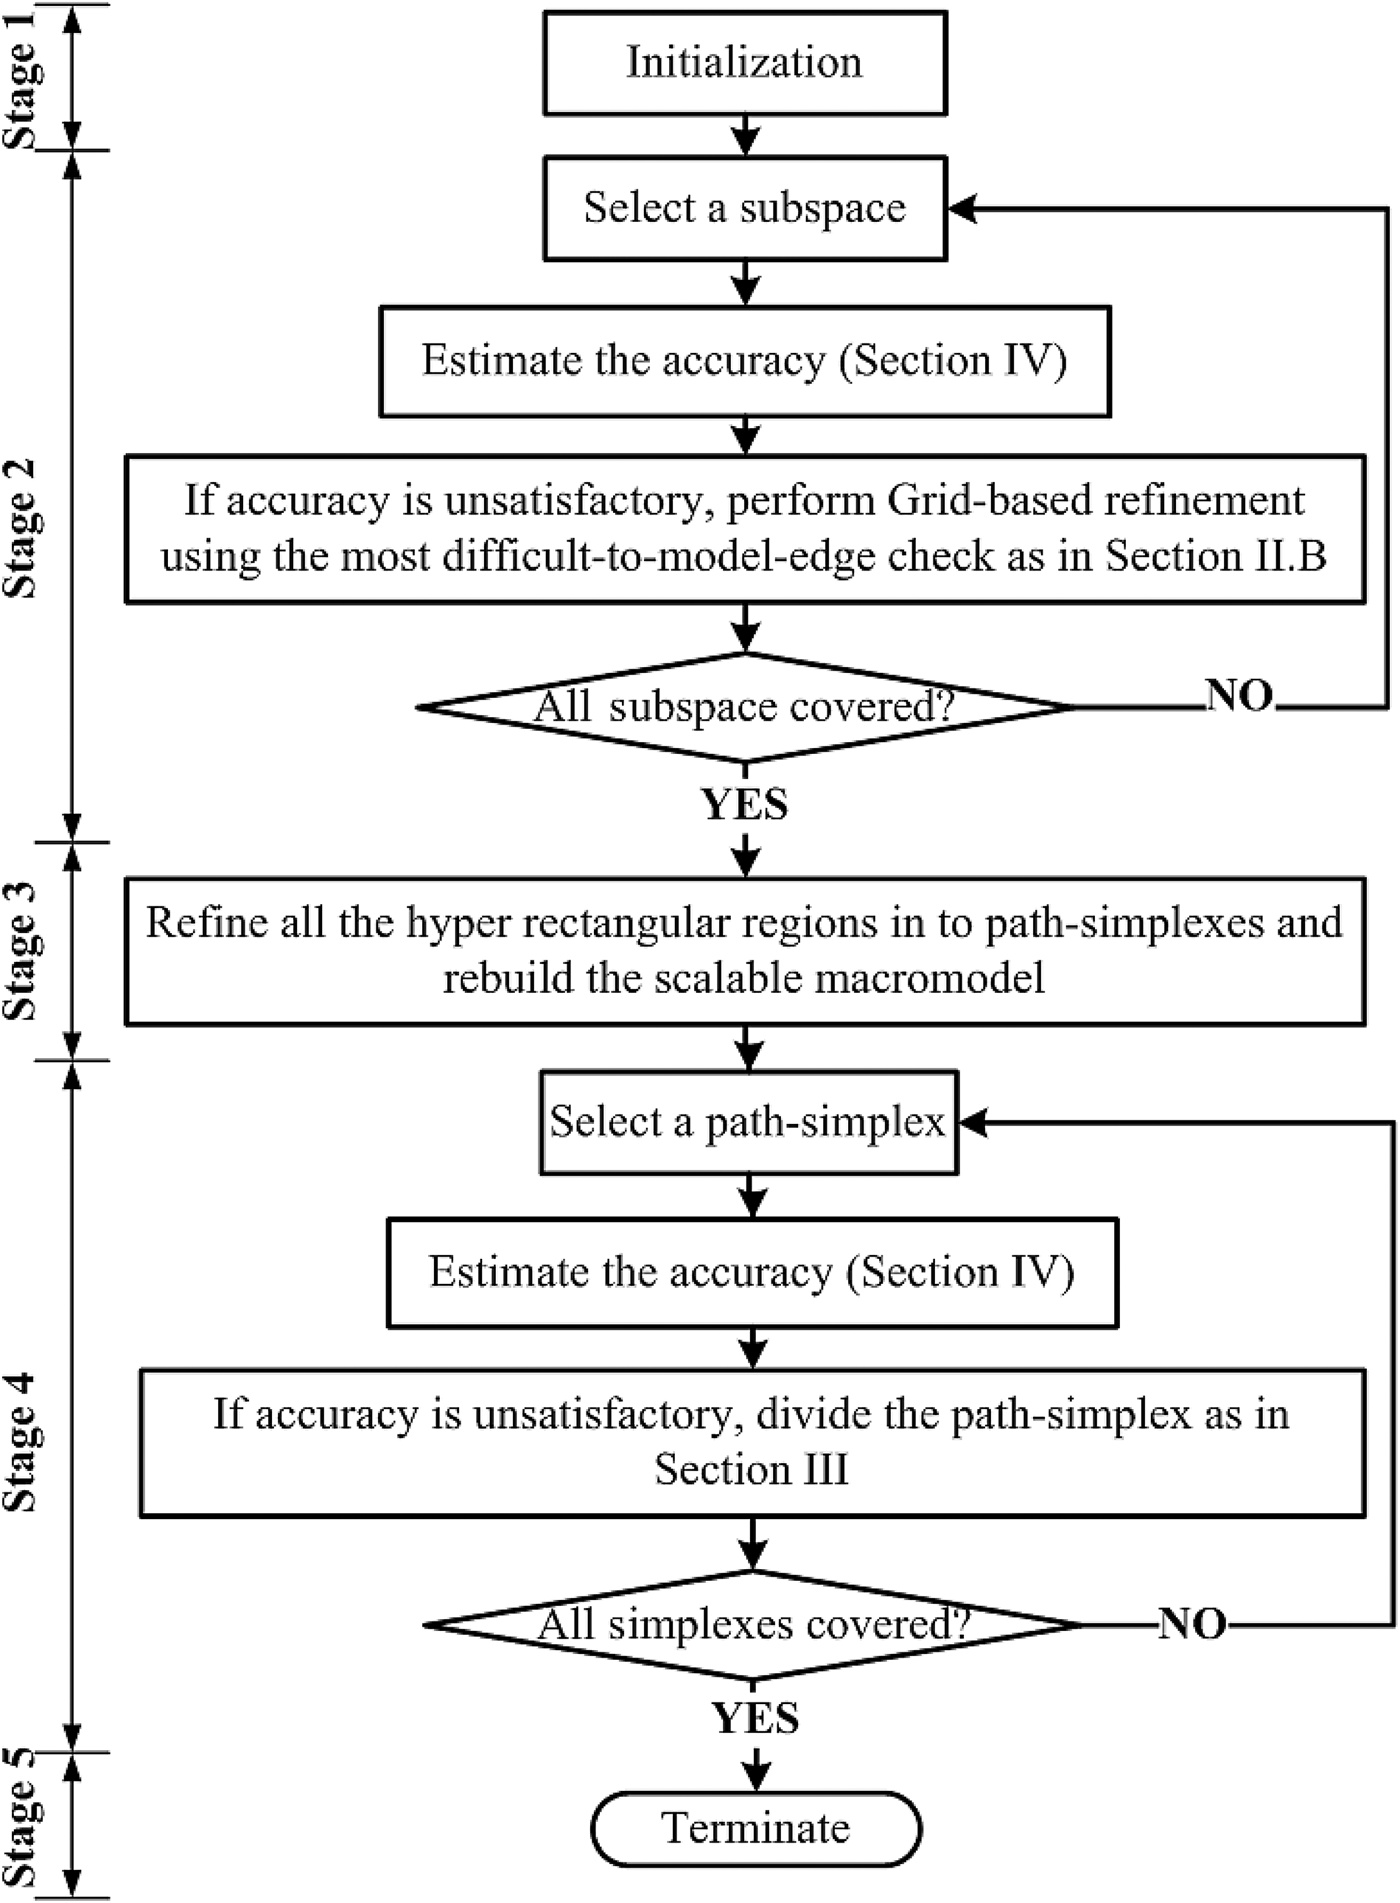
Figure 6 shows the flowchart of the proposed sequential sampling algorithm. The algorithm is divided into three major categories as explained below.
Flow chart of the proposed sequential sampling.

Stage 1: Initialization is done by defining the boundaries of the design space and then generating the 2 N corner root macromodels. Then an initial scalable macromodel is built for this subspace using [Reference Ferranti, Knockaert and Dhaene6] and this is the starting point of the tree-based sequential sampling. The number of EM simulations at this stage is only the 2 N corner points of the design space.
Stage 2: Then, the grid-based refinement is performed to refine the initial scalable macromodel using the edge refinement method as in Section II. B). At every iteration a subspace is selected and the modeling error is estimated using the parent–child response comparison as explained in Section IV. If the subspace is found to be inaccurate, the subspace is divided using a hyperplane perpendicular to the most difficult-to-model edge as per Section II. B) similar to Figure 2. This step is continued till all the subspaces are sufficiently accurate. This initial accuracy target can only be set depending on the problem at hand. For example, considering microwave filter, if a passband requirement of −30 dB is required, the scalable macromodel should be able to describe the filter characteristics up to an accuracy of −30 dB. So, the initial modeling accuracy can be set to the bare minimum accuracy required by the designer (−30 dB in the example stated here) such that this low fidelity model can already be used the design process. The number of EM simulations at this stage depends on the grid-based refinement.
Stage 3: In the next step, the initial grid generated is rearranged into path-simplexes regions. No additional EM simulations are required at this stage. Here, the model generated using the grid-based refinement is used as the starting point and then each and every terminal subspaces are refined into path-simplexes [Reference Brandts, Korotov, Krizek and Solc16]. It should be noted that, during this process only hyperrectangular regions are converted into path-simplex regions and no further calculation of scaling and frequency shifting parameters for the scalable macromodeling [Reference Ferranti, Knockaert and Dhaene6] is needed since the root-macromodels stays the same.
Stage 4: Finally, the Scattered refinement is done using the method of path-simplexes by which the final target accuracy is to be achieved. After this conversion, the simplex regions are selected and error is estimated at their incenters similar to Section IV. A higher accuracy can be selected here compared to Stage 2, but since the error is estimated between two different models (as in Section IV), the accuracy target at Stage 2 and Stage 4 can very well be equal and the convergence is checked by estimating the error between the two models. If the accuracy is not satisfied for some simplicial regions, they are further divided using the path-simplex refinement procedure of Section III until all the simplexes are accurate. As in the case of grid-based refinement, the number of EM simulation is decided by the scattered refinement process.
Stage 5: Once all the simplicial regions are accurate, the sequential sampling algorithm is terminated. No further EM simulations are required at this stage.
It is important to note that, when the range of the design space is increased, the algorithm takes care of the change by exploring the design space. This is done by generating additional samples (or root macromodels) in the newly added regions. Thus, by generating additional samples and refining the bigger regions into smaller domains, the algorithm will ensure that the scalable macromodeling scheme is able to build accurate models over the complete design space.
VI NUMERICAL RESULTS
In this section, three numerical examples are presented which demonstrate the capability of the proposed sequential sampling method for efficiently building the scalable macromodels for EM systems. For comparison purposes in terms of the computational time, all the numerical simulations have been performed on a Linux platform on Intel(R) Xeon(R) CPU E5504 @ 2.00 GHz machine with 6 GB RAM.
A) Example I: Microstrip bandpass filter
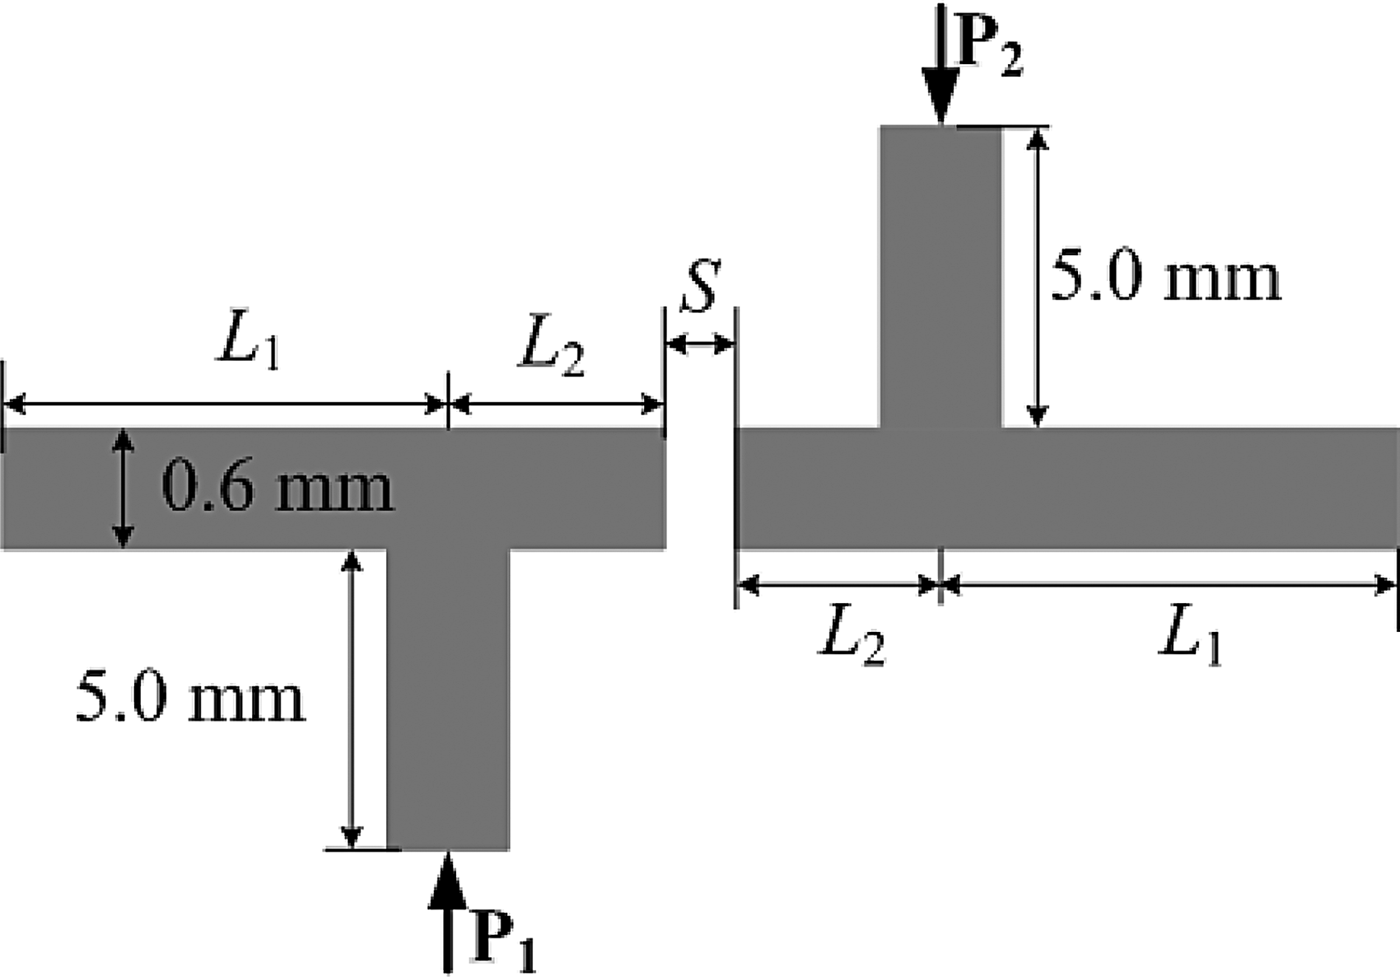
A microstrip bandpass filter on a substrate with relative permittivity ε r = 9.0 and a thickness of 0.660 mm is modeled in this example. The S-parameter response of the filter is generated with the help of ADS MomentumFootnote 1 . The ADS Momentum simulation engine is used in full-wave mode. All ports are defined as single mode ports, with 50 Ω characteristic impedance. The automatic meshing (with edge mesh) uses 20 cells per wavelength, at a mesh frequency of 6 GHz. The layout of this filter is shown in Figure 7. Two lengths L 1 and L 2 and the spacing S are chosen as design variables (see Figure 7) in addition to frequency whose ranges are L 1 ∈ [6.0, 7.0] mm, L 2 ∈ [4.0, 5.0] mm,
Example I: Layout of the microstrip bandpass filter.

S ∈ [0.05,0.10] mm, and frequency ∈ [4.0, 6.0] GHz. The mean absolute error (MAE) measure or the L1-norm per port is used to assess the accuracy of the model in every N-box region of the design space:
 $$E^{{\rm MAE}} \lpar \vec g\rpar = \mathop {max}\limits_{{u = 1\comma ...\comma P \atop v = 1\comma ...\comma P} } \displaystyle{1 \over {N_s }}\left({\sum\limits_{n = 1}^{N_s } \left\vert {R_{u\comma v} \lpar s_n \comma \; \vec g\rpar - H_{u\comma v} \lpar s_n \comma \; \vec g\rpar } \right\vert } \right).$$
The method compares the EM simulation response
 $H_{u\comma v} \lpar s\comma \; \vec g\rpar $
with the scalable macromodel response
 $R_{u\comma v} \lpar s\comma \; \vec g\rpar $
, where P is the number of system ports. The MAE error measure or the L1-norm gives a global view on the error between the two frequency responses and hence it is preferred. The target accuracy was kept at −45 dB and the initial refinement accuracy for the proposed method also kept at −45 dB.
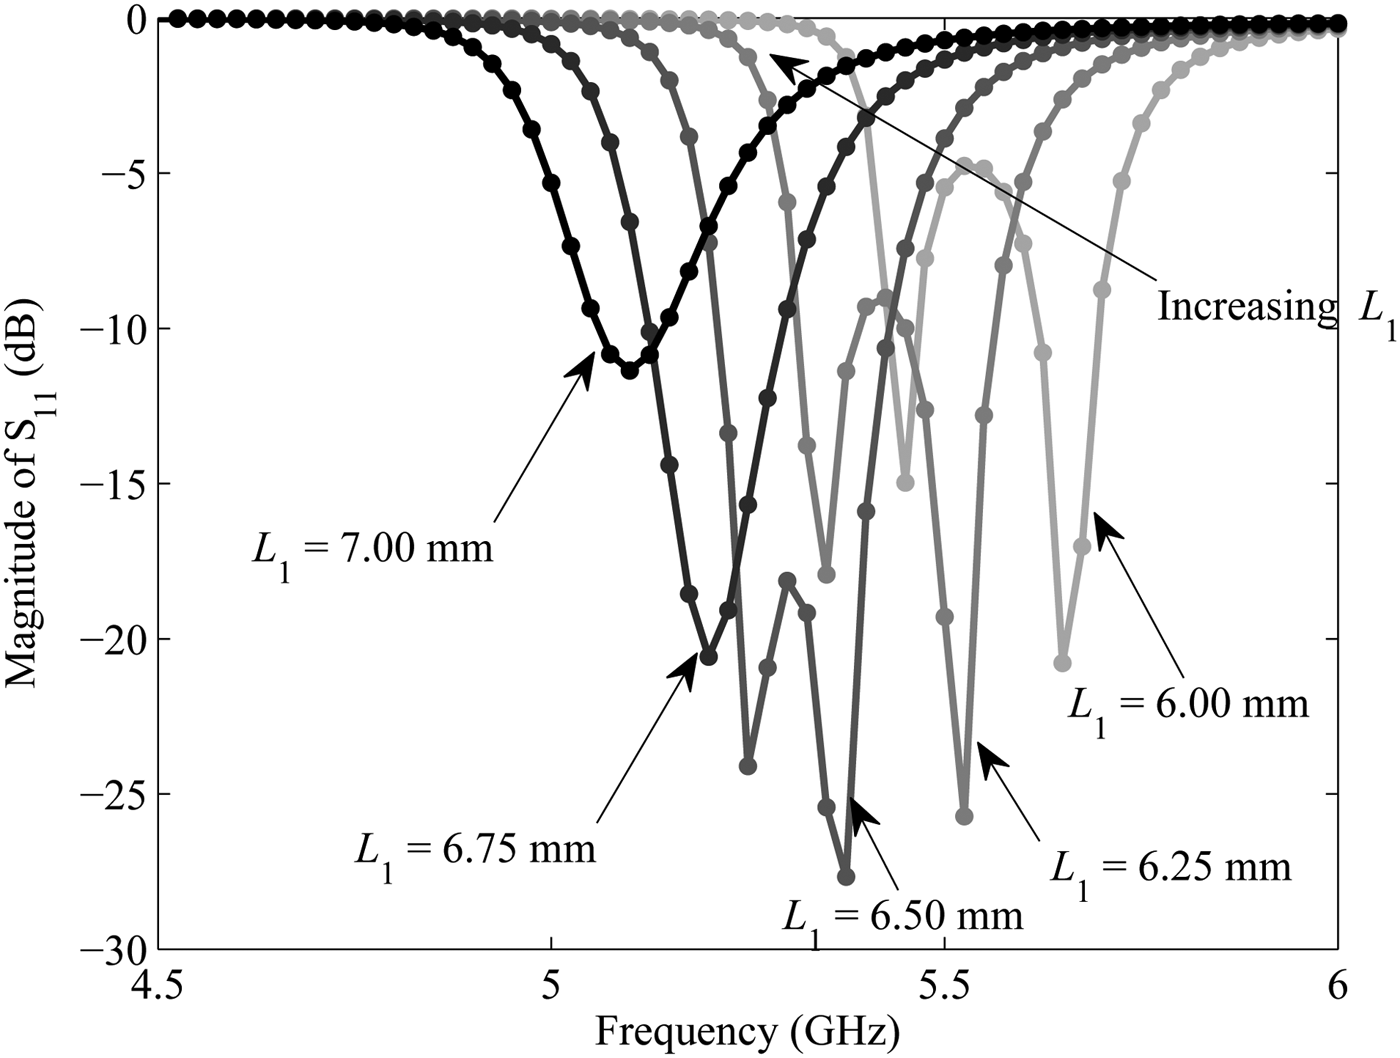
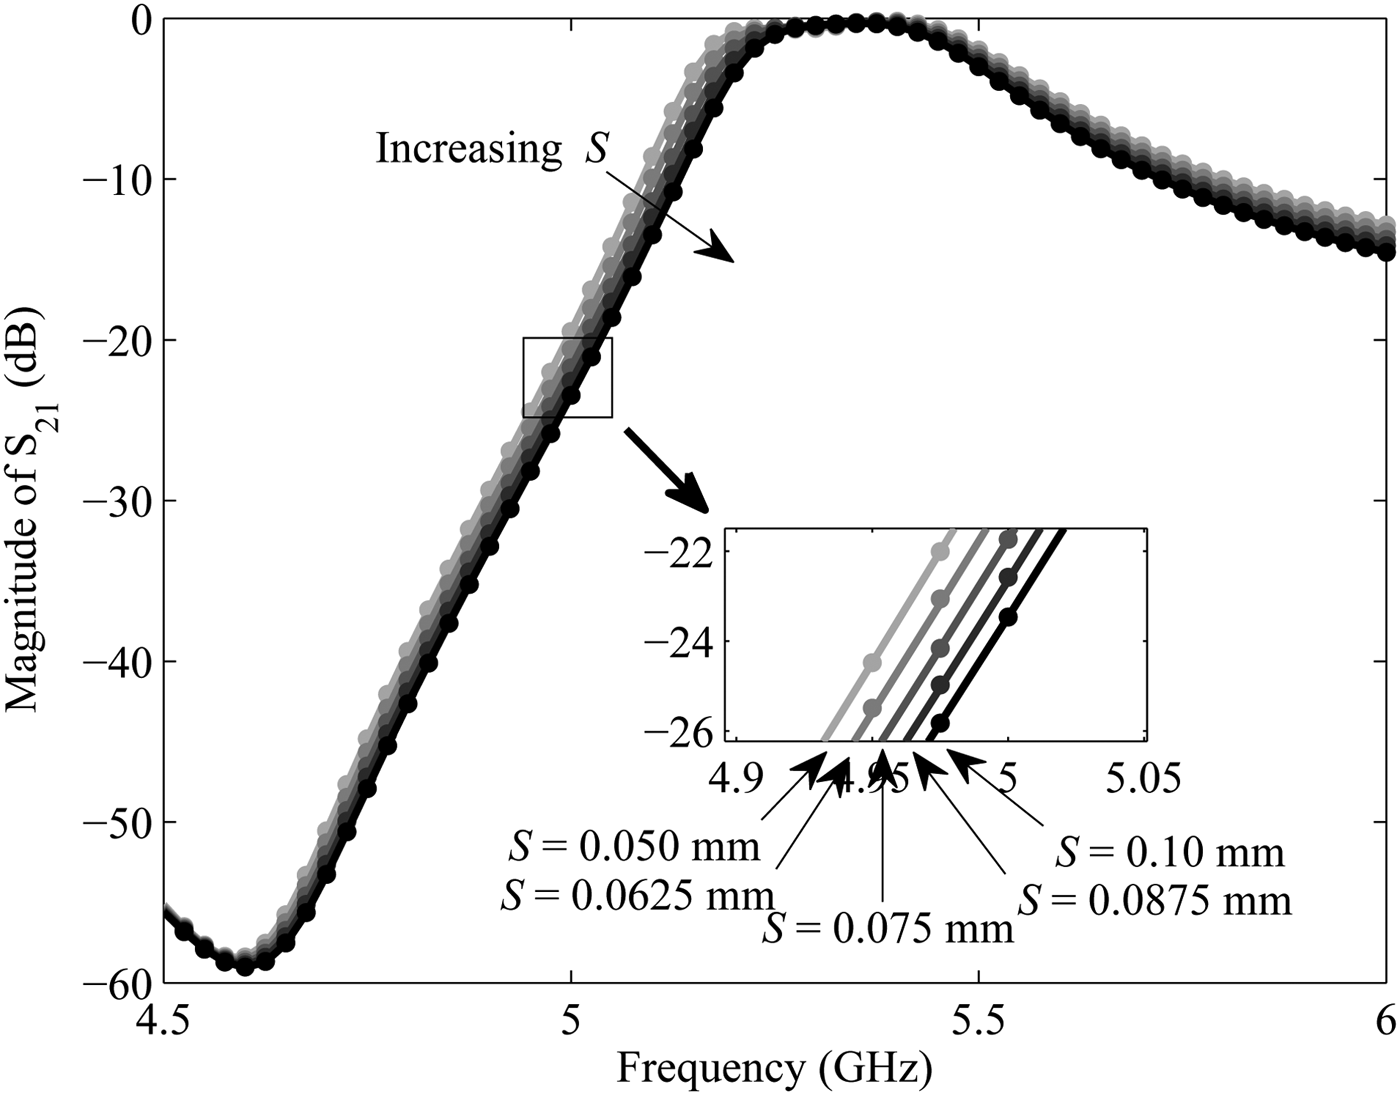
Figure 8 shows the parametric behavior of the magnitude of S 11 as a function of L1 and frequency, other values being kept at the mean value of the design space. Similarly, Figure 9 shows the magnitude of S 21 as a function of S and frequency. The proposed algorithm and the grid method [Reference Chemmangat, Ferranti, Dhaene and Knockaert14] have been implemented in Matlab R2012aFootnote 2 and used to drive the ADS Momentum simulations to generate S-responses with 31 frequency points at selected samples. The dotted curves in Figs. 8 and 9 represent the response of the scalable macromodel obtained from the proposed method. As seen a good agreement can be observed.
Example I: Magnitude of S 11 as a function of L 1.

Example I: Magnitude of S 21 as a function of S.

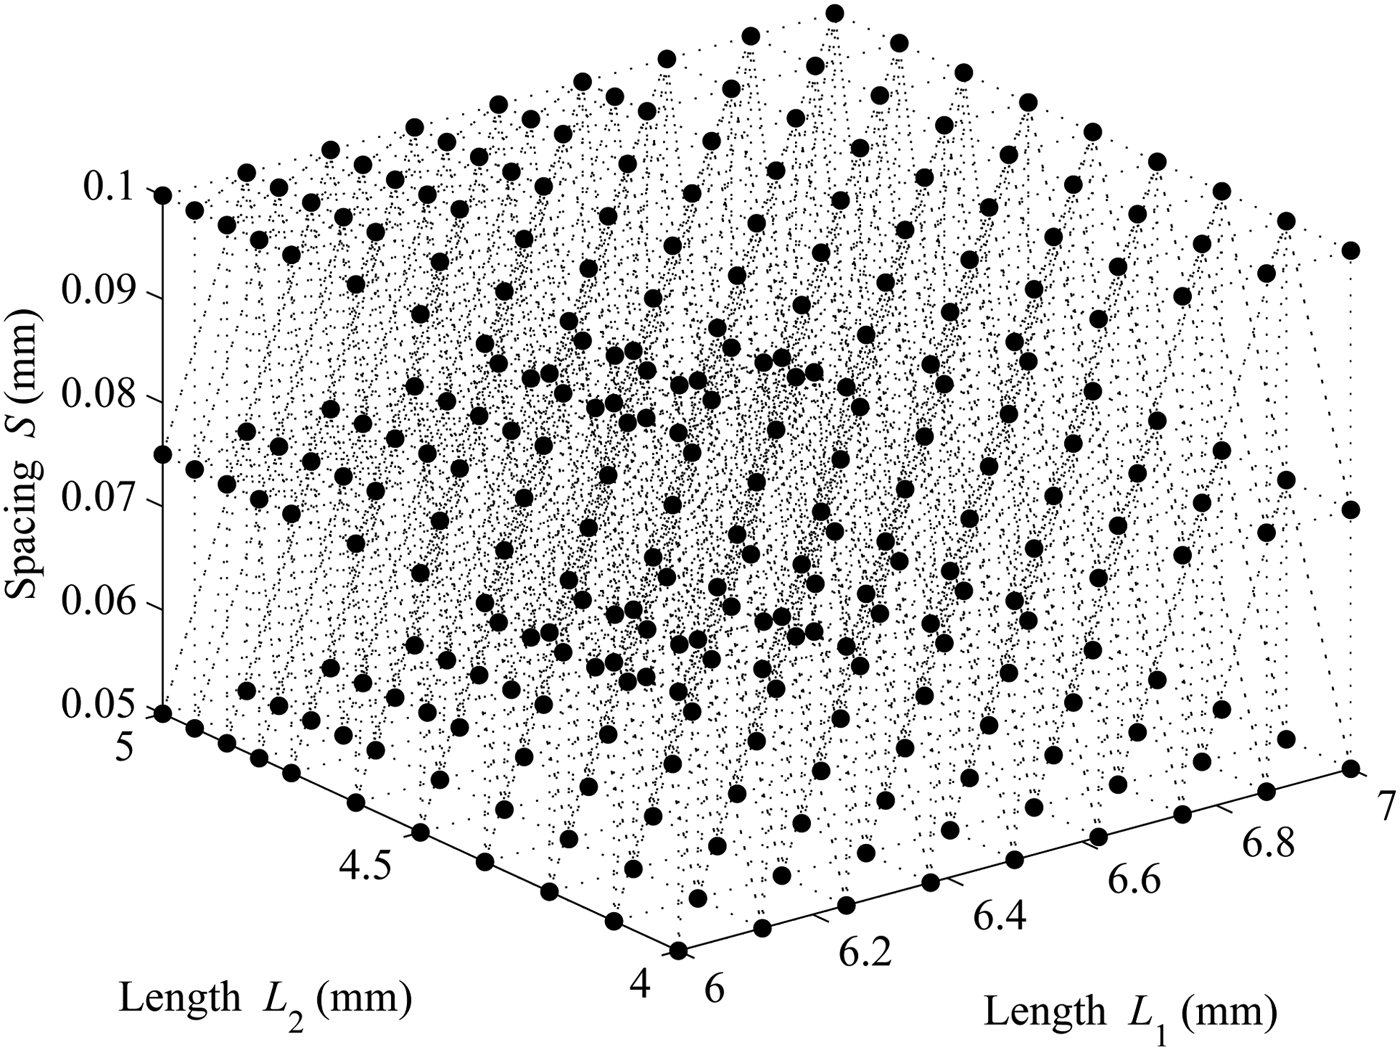
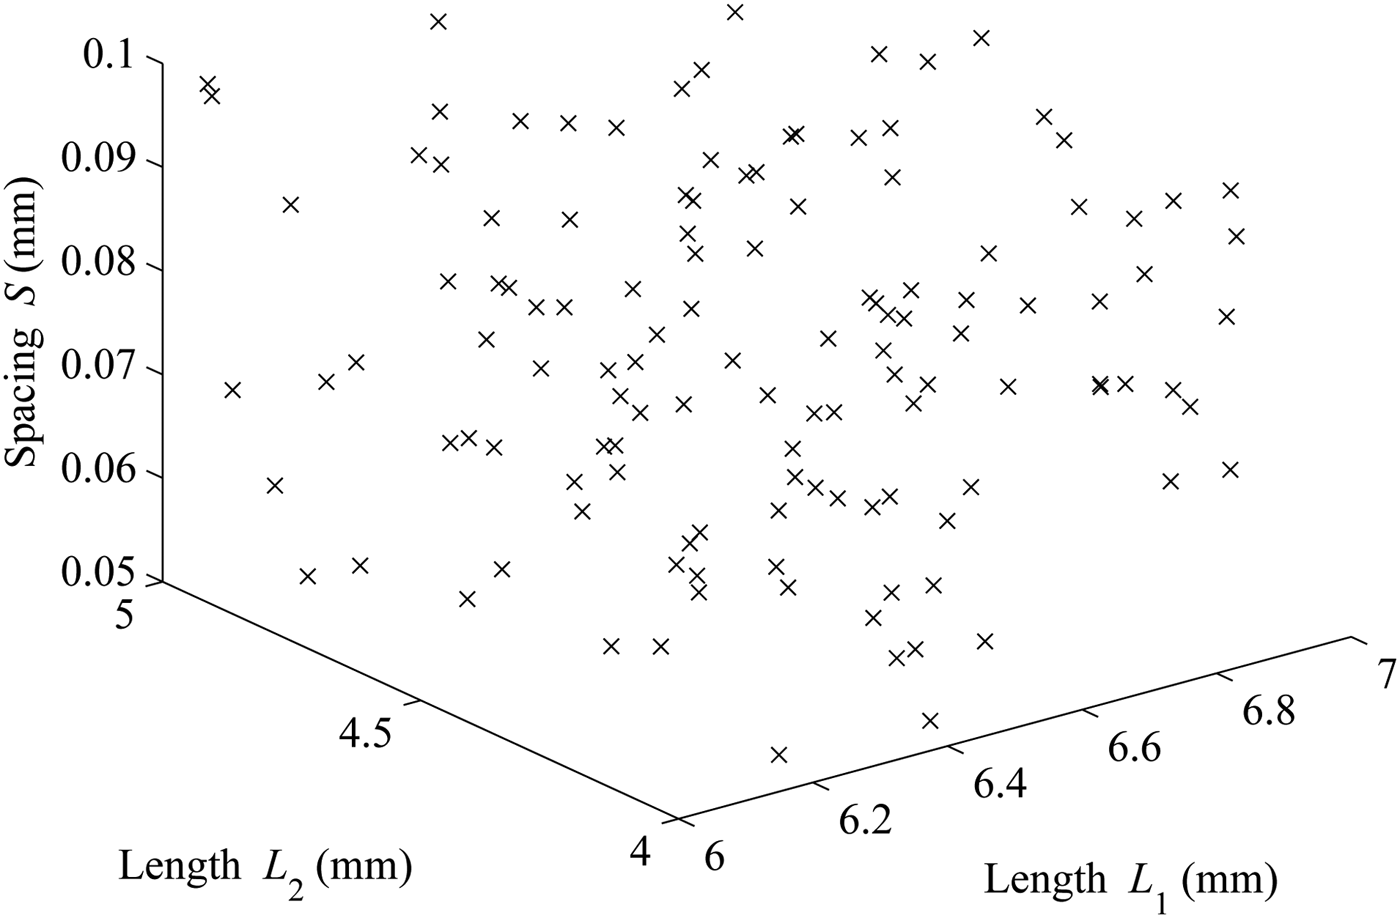
Figure 10 shows the distribution of the design sample points with the proposed hybrid sequential sampling algorithm. The tessellation with the path-simplexes are also shown here. It can be observed from Figure 10 that along the design variable L2, the maximum number of samples are taken, which means that this variable is highly influential on the output S-parameters of the filter. The design variable S is the least influential and hence it is sparsely sampled. Also, it can be noticed that the higher values of the design variable L 2 ∈ (4.5, 5.0) mm is more densely sampled than the other parts of the design space. This indicates a high sensitivity of the output S-parameter response of the filter to the changes in L 2 ∈ (4.5, 5.0) mm in comparison with the lower values, L 2 ∈ (4.0, 4.5) mm. In order to show the capability of the proposed algorithm, it is compared with the grid method on 125 verification points spread across the design space as shown in Figure 11 using a Latin hypercube space filling.
Example I: Sample distribution with the proposed algorithm.

Example I: Verification sample distribution.

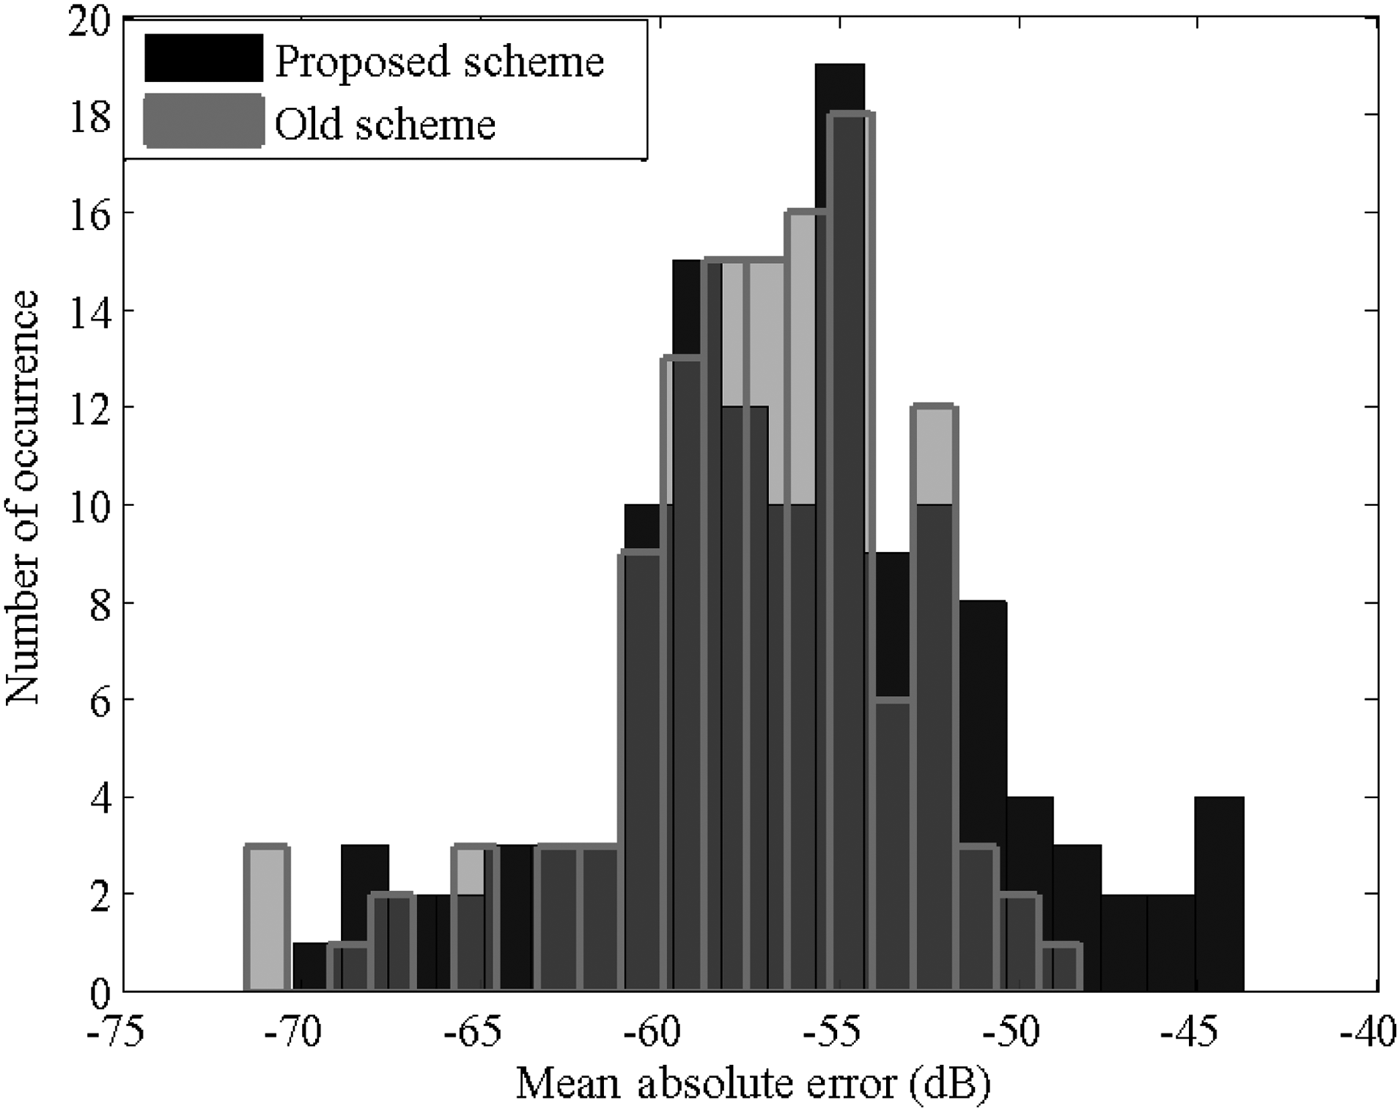
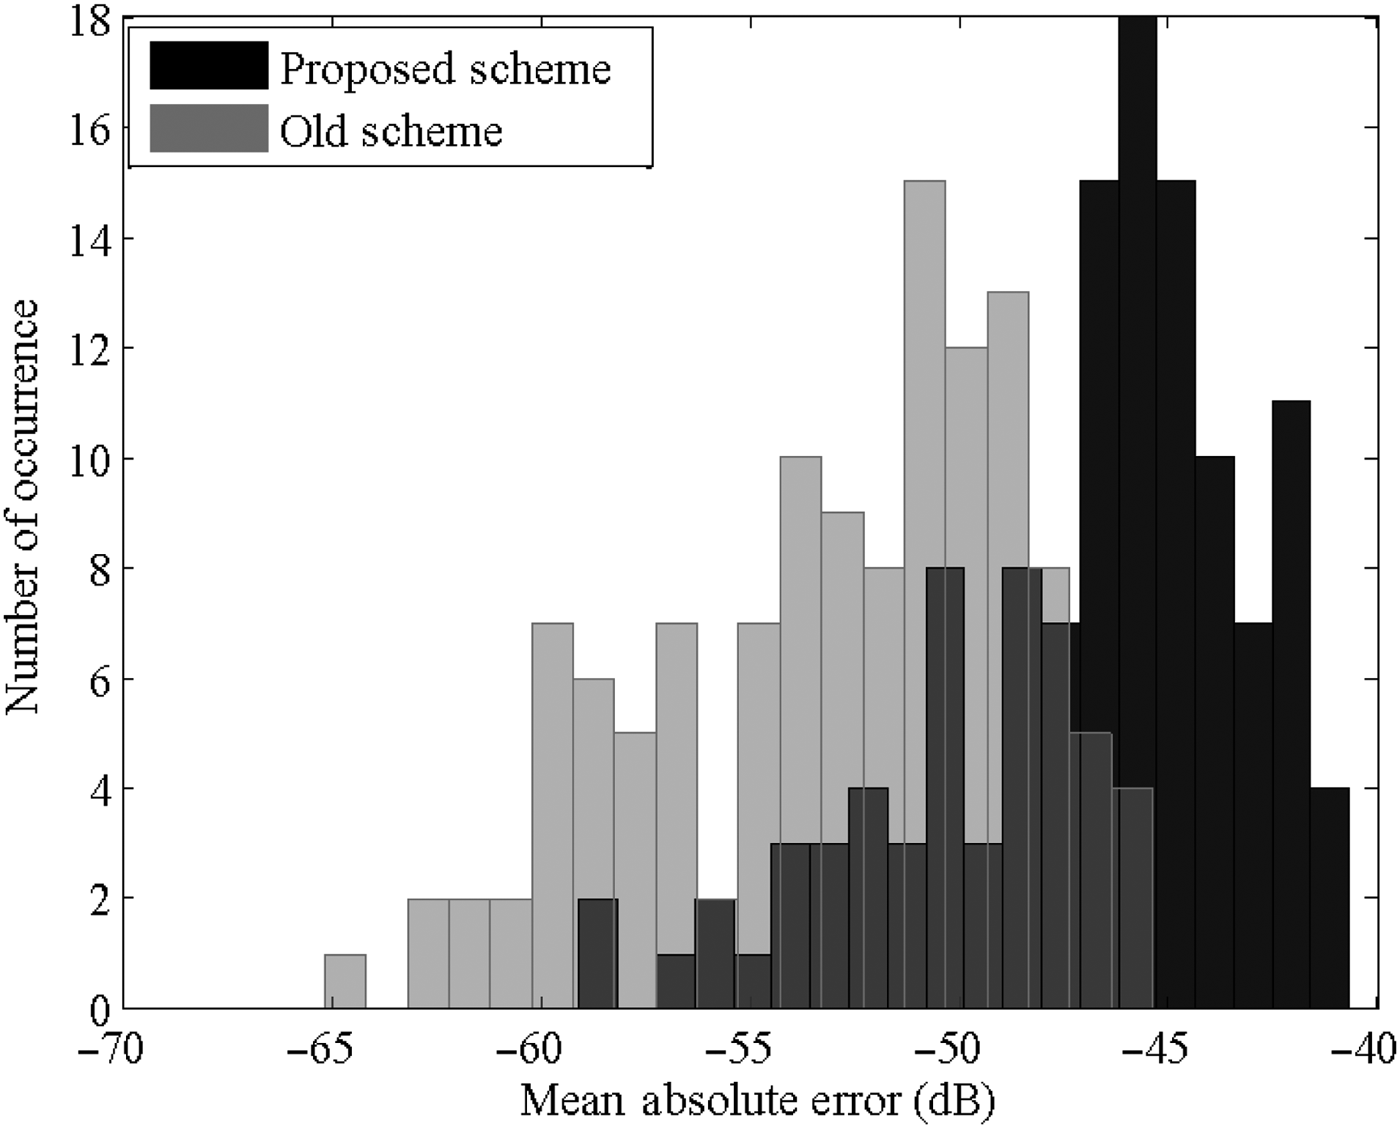
Figure 12 shows the mean absolute error distribution for both sequential sampling methods over the final verification points. As seen in the figure, a comparable accuracy is achieved for the proposed sequential sampling scheme without having to use any validation points during the sampling process like the grid method. Next, to check the advantage gained by performing a hybrid algorithm, the scalable macromodeling is performed directly on the scattered sampling. That is, the Stage 2 of the algorithm in Figure 6 is not performed and the algorithm is checked for its convergence. It was observed that the algorithm, even after generating 492 samples could converge only to an accuracy level of −25.11 dB. As explained in Section III, the path-simplex division, even though very well-conditioned, is highly exploratory in nature and hence slow in converging to a good modeling accuracy. Thus combining the advantages of both grid-based refinement and the simplicial refinement becomes necessary to have an efficient and automated sampling strategy.
Example I: Mean absolute error distribution for the final verification samples.

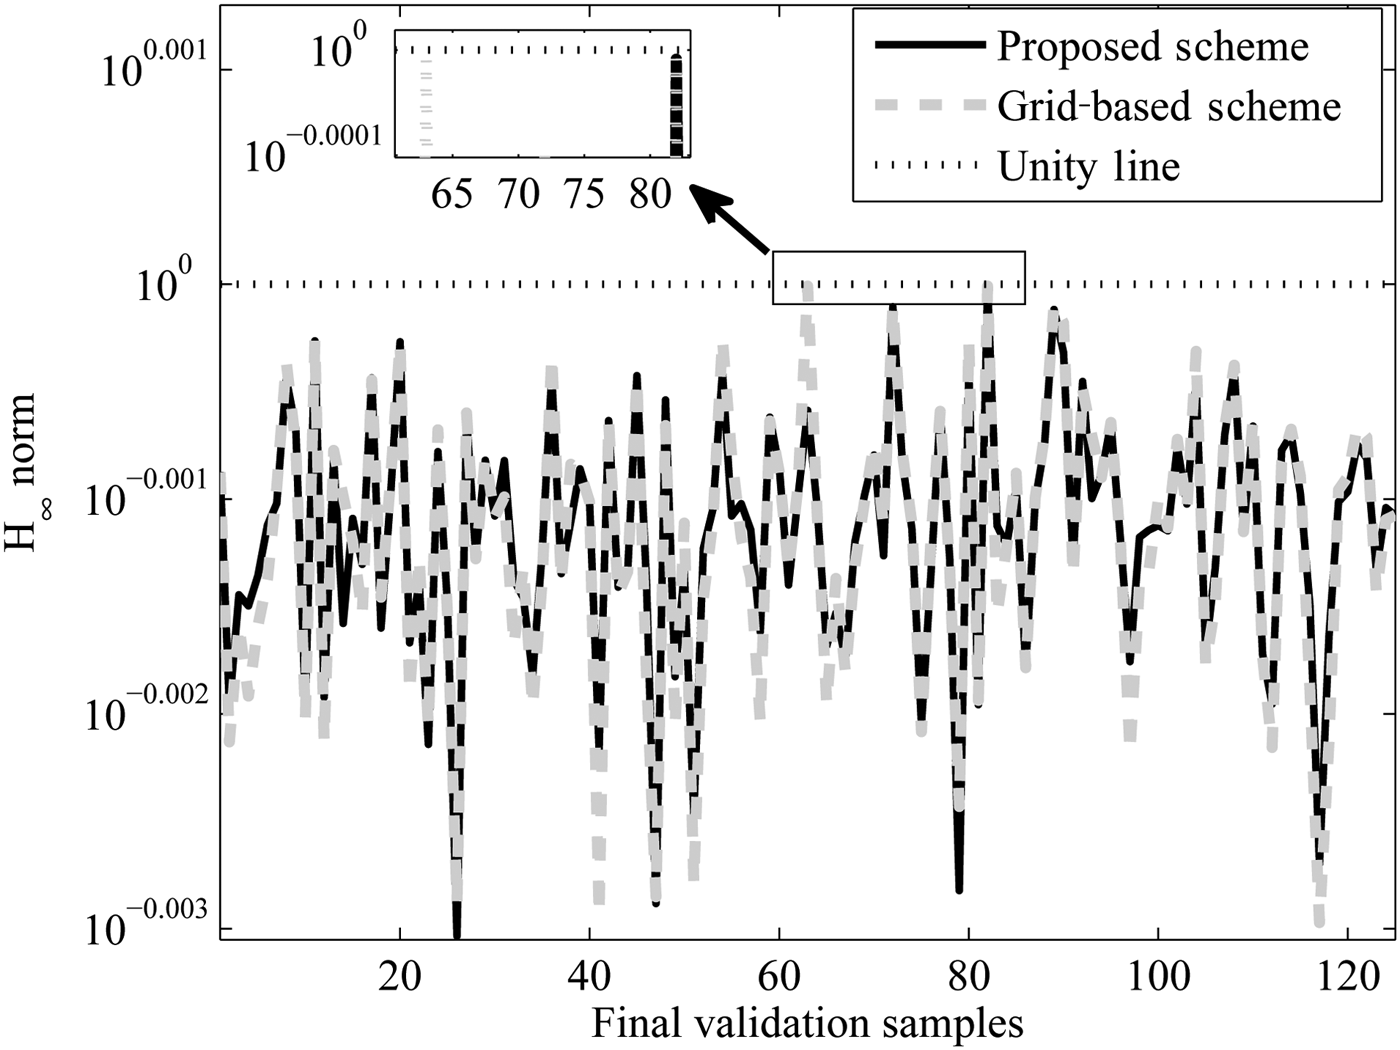
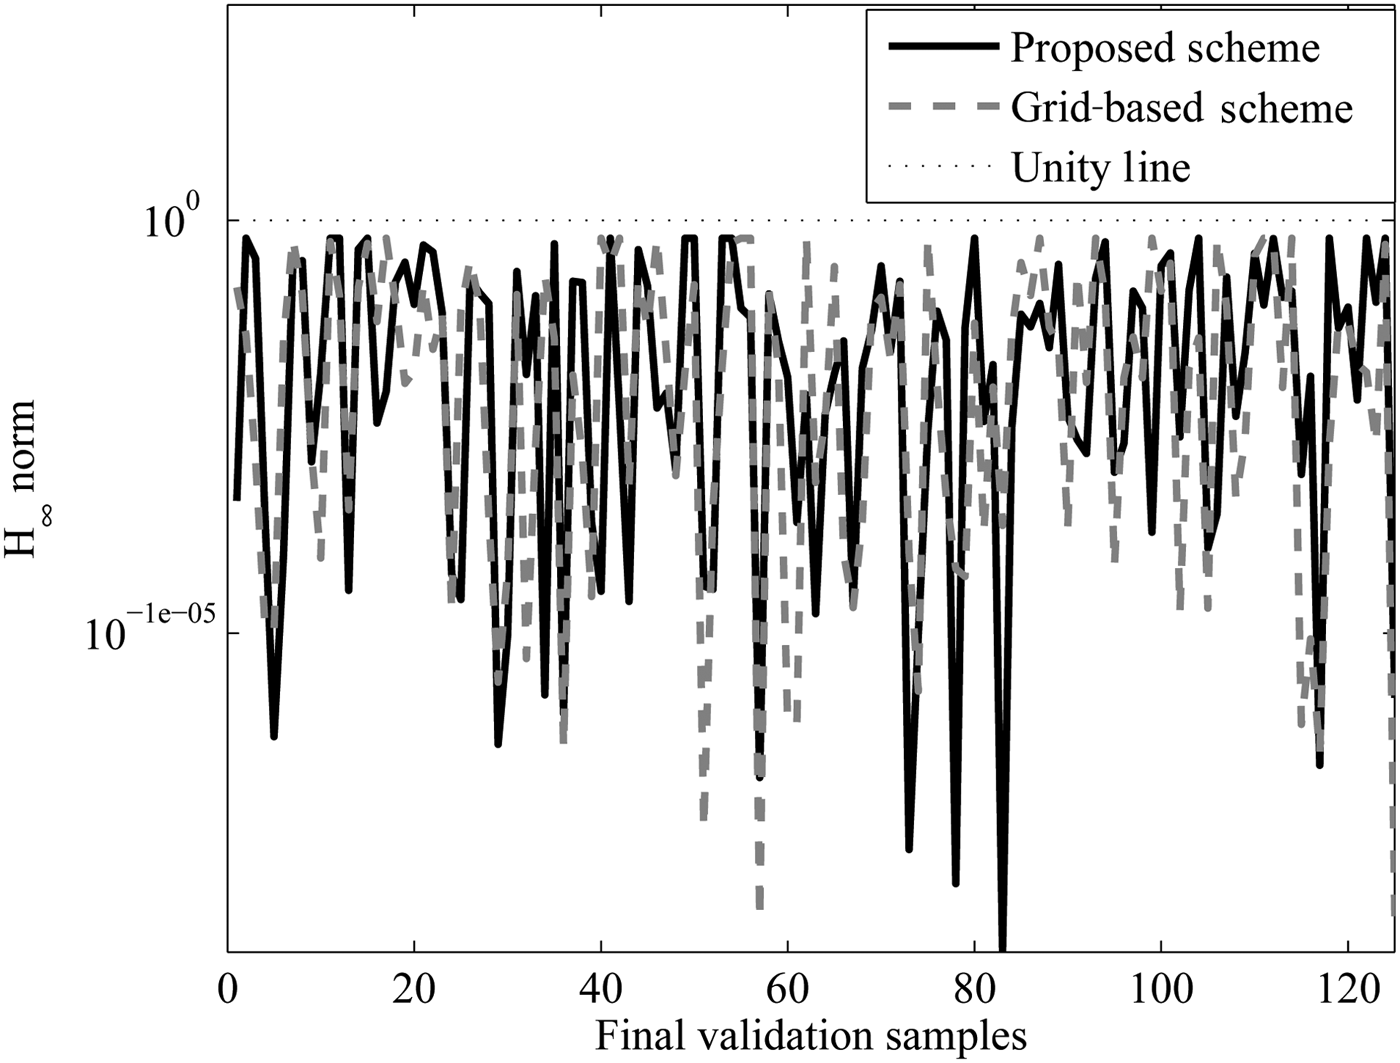
In order to check the passivity, the H ∞ norm ‖R(s, L 1, L 2, S)‖∞ of the scalable macromodel was calculated for the final 125 points and is plotted in Figure 13. From the figure, it is clear that maximum norm is bounded by unity as expected. Table 2 compares the two sampling schemes over some important parameters. As seen in the table, the maximum order of the scalable macromodel is relatively high for the grid method in comparison to the proposed scheme. This is because of the fact that all the 2 N corner root macromodels of a subspace is augmented in the grid method, whereas there are only N + 1 corner root macromodels defining a simplex for the proposed scheme. This becomes more severe with higher dimensions as will be seen in a later example. The table also shows the worst case mean absolute error for the two schemes and as expected, the proposed scheme has a slightly lower accuracy level, but only requires 40% of the samples compared to grid method (please note that the target accuracy level was −45 dB). This is because of the fact that the error is estimated at each level during the sampling whereas for the grid method it is validated using expensive EM simulations. This is the trade off between the two sampling schemes.
Example I: H ∞ norm for the final verification samples.

Example I: Comparison of different sampling strategies.

Finally, to see the speed-up gained using a scalable macromodel in the design process, the time required for one single frequency response evaluation of the scalable macromodels are compared with the corresponding EM simulator time and the speed-up is tabulated in Table 2. The speed-up for each case is calculated by comparing the evaluation time for one frequency sweep using the macromodel (column 7 of Table 2) with the CPU time for the EM simulator. However, it should be noted that the generation of the scalable macromodel requires some initial EM simulations, but once the model is built, it can be used in multiple design optimization scenarios such as changing specifications, to make the overall design cycle very efficient.
So, in conclusion the following points can be observed from Table 2:
-
(1) The number of samples required for the proposed scheme is reduced in comparison with the methods of [Reference Chemmangat, Ferranti, Dhaene and Knockaert14, Reference Chemmangat, Dhaene and Knockaert22].
-
(2) The validation samples are completely removed by estimating error by comparing two different levels of the model as in Section IV.
-
(3) Estimating the error means that the accuracy of the proposed method might not be as good as the grid method of [Reference Chemmangat, Ferranti, Dhaene and Knockaert14]. This is the trade-off between the validation points and error estimation.
-
(4) The modeling complexity is reduced in comparison with grid method of [Reference Chemmangat, Ferranti, Dhaene and Knockaert14] as explained before in Table 1. This also gains in the speed-up in terms of the scalable macromodel evaluation as clear from the last column of the table.
B) Example II: Microstrip with two coupled vias
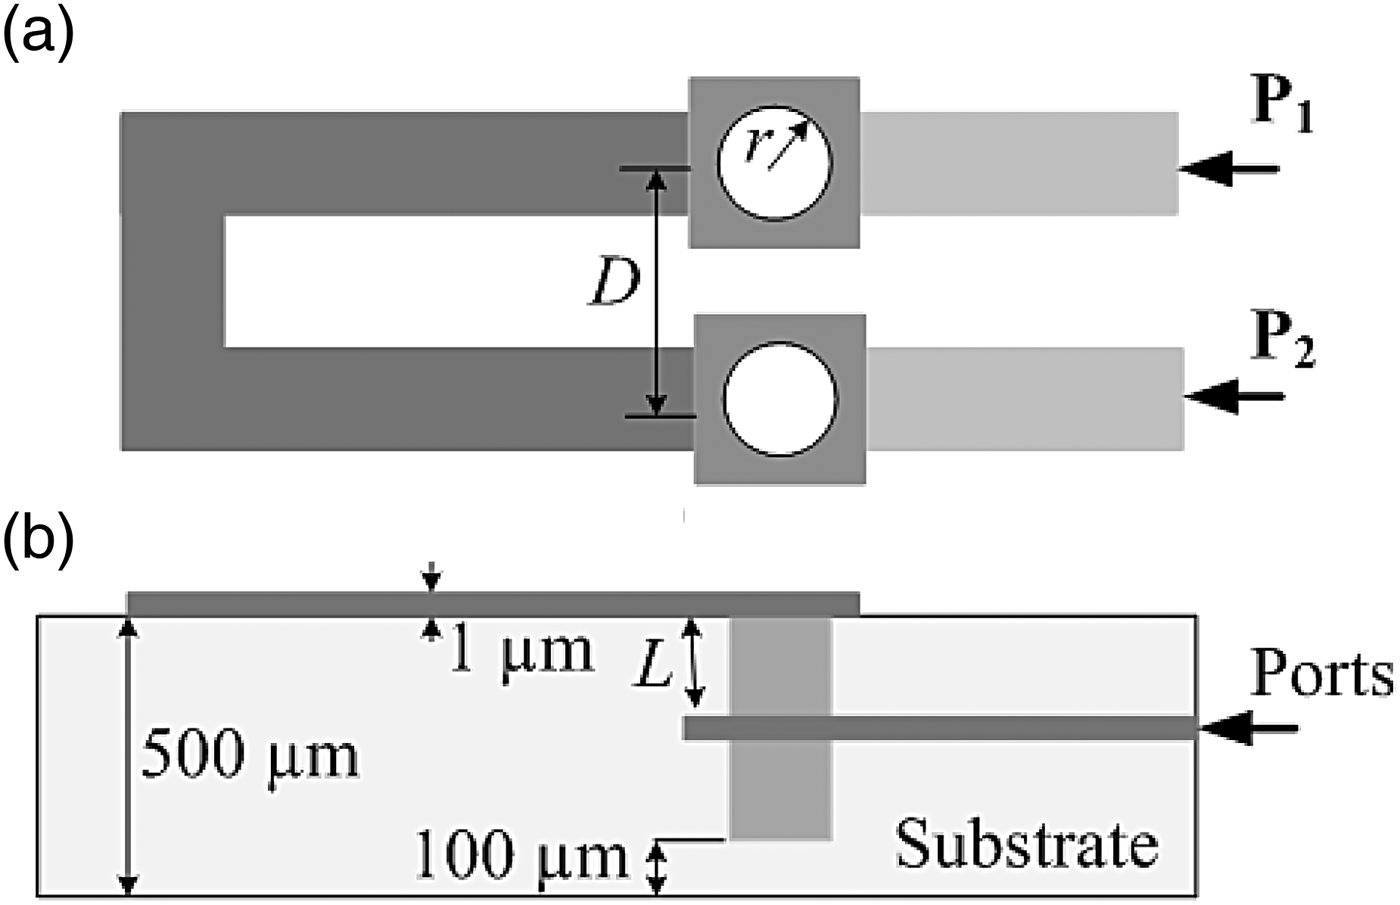
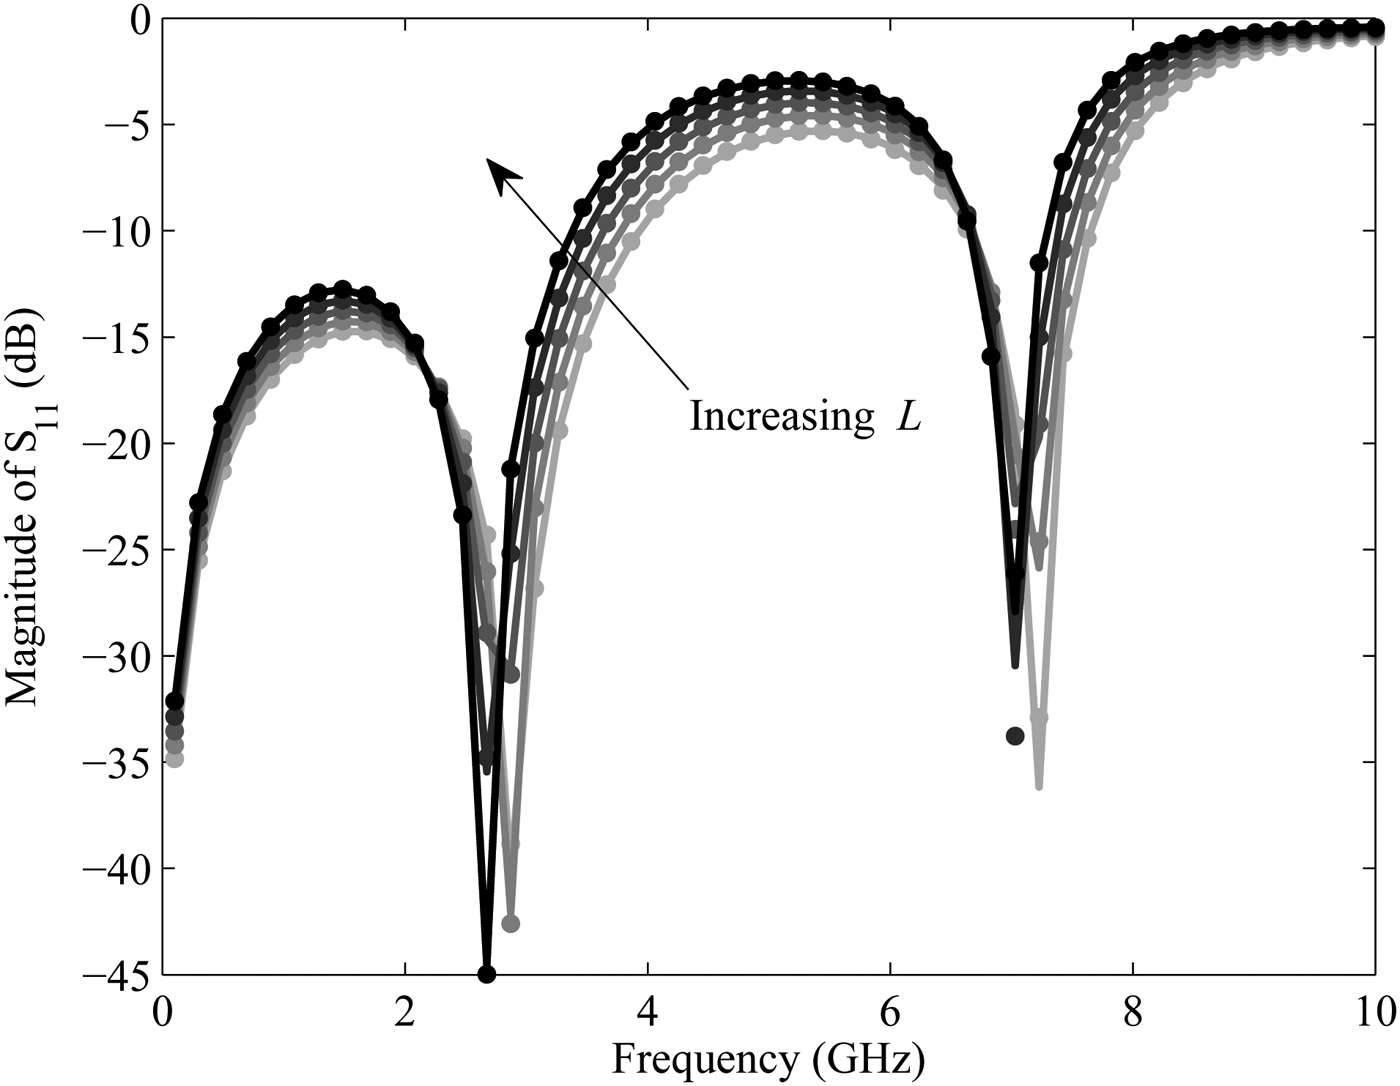
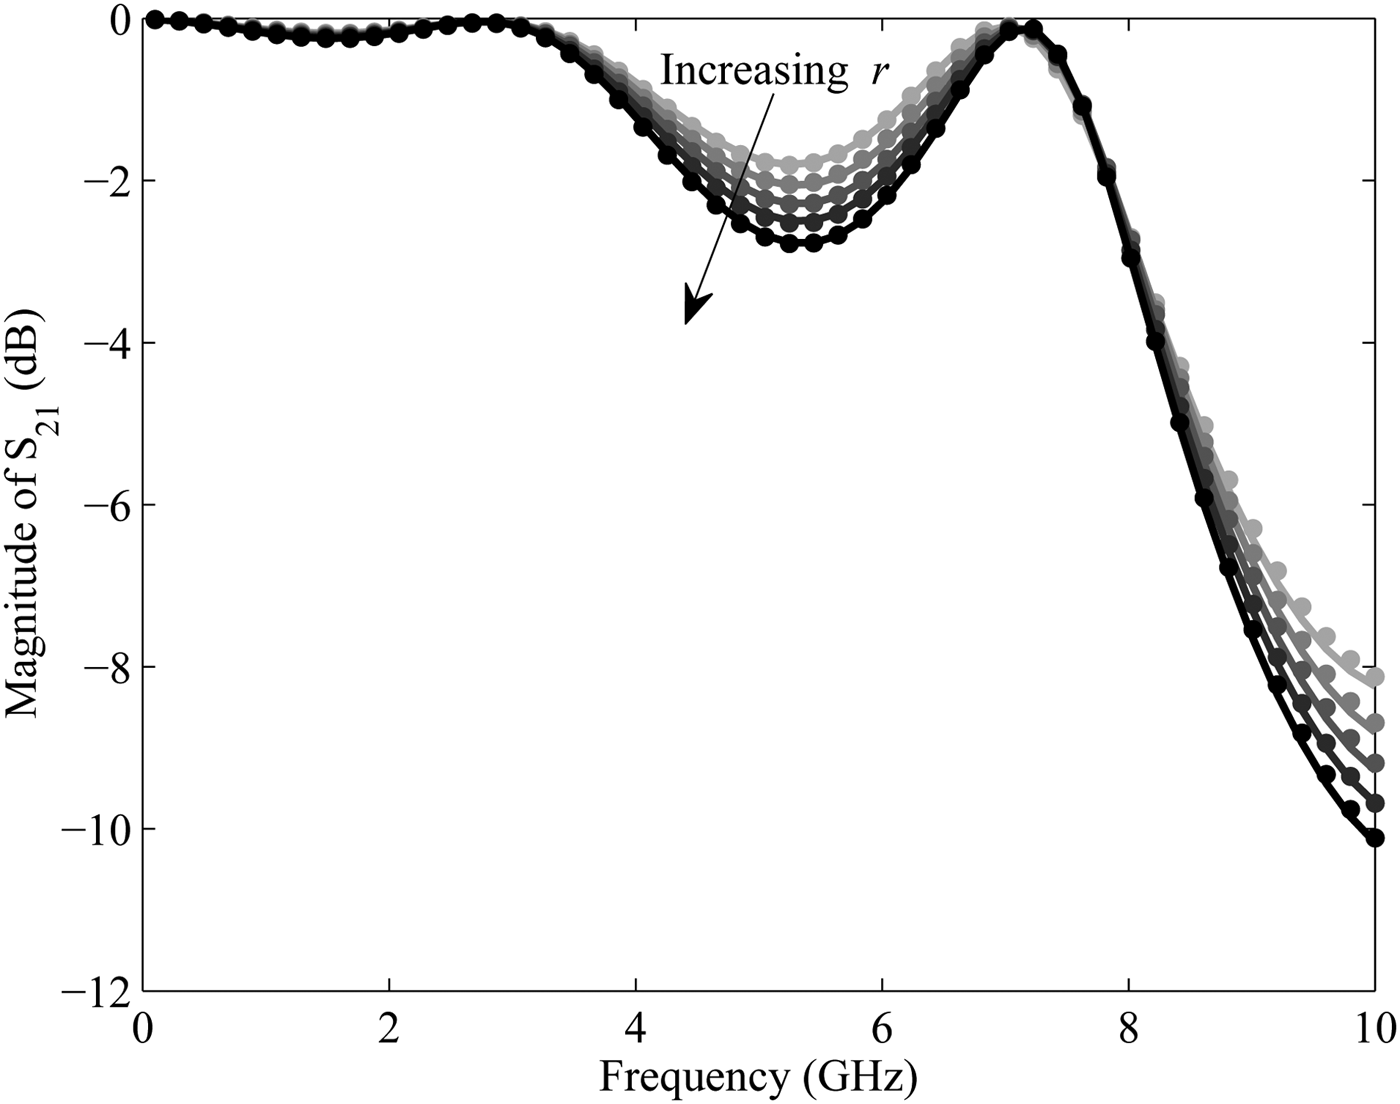
A microstrip with two coupled vias on a substrate with relative permittivity ε r = 9.0 and a thickness of 500 µm is modeled in this example. The S-parameter response of the structure is generated with ADS Momentum. The ADS Momentum simulation engine is used in full-wave mode. All ports are defined as single mode ports, with 50 Ω characteristic impedance. The automatic meshing (with edge mesh) uses 30 cells per wavelength, at a mesh frequency of 5 GHz. Figure 14 shows the top and cross-sectional view of the structure. The length of the two vias L, the distance between the two vias D and the radius of the vias r are chosen as design variables (see Figure 14) in addition to frequency whose ranges are L ∈ [150, 250] µm, D ∈ [1.5, 2.5] mm, r ε [0.1, 0.4] mm, and frequency ε [0.1,10.0] GHz. The target accuracy (6) was kept at −45 dB and the initial refinement accuracy for the proposed method also kept at −45 dB. Figure 15 shows the parametric behavior of the magnitude of S 11 as a function of L and frequency, other values being kept at the mean value of the design space. Similarly, Figure 16 shows the magnitude of S 21 as a function of r and frequency. As in Example I, the proposed algorithm and the grid method [Reference Chemmangat, Ferranti, Dhaene and Knockaert14] have been implemented in Matlab R2012a and used to drive the ADS Momentum simulations to generate S-responses at selected samples. The dotted curves in Figs. 15 and 16 represent the response of the scalable macromodel obtained from the proposed method. As seen a good agreement can be observed. As in the previous example, the proposed algorithm is compared with the grid method on 125 verification points spread across the design space using a Latin hypercube space filling. Figure 17 shows the mean absolute error distribution for the sequential sampling methods over the final verification points. A comparable accuracy is achieved for the proposed sequential sampling scheme as it was observed for Example I. The H ∞ norm ‖R(s, L, D, r)‖∞ of the scalable macromodel was calculated for the final 125 points and is plotted in Fig. 18 and it is observed to be passive.
Example II: Layout of microstrip with two coupled vias: (a) top view, (b) cross-sectional view.

Example II: Magnitude of S 11 as a function of L.

Example II: Magnitude of S 21 as a function of r.

Example II: Mean absolute error distribution for the final verification samples.

Example II: H ∞ norm for the final verification samples.

Table 3 compares the two sampling schemes over some important parameters similar to Table 2 for the first example. As for the Example I, a similar conclusion can be derived for the different quantities such as maximum model order, mean error etc. Note that the target accuracy level was −40 dB. The trade off between the two sampling schemes in terms of the error versus number of modeling samples required is also clear in the Table 3. As in the first example, to show the speed-up gained using a scalable macromodel in the design process, the time required for one single frequency response evaluation of the scalable macromodels are compared with the corresponding EM simulator time and the speed-up is tabulated in Table 3.
Example II: Comparison of different sampling strategies.

So from Table 3 a similar conclusion can be derived as in the case of Example I.
C) Example III: Ring resonator filter
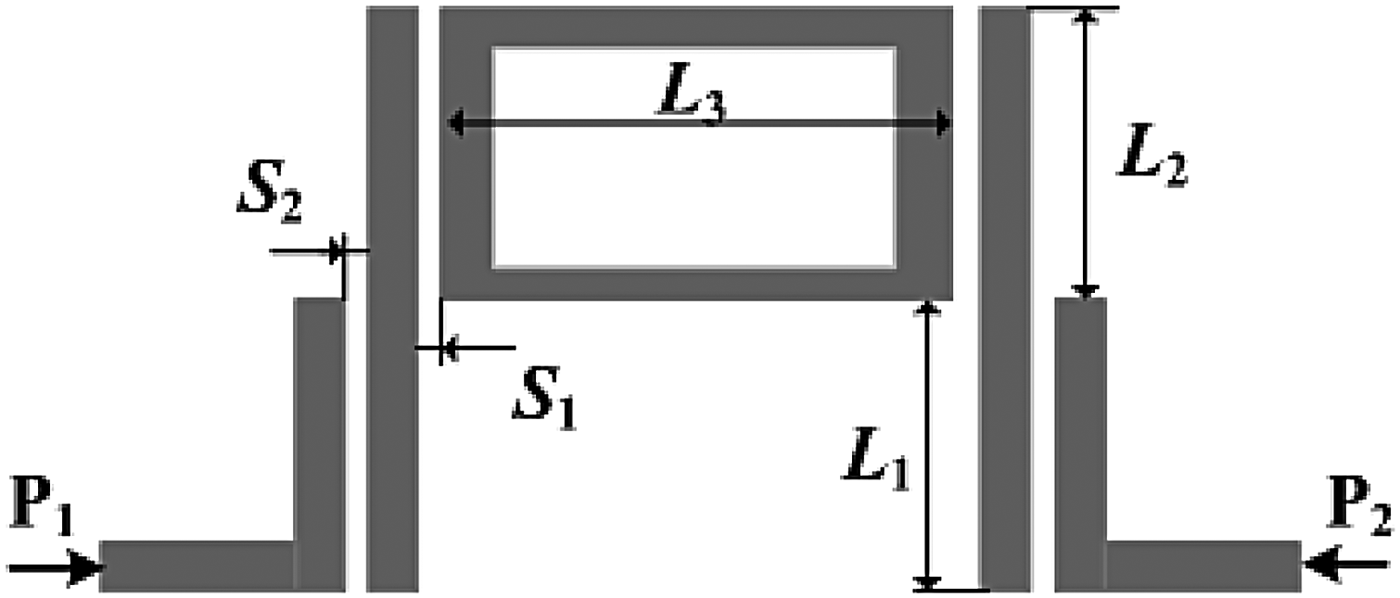
A ring resonator bandpass filter on a substrate with relative permittivity ε r = 4.32 and a thickness of 152 µm is modeled in this example. The layout of this filter is shown in Figure 19. The S-parameter response of the structure is generated with ADS Momentum. The ADS Momentum simulation engine is used in full-wave mode. All ports are defined as single mode ports, with 50 Ω characteristic impedance. The automatic meshing (with edge mesh) uses 20 cells per wavelength, at a mesh frequency of 4 GHz. Two spacings S 1 and S 2 and three lengths L 1, L 2, and L 3 are chosen as design variables (see Fig. 19) in addition to frequency whose ranges are S 1 ∈ [0.20, 0.30] mm, S 2 ∈ [0.04, 0.06] mm, L 1 ∈ [20.0, 24.0] mm, L 2 ∈ [19.0, 21.0] mm, L 3 ∈ [26.0, 27.0] mm and frequency ∈ [1.0, 3.0] GHz. The MEA measure (6) was used to estimate the modeling accuracy. The target accuracy was kept at −40 dB and the initial refinement accuracy for the proposed method also kept at −40 dB.
Example III: Layout of ring resonator bandpass filter.

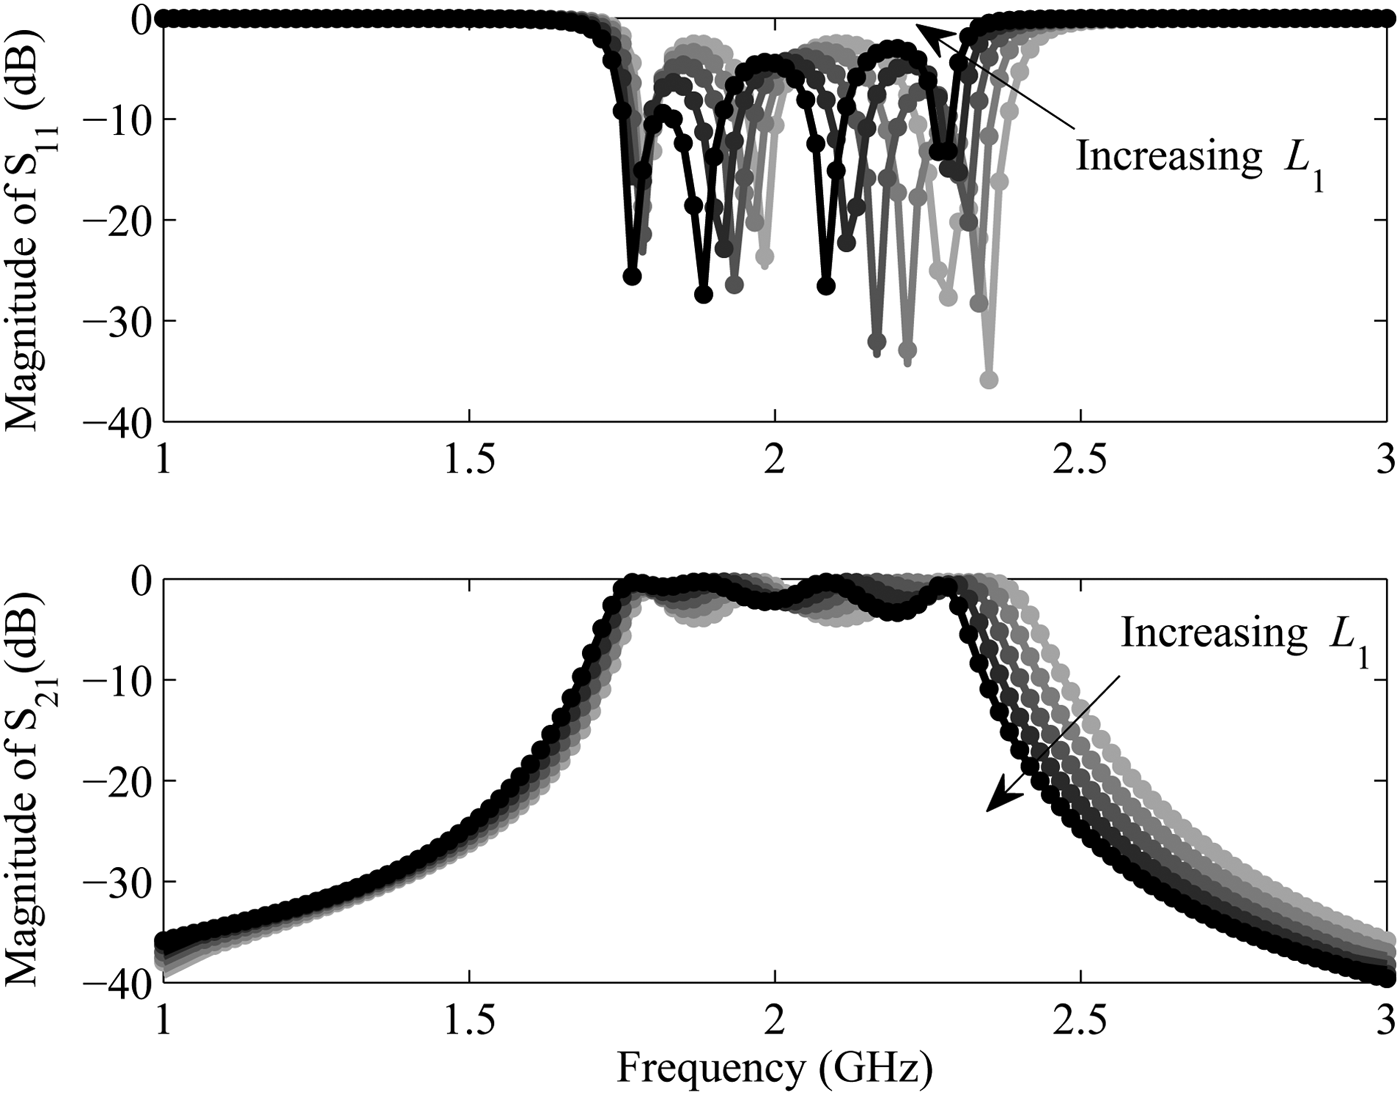
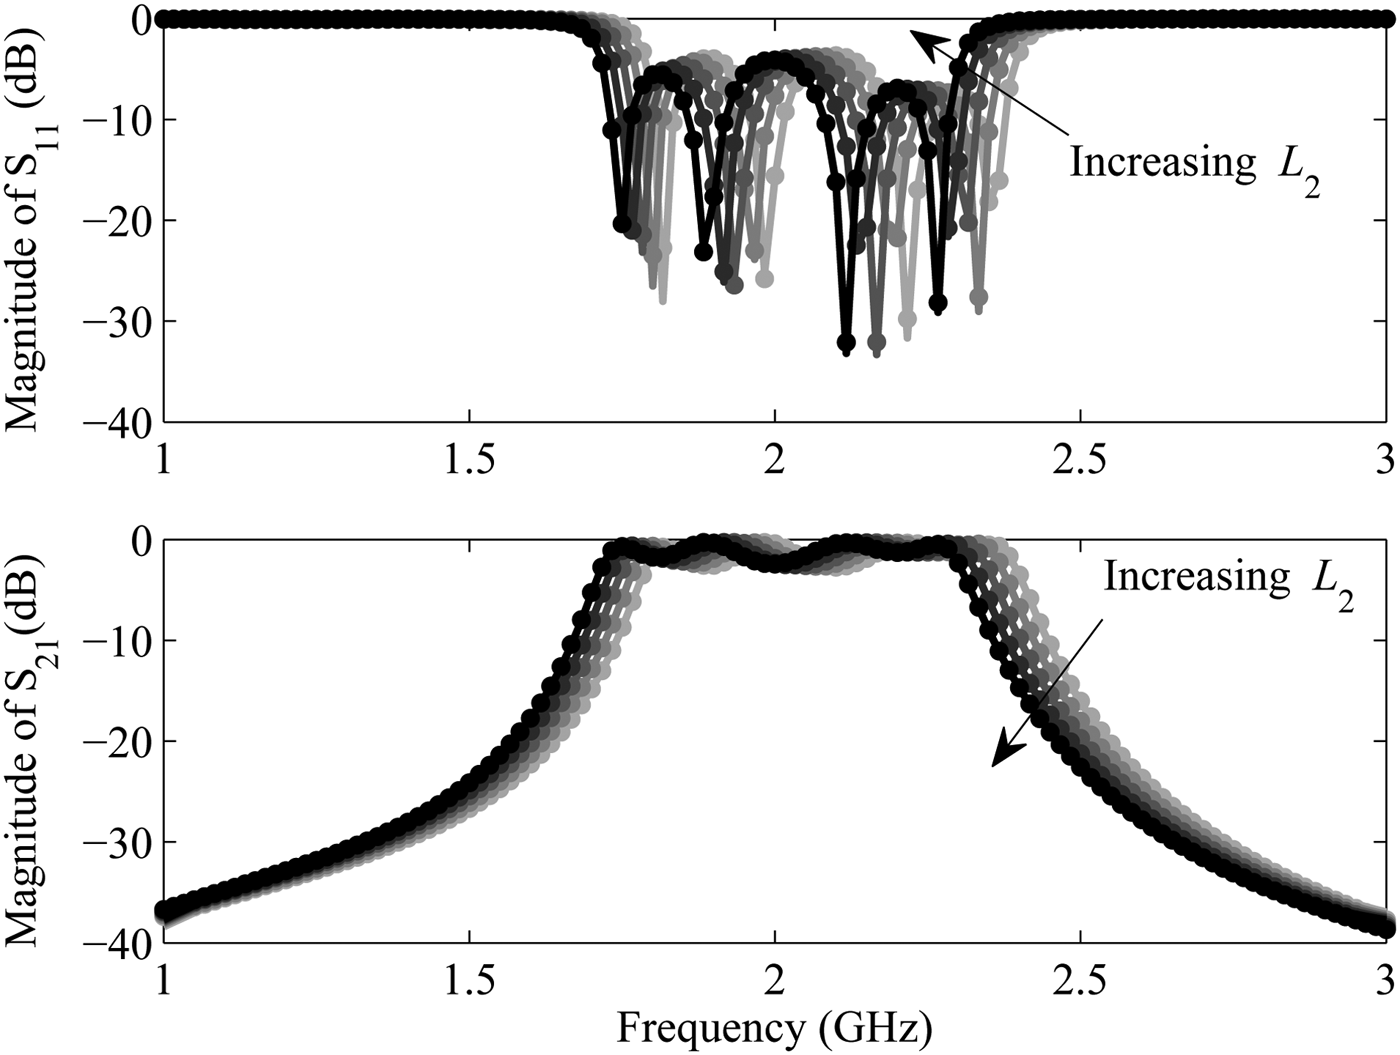
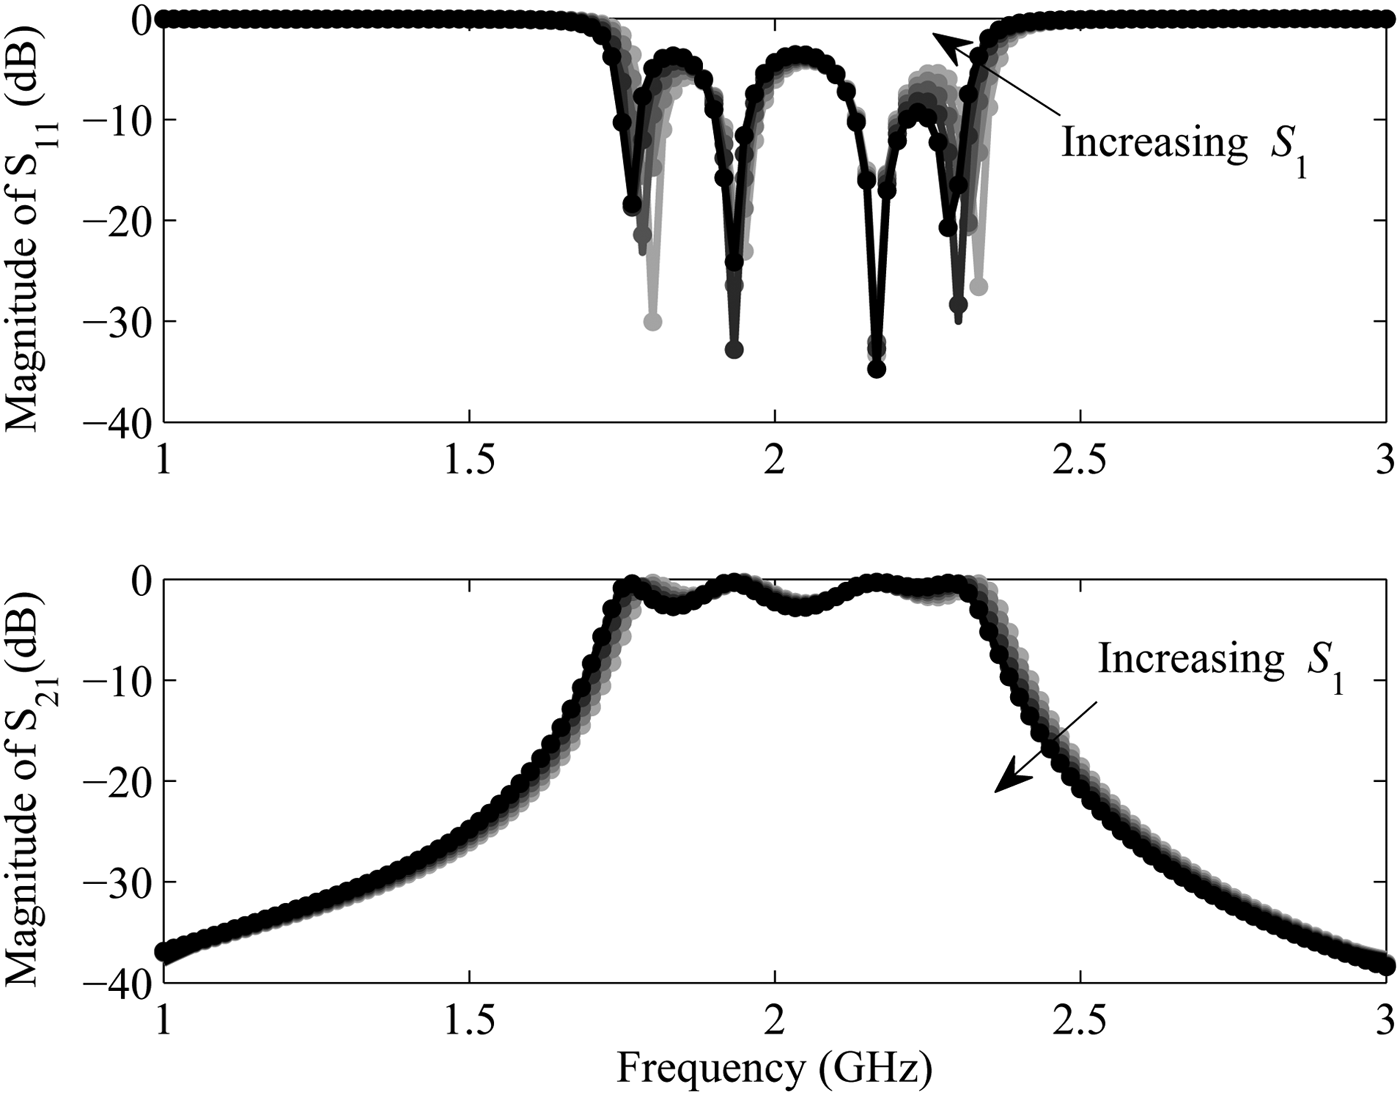
Parametric behavior of some of the S-parameter matrix entries of the filter are shown in Figures 20, 21 and 22 with respect to some design variables. In Figure 20, the magnitude of S 11 and the S 21 of the filter are shown for five different values of L 1 keeping the other variables constant at their mid values of range. Similar plot can be observed in Figs. 21 and 22 for the parameters L 2 and S 1, respectively. The dotted curves in Figs. 20, 21, and 22 represent the response of the scalable macromodel obtained from the proposed method. As seen a good agreement can be observed. For this example, first a scalable macromodeling is performed using the proposed and the grid method generating two different macromodels and then as a next step, a global optimization is performed on these two macromodels generated. Finally, the modeling part as well as the optimization part for the two sequential sampling algorithms are compared in terms of important parameters.
Example III: Magnitude of S 11 and S 21 as a function of L 1.

Example III: Magnitude of S 11 and S 21 as a function of L 2.

Example III: Magnitude of S 11 and S 21 as a function of S 1.

1) MACROMODELING OF THE RING RESONATOR FILTER
As in Examples I and II, the proposed algorithm and the grid method [Reference Chemmangat, Ferranti, Dhaene and Knockaert14] have been implemented in Matlab R2012a and used to drive the ADS Momentum simulations to generate S-responses at selected samples. As in the previous examples, the proposed algorithm is compared with the grid method on 250 verification points spread across the design space using a Latin hypercube space filling. The MEA measure (6) was used to estimate the modeling accuracy.
So, as in the case of Examples I and II, the following can be observed from the table:
-
(1) considerable reduction in the number of samples and consequently in overall complexity for the proposed scheme over the grid method,
-
(2) computational complexity of the scalable macromodel generated using the grid method is higher than the proposed scheme as explained in Section III in Table 1, and finally
-
(3) Comparable accuracy for the proposed method and the grid method is observed.
2) OPTIMIZATION OF THE RING RESONATOR FILTER
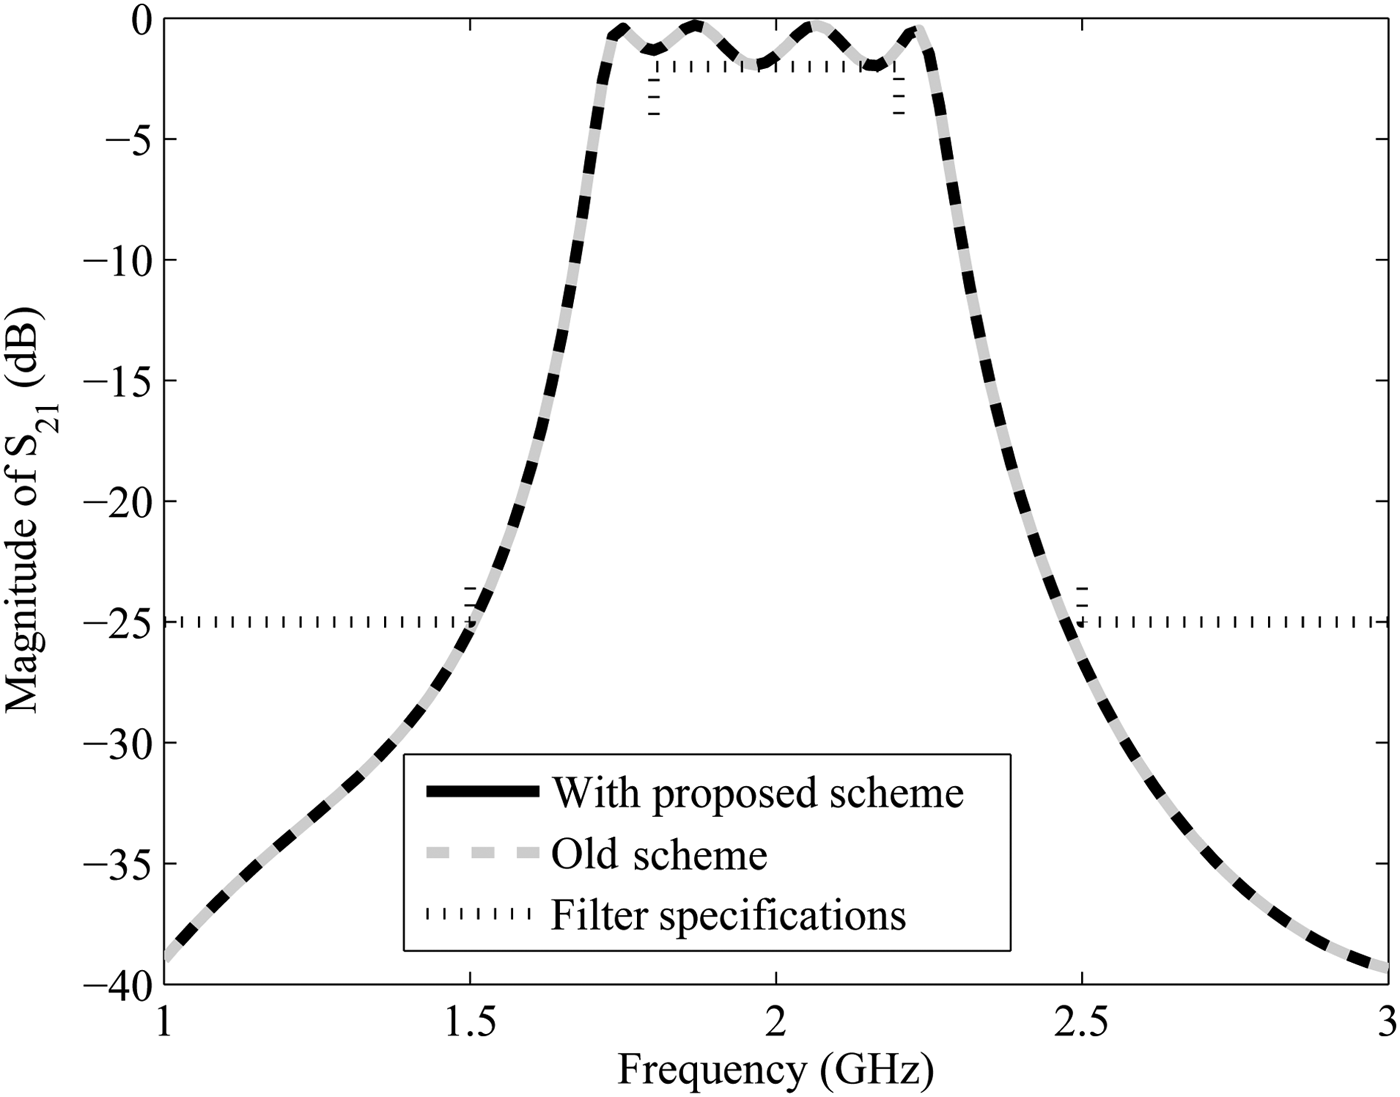
The two scalable macromodels generated using the grid method and the proposed method were used in a design optimization scenario. The design specifications of the filter are given in terms of the scattering parameters S 21:
 $$\vert S_{21} \vert \gt - 2.0 \; {\rm dB}\; \; {\rm for}\; 1.75\; {\rm GHz} \le freq \le 2.25\; {\rm GHz}$$
 $$\vert S_{21} \vert \lt - 25\; {\rm dB}\; \; {\rm for}\; freq \lt 1.5\; {\rm GHz}\; \comma \; \; \, \, freq \gt 2.5\; {\rm GHz}$$
From the design specifications (7), a cost function is formulated in terms of S
21 and frequency. A global optimization method based on the DIviding RECTangle (DIRECT) strategy [Reference Sergeyev and Kvasov23] is used to minimize the cost function. The method [Reference Sergeyev and Kvasov23] balances between a global and local search and finds an optimization solution
 $\vec g^\ast = \lpar L_1^\ast \comma \; L_2^\ast \comma \; L_3^\ast \comma \; S_1^\ast \comma \; S_2^\ast \rpar $
. Since the cost functions are generated with the help of the scalable macromodels generated with the grid method [Reference Chemmangat, Ferranti, Dhaene and Knockaert14] and the proposed sampling scheme, the evaluation time is much less in comparison with the actual ADS simulations.
It can be observed from Table 5 that the average macromodel evaluation time per sample for the grid method is relatively higher in comparison with the proposed scheme. This is indeed because of the increasing complexity of the macromodel generated using the grid-based interpolation in comparison with the scattered interpolation as described before (Table. 4). However, both the macromodels finds a single optimum and is also verified with ADS Momentum simulation and is shown in Figure 23. In the figure the requirements (7) are shown by the dotted lines. The two responses generated by the ADS Momentum at the solutions given in Table 5 are also shown in Fig. 23 which satisfy the requirements.
Example III: ADS Momentum response at the optimal solutions generated with the two macromodels.

Example III: Comparison of different sampling strategies.

Example III: Optimization results.

VII CONCLUSION
A hybrid sequential sampling scheme on scattered grids for automatic construction of scalable macromodels for microwave systems is presented in this paper. The method uses a passivity-preserving scalable macromodeling method along with a sampling based on well-conditioned simplicial refinement strategy to build the scalable macromodels. The method is also compared with previous hyperrectangular sampling method in terms of several important parameters. Three pertinent numerical examples show the modeling capability of the proposed sequential sampling method with less computational resource requirements. One of the example also demonstrates a design optimization scenario using the generated macromodels. These numerical examples show the advantages of using the proposed method in generating accurate scalable macromodels automatically from the EM simulation data, over the design space of interest, with minimum computational resources.
ACKNOWLEDGEMENTS
This work was supported by the Research Foundation Flanders (FWO) and by the Interuniversity Attraction Poles Programme BESTCOM initiated by the Belgian Science Policy Office.
 Krishnan Chemmangat was born in Kerala, India, on December 28, 1984. Krishnan received the Bachelor of Technology (B.Tech) degree in Electrical and Electronics engineering from the University of Calicut, Kerala, India in 2006 and the Master of Technology (M.Tech) degree in Control and Automation from the Indian Institute of Technology Delhi, New Delhi, India in 2008. Since April 2010, he is active as a Ph.D. student in the research group Internet Based Communication Networks and Services (IBCN) at Ghent University. His research interests include parametric macromodeling, sequential sampling, and sensitivity analysis.
 Tom Dhaene was born in Deinze, Belgium, on June 25, 1966. He received the Ph.D. degree in electrotechnical engineering from the University of Ghent, Ghent, Belgium, in 1993. From 1989 to 1993, he was Research Assistant at the University of Ghent, in the Department of Information Technology, where his research focused on different aspects of full-wave electro-magnetic circuit modeling, transient simulation, and time-domain characterization of high-frequency and high-speed interconnections. In 1993, he joined the EDA company Alphabit (now part of Agilent). He was one of the key developers of the planar EM simulator ADS Momentum. Since September 2000, he has been a Professor in the Department of Mathematics and Computer Science at the University of Antwerp, Antwerp, Belgium. Since October 2007, he is a Full Professor in the Department of Information Technology (INTEC) at Ghent University, Ghent, Belgium. As author or co-author, he has contributed to more than 300 peer-reviewed papers and abstracts in international conference proceedings, journals, and books about computational science and engineering, numerical analysis, and computer science. He is the holder of 5 US patents.
 Luc Knockaert received the M. Sc. Degree in physical engineering, the M. Sc. Degree in telecommunications engineering and the Ph. D. Degree in electrical engineering from Ghent University, Belgium, in 1974, 1977, and 1987, respectively. From 1979 to 1984 and from 1988 to 1995, he was working in North–South cooperation and development projects at the Universities of the Democratic Republic of the Congo and Burundi. He is presently affiliated with the Interdisciplinary Institute for BroadBand Technologies, iMinds (www.iMinds.be) and a professor at the Department of Information Technology, Ghent University (www.intec.ugent.be). His current interests are the application of linear algebra and adaptive methods in signal estimation, model order reduction and computational electromagnetics. As author or co-author he has contributed to more than 120 international journal and conference publications. He is a member of MAA, SIAM, and a senior member of IEEE.