Governments routinely issue reports about the quality of public services, an increasingly widespread practice across the domains of education, social services, health care, waste disposal, and environmental quality (Baekgaard and Serritzlew Reference Baekgaard and Serritzlew2015; James Reference James2011; James and John Reference James and John2007). The normative appeal of these policies arises from the idea that individuals best hold governments accountable when they can access accurate information about performance. In requiring public reporting about service quality, governments subsidize access to this information. Research on these policies has largely focused on the question of whether reports on service quality have this effect – that is, whether they shape political attitudes and behavior. We turn from the rudimentary question of whether such reporting matters to an examination of the conditions under which it matters.
We emphasize the importance of policy design in creating conditions that give rise to particular kinds of informational effects. Officials’ choices in the design of policy matter for the kind of effects the policy has on attitudes and behavior (Ingram and Schneider Reference Ingram, Schneider, Ingram and Smith1993). For example, decisions about whether a policy is means-tested versus universal or about bureaucratic responsiveness shape downstream attitudes about policy and government (Hacker, Mettler, and Pinderhughes Reference Hacker, Mettler, Pinderhughes, Jacobs and Skocpol2005). We argue that the specific choices made regarding how to communicate service quality in government reports likewise shape their effects. We root our claim in research on cognitive biases in information processing. These reporting policies vary tremendously in design – specifically in the content and format of reports. Our contention is that policymakers’ decisions about design influence the judgments citizens ultimately make about government performance by exacerbating or mitigating these biases in information processing.
To test this theory, we examine the case of school accountability systems in the United States. Using several methodological approaches, we find that states’ decisions to use letter grade systems to rate public schools (as opposed to other reporting formats) have an asymmetric effect such that attitudes respond more to negative information than to positive information. Furthermore, we show that this asymmetry reflects, in part, a tendency of these policies to exacerbate negativity bias in how people process information.
The analysis highlights the importance of considering policy design when assessing the consequences of reporting policies. In doing so, we go beyond the benign view of these policies as simply information subsidies. Because individuals are prone to biases in information processing, certain formats for government reporting can play to these biases. As such, the direction and scope of these policies’ effects on public opinion depend on how policymakers choose to design them. The results draw attention to the power that governments have, not simply to inform public opinion, but to shape it.
Performance reporting and information processing
From a normative perspective, the connection between individuals’ assessments of government performance and their political response to it fosters accountability only insofar as beliefs reflect actual performance. Citizens must have informed judgments about how well government is performing if they are to hold officials accountable (Iyengar Reference Iyengar1987; James and John Reference James and John2007). Yet, most citizens lack the incentive to seek out information about the quality of services (Downs Reference Downs1957) and lack this sort of policy knowledge (Delli Carpini and Keeter Reference Delli Carpini and Keeter1996). Performance reporting offers a way to provide this information to voters (Van de Walle and Roberts Reference Van de Walle, Roberts, Van Dooren and Van de Walle2011). By disseminating information, these reporting regimes subsidize its cost and may improve the accuracy of evaluations.
To investigate this, scholars often turn to American public education – a policy domain rich in government-issued reports on performance (e.g., Berry and Howell Reference Berry and Howell2007; Chingos, Henderson, and West Reference Chingos, Henderson and West2012; Clinton and Grissom Reference Clinton and Grissom2015; Holbein Reference Holbein2016; Kogan, Lavertu, and Peskowitz Reference Kogan, Lavertu and Peskowitz2016a, Reference Kogan, Lavertu and Peskowitz2016b; Rhodes Reference Rhodes2015).Footnote 1 Yet, despite evidence that beliefs about school performance shape attitudes about education policy (e.g., Moe Reference Moe2001; Peterson, Henderson, and West Reference Peterson, Henderson and West2014), the evidence is mixed about whether the information provided through school accountability policies shifts these beliefs. For example, the kind of information typically reported moves opinions about the quality of local public schooling in Florida (Chingos, Henderson, and West Reference Chingos, Henderson and West2012) but not in Tennessee (Clinton and Grissom Reference Clinton and Grissom2015). Similarly, evidence from North Carolina indicates that school accountability information shapes election outcomes (Holbein Reference Holbein2016), but evidence from South Carolina indicates the effect varies across elections (Berry and Howell Reference Berry and Howell2007). Evidence from Ohio does not show any effect on school board elections (Kogan, Lavertu, and Peskowitz Reference Kogan, Lavertu and Peskowitz2016b) but does show an effect for school tax elections (Kogan, Lavertu, and Peskowitz Reference Kogan, Lavertu and Peskowitz2016a).
We offer a theoretical argument for the heterogeneity of information effects rooted in the relationship between how officials design policies and how people process information. We argue that policymakers’ decisions about how to present information affect how people process it. Specifically, we theorize that formats with more easily recognized valence (i.e., positive versus negative) are prone to asymmetric effects in which negative information is more influential than positive information.
Our argument builds upon two theoretical perspectives. The first concerns the interpretive effects of policy design – that is, how structures of policy shape the inferences drawn about the policy and the government behind it (Ingram and Schneider Reference Ingram, Schneider, Ingram and Smith1993). For example, benefit programs that camouflage the role of government are less likely to produce positive attitudes toward the program among beneficiaries than programs in which the government’s role in providing the benefit is clearer (Hacker, Mettler, and Pinderhughes Reference Hacker, Mettler, Pinderhughes, Jacobs and Skocpol2005). There is little reason to assume that the interpretive effects of performance reporting would be less sensitive to design. Indeed, information about government performance is often ambiguous, leaving it open to multiple interpretations, which can shape how voters use it to evaluate government. Measures of school performance, especially those based on test scores, the meaning and relevance of which are difficult for most individuals to interpret without guidance, are no exception (Hambleton and Slater Reference Hambleton and Slater1995). Unsurprisingly, opinions about school quality vary across states in a manner consistent with differences in the structure of accountability systems (Rhodes Reference Rhodes2015), and experimental evidence shows the effect of hypothetical information varies across formats (Jacobsen, Snyder, and Saultz Reference Jacobsen, Snyder and Saultz2014).
The second theoretical perspective concerns information processing. Individuals rarely process information in an unbiased way. Rather, information processing is fraught with various distortions that lend some kinds of information greater influence. Although these biases are widely recognized in research on political psychology and behavior generally, political science research on the effects of reporting policies has largely neglected them.Footnote 2
Negativity bias is one form of biased cognition that yields asymmetric effects. The pattern, common in psychological studies, reveals individuals assign more weight to negative information than to positive information (see Kanouse and Hanson Reference Kanouse, Hanson, Jones, Kanouse, Kelley, Nisbett, Valins and Weiner1972 for a review). Similarly, individuals are more responsive to negative information when evaluating the economy, the president, candidates for office, or the government as a whole (Fridkin and Kenney Reference Fridkin and Kenney2004; Kernell Reference Kernell1977; Lau Reference Lau1985; Niven Reference Niven2000; Soroka Reference Soroka2006).
The expectation disconfirmation model (EDM) describes another bias in which cognition privileges unexpected information. People update their evaluations in accordance with new information only when it contrasts with prior belief (Hjortskov Reference Hjortskov2019).Footnote 3 For example, if a government report provides negative information about service quality, then people would view the service more negatively if they previously held a relatively positive view. Similarly, people’s assessments would improve if the report offered positive information when people expect negative information. Although the EDM allows for both positive and negative shifts, it would nevertheless yield asymmetric effects when prior beliefs tend to the opposite valence of new information – and asymmetrically negative effects when these prior positive assessments confront less rosy reports.
Implicit in both negativity bias and the EDM is the idea that recipients are able to identify the valence of information. Indeed, individuals are more prone to negativity bias when they are more familiar with the format of the information (Kanouse and Hanson Reference Kanouse, Hanson, Jones, Kanouse, Kelley, Nisbett, Valins and Weiner1972). This is akin to the concept of accessibility, the tendency to attach weight to concepts or considerations that are recognizable (Iyengar Reference Iyengar, Ferejohn and Kuklinski1990). Individuals are better at recognizing the valence of signals and, thus, more prone to biases that privilege information by valence, when they are familiar with features that characterize valence.
For public sector performance reporting, this means designs in which the valence of a signal is more accessible are more prone to invoke biases in response. Policymakers, then, do not simply inform when launching informational policies; rather, decisions about the format of information shape public opinion through the interaction between design and cognition. When evaluating the information effects of reports, the key question is not whether they have a general effect but rather how does the presence and type of effect depend on the design of the policy.
Design of school accountability systems and accessibility of negative information
The advantages of school accountability for studying the effects of policy design are that performance reporting is both ubiquitous and varied across states. The 2001 No Child Left Behind (NCLB) Act required all states to implement accountability systems in order to receive federal funding. Specifically, NCLB required that states annually assess the performance of public school students and release aggregate test results for schools and districts to the public. However, NCLB left considerable flexibility to states to set academic standards, to choose test instruments, to generate composite measures of school and district performance, and to determine how to report these measures to the public (Rhodes Reference Rhodes2012). The 2015 Every Student Succeed Act largely renewed these aspects.
As a result, states vary in how they report the performance of public schools and districts. Most states use an ordinal rating scale to describe the overall quality of a school or district, often based on how well students score on state standardized tests. For example, California rated schools on a ten-point scale, while Texas initially used a four point scale with the labels “unacceptable,” “acceptable,” “recognized,” and “exemplary.” Twenty states adopted systems that assign an A–F grade to schools and/or districts – the same scale commonly used to grade students.Footnote 4 Florida was the first state to adopt a letter grade system in 1999. Fifteen states followed between 2010 and 2013, and four others have done so since.Footnote 5 Supporters of letter grade systems often invoke accessibility as justification for use even as critics argue these grades oversimplify and, therefore, misrepresent school performance. For example, Jeb Bush, the Republican governor of Florida, argued: “They should not have to struggle through confusing mazes of charts and spreadsheets to find out if their children are in a good learning environment. To get there, we begin with a simple, comprehensive, actionable score that captures the overall success of a school in advancing academic achievement. The most intuitive approach for parents is grading schools on an A–F scale” (Bush, Hough, and Kirst Reference Bush, Hough and Kirst2017).Footnote 6 When Louisiana issued its first letter grades in 2011, the state Department of Education argued the switch would, “provide communities and families with a clear and meaningful depiction of school performance.”Footnote 7 South Carolina’s Department of Education described the system as “simple and easy to understand” when first adopting its use there.Footnote 8 In West Virginia, a Democratic governor urging adoption of letter grades argued, “This is a transparent education accountability system that rates student progress and performance in every West Virginia school using language that parents and the community can understand.”Footnote 9 When Michigan lawmakers repealed their letter grade system, defenders described letter grades as “easily understandable measures of school quality” (Thiel Reference Thiel2023). Organizations advocating for letter grade systems continue to argue, “Parents understand A-F grades” (Gergens Reference Gergens2024).
We argue that accessibility has consequences for how people process information. Public familiarity with the structure and connotation of a letter grade leaves individuals more susceptible to negative information because they more easily attach valence and the significance of that valence to an F grade than they might to similar information conveyed through another rating format. Consequently, there will be an asymmetric impact of this information whereby lower grades have a stronger effect on beliefs about the quality of schools than higher grades.
Identifying effects of policy design
Evidence in support of our argument that policy design can yield asymmetric effects on evaluations of quality must go beyond simply demonstrating that individuals exposed to information about public schools evaluate them more negatively. There are three additional challenges not yet addressed in extant research. First, demonstrating an asymmetric effect requires evidence that the effect of a negative signal is stronger than the effect of a positive signal. Evidence for an overall negative effect of exposure to information on opinions is insufficient because such an average effect could result from a skew in the supply of valence even with unbiased processing, for example, if there are far more F-rated schools or districts than A-rated schools or districts. Our argument is about the interplay between policy design and information processing – an effect that goes beyond the content of the information itself. Evidence in support of our theoretical argument requires demonstrating the effect is due to processing rather than supply. Second, identifying the effect of policy design requires demonstrating that differences between those exposed to letter grades and those not exposed to letter grades are not just a general effect of exposure to any information. The appropriate counterfactual is not “no information” but equivalent information presented under alternate policy designs. Finally, to identify whether asymmetries arise from negativity bias or expectation disconfirmation, we need to demonstrate that negative shifts occur even when reported information does not contradict prior beliefs.
To address these challenges, we use multiple studies each with advantages and limitations. We begin with a survey experiment to test the effect of letter grade ratings in a realistic format in one state. Next, in the same state, we use a difference-in-difference approach with pooled-cross-section surveys collected over several years straddling the transition to a letter grade system to examine how evaluations differ for individuals who live in comparably performing school districts when the state changed from an alternate rating system. Then, using national surveys pooled across time in conjunction with district-level test score data scaled for comparisons across states, we compare individuals exposed to letter grades to individuals exposed to alternate systems who live in school districts with similar average test scores. Finally, we turn to panel data collected within those national surveys to examine individual-level change in evaluations of public schools when states adopt letter grade reporting systems. The panel data also allow us to test for negativity bias versus the EDM by conditioning individual-level shifts on prior beliefs about school quality.
Study 1: analysis of a survey experiment
We begin with analysis of experimental and observational studies conducted in Louisiana. Louisiana is a useful case for examining the effects of letter grade systems with a survey experiment because, with the exception of five city-based districts, public school districts in Louisiana are county-based,Footnote 10 which facilitates linking respondents to actual district-level school accountability information for the purpose of randomizing exposure within the survey. The ability to incorporate performance information directly into survey experiments allows us to identify effects on a key attitudinal outcome: individuals’ evaluations of schools. Using actual performance data tailored to the survey participant’s local school district provides a more direct test of information about local public schools in the actual form the state provides it on these evaluations than prior survey-based experiments that rely on state-level performance information (e.g., Clinton and Grissom Reference Clinton and Grissom2015), hypothetical schools (e.g., Jacobsen, Snyder, and Saultz Reference Jacobsen, Snyder and Saultz2014), or stylized presentation formats not used in practice (e.g., Barrows et al. Reference Barrows, Henderson, Peterson and West2016).
To identify the effect of a letter grade system, we embed an experiment in a telephone survey of adult state residents.Footnote 11 We ask participants for their county of residence and, for participants living in one of the three counties that also contain the five city-based school districts, their city of residence. This geographic information identifies in which of the state’s 69 public school districts a participant resides. Participants are randomly assigned to one of the two conditions. In one condition, we expose participants to the state’s letter grade rating of their local school district. Specifically, participants are told, “As you may know, each year the Louisiana Department of Education grades each local public school district in the state. The state of Louisiana assigned a letter grade of [insert participant’s school district’s grade] to your school district.”Footnote 12 The treatment information used the most recent district letter grade available at the time. Among participants in the treatment condition, 14.4% were informed the state issued their district an A grade, 44.4% were informed the state issued their district a B grade, 38.4% were informed the state issued their district a C grade, and 2.9% were informed the state issued their district a D grade. The state rated no districts as F for the 2014–2015 academic year.Footnote 13 Immediately after exposure to this information, participants are asked, “What grade would you give to the public schools in your local community?”Footnote 14 In the other condition, participants are simply asked the evaluation question without first being told the state’s rating of their district.
Importantly, because they received the actual district grade issued by the state, individuals in the treatment condition did not all receive the same information. Therefore, an average treatment effect of exposure to grades across the grades actually provided cannot demonstrate asymmetry in processing because the direction of the effect may reflect the direction of the information provided. We break out the results of the experiment by the value of the grade issued to participants’ district. Some live in an A-district, but most (85.6%) live in a district with a lower grade. Even unbiased processing would yield fewer A grade evaluations when the balance of the information supply tilts to lower grades. On the other hand, unbiased processing should also reduce the share of individuals who grade the quality of their local public schools with a D or F grade because most individuals in the treatment condition (97.1%) were exposed to district grades higher than a D. In short, with this distribution of actual district grades, unbiased processing should pull individuals’ evaluations toward B and C, but that is not what we find.
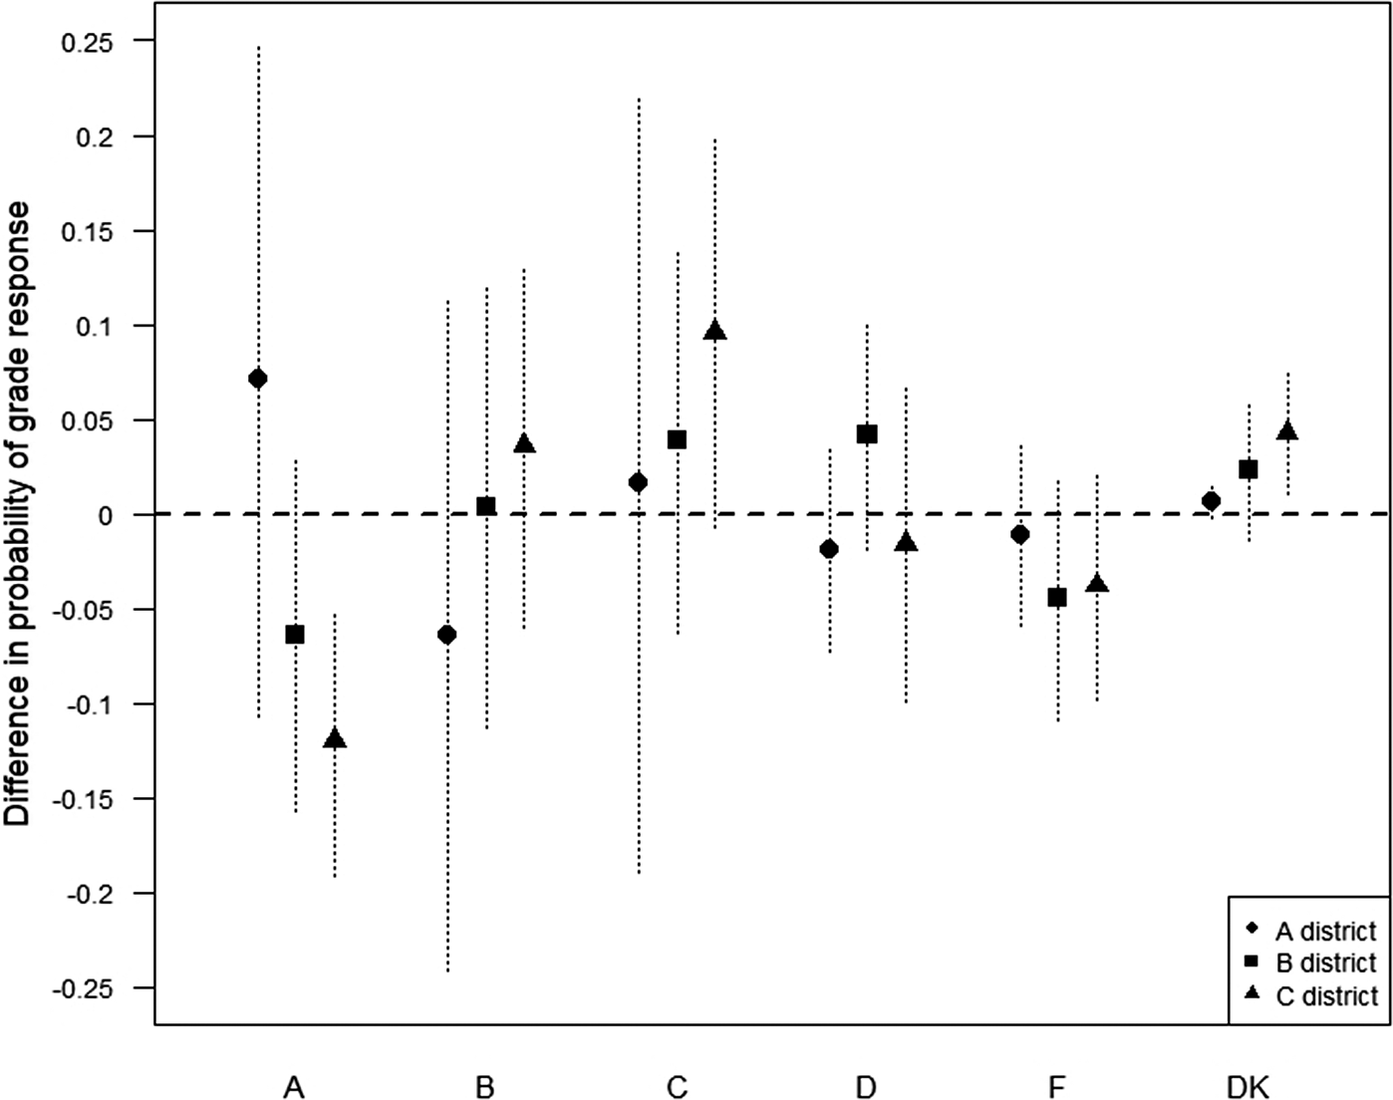
Instead, we find asymmetry – that is, greater responsiveness to negative than positive information. We test for asymmetry by conditioning treatment effects on the actual state-issued grades of districts in which participants reside. We separately test among individuals who live in districts graded as A, districts graded as B, and districts graded as C.Footnote 15 This approach allows us to identify the effect of exposure to a particular letter grade rather than the effect of exposure to any letter grade. More importantly, it allows us to distinguish between the effects of exposure to a district grade of A (positive signal) and exposure to a district grade of C (relatively negative signal).Footnote 16 These results appear in Figure 1, which shows the treatment effect of providing individuals with the letter grade their school district actually received on their own evaluations of the quality of local public schools broken out by the value of the letter grade they received. Specifically, the figure displays the effect of exposure to the district’s letter grade on the probability that a participant grades the quality of her local public schools as A, B, C, D, or F, as well as the probability she voluntarily indicates she is unsure (an option not explicitly read to participants). These response options appear on the horizontal axis.Footnote 17 There is no evidence that an A grade improves evaluations of local public schools. While the estimates of the effect of exposure to a district grade of A on the probability individuals evaluate their local schools with an A or B are noisy, of critical importance is the more precise evidence that a district grade of A has no effect on the likelihood of evaluating local schools with a D or F. In short, telling someone that she lives in a district the state grades with an A does not make her any less likely to evaluate her local schools with a grade of D or F. However, there is evidence that the more negative signal of a C grade does affect evaluations. Exposure to a district grade of C decreases the probability of evaluating local public schools with an A without also reducing the probability of evaluating schools without a D or F.Footnote 18 In short, participants do not respond to positive information but do respond to negative information.Footnote 19
Effect of exposure to state-issued district letter grade on respondents’ own letter grade evaluations of local public schools, by state-issued grade. Note: Horizontal axis displays the response options for participants to grade the quality of public schools in their local community. Points mark the difference in the probability of each response by exposure to the grade the state issued to participants’ local school districts by residence in districts with various state-issued grades. Dashed lines represent 95% confidence intervals. Full model results are available in Supplementary Table A2.

Study 2: analysis of a series of state surveys
Whereas our first study demonstrates asymmetric effects of letter grades, we now examine the role of policy design in these effects. That is, do these asymmetric effects occur in other reporting systems that do not use letter grades? We turn to an observational analysis of survey data collected under two different information formats, also in Louisiana. The shift between formats is a second advantage of using Louisiana to study the effects of letter grades because this shift occurred amid a series of annual statewide surveys. In the current system, Louisiana assigns a letter grade to school districts based on its District Performance Score (DPS).Footnote 20 From the 2002 to 2003 academic year through the 2009 to 2010 academic year, however, the state used an alternate rating system for districts. In that period, a district’s DPS determined its rating on a six-point scale: Academic Warning/Academically Unacceptable; One Star; Two Stars; Three Stars; Four Stars; or Five Stars.Footnote 21 The annual survey data permit a within-state analysis of opinion under alternate reporting systems, which is more advantageous for identifying the effects of the letter grade system than comparing different states because states may vary on unobserved dimensions that correlate both with selection of a letter grade system and public opinion about school quality.
In this section, we report the results of an analysis of survey data collected under the current letter grade system and under the earlier system that assigned star ratings. The data are from an annual telephone survey administered to samples of adult Louisiana residents since 2003. On seven occasions during this period, the survey asked participants to evaluate the quality of their local public schools using the question described above: 2004, 2007, 2008, and 2014 through 2017.Footnote 22 The first three occurred during the period when the state used a six-point rating system to evaluate school districts from “academically unacceptable” to “five stars.” The latter four surveys occurred during the letter grade system. Unlike the survey experiments, our second approach to examining letter grade systems lacks random assignment of exposure to ratings. Nevertheless, this analysis has the advantage of comparing opinion between two rating systems that Louisiana actually used.
Across these two periods, the valence of the information shifted in a positive direction. In the star-rating era, several districts were rated as “academically unacceptable,” but none were rated at the highest two levels. In contrast, during the letter grade era, very few districts received F grades and many received A grades. Again, identifying asymmetric effects requires examining differences in responsiveness to negative information versus positive information. We pool participants across the surveys and model mean response as a function of an indicator for the years during which the state used a letter grade system, the percent of fourth- and eighth-grade students in participants’ districts who scored at grade level on the state’s standardized reading and mathematics tests in the academic year preceding the survey, and the interaction of these two variables. Additionally, we include school district fixed effects.Footnote 23 This approach compares individuals whose districts had similar test scores, which largely drove rating assignment under both systems, but who saw those scores presented in different formats.
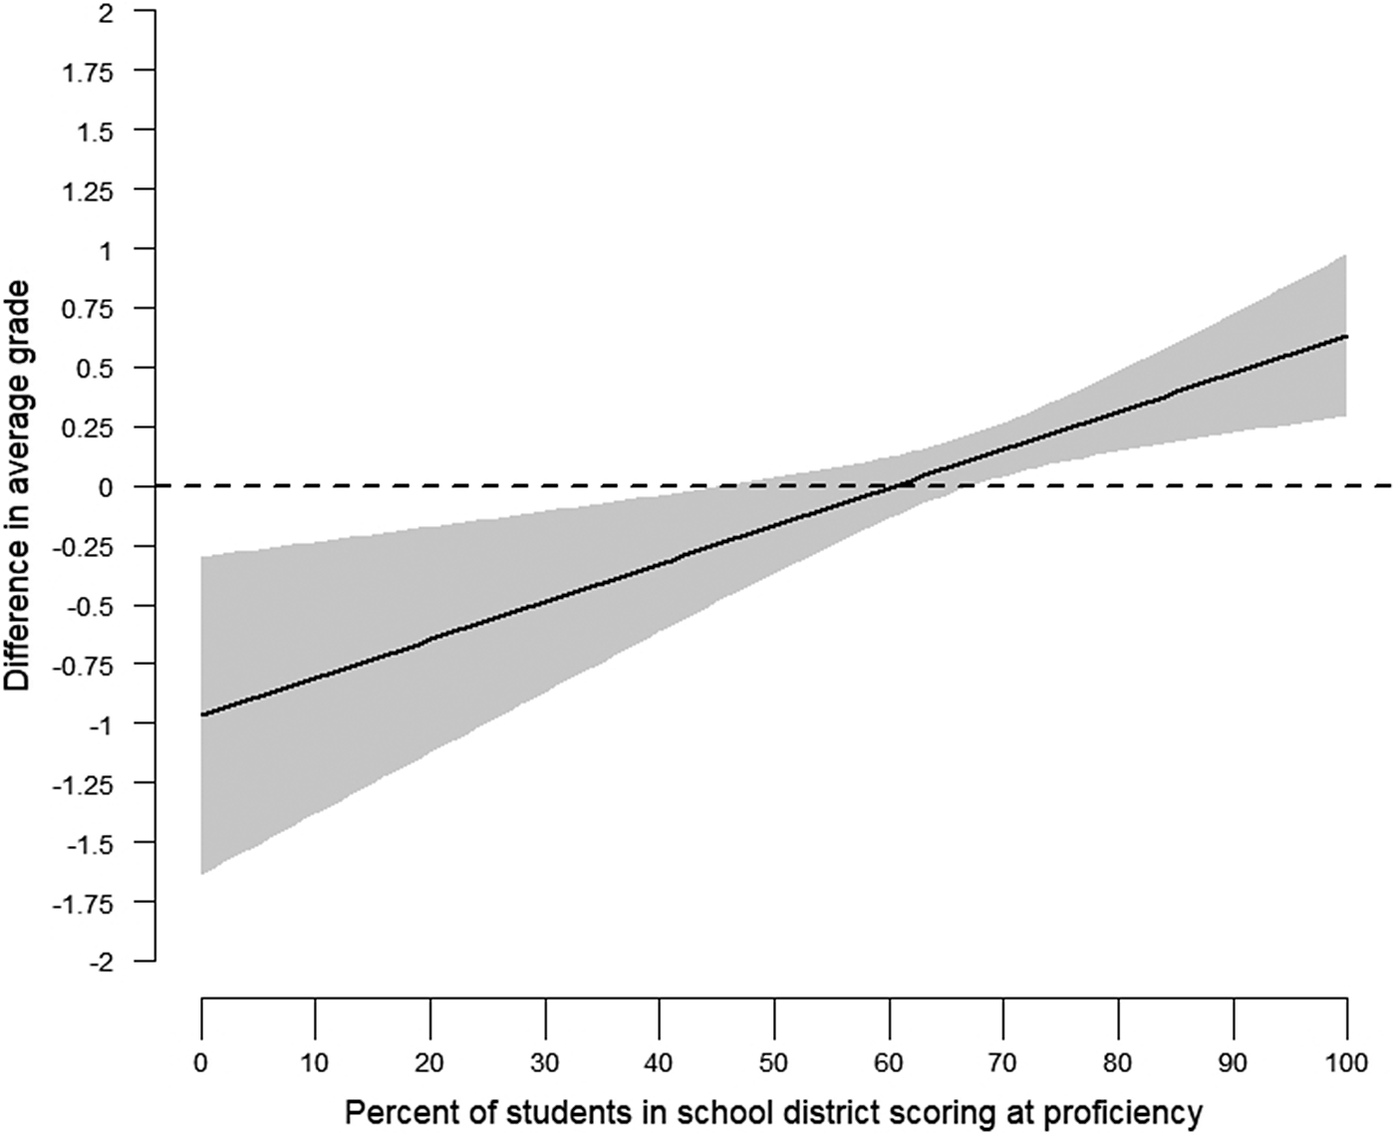
Figure 2 displays the difference in average ratings between the letter grade system period and the star rating period across the values of the percent of students testing at grade level. If the two rating systems do not lead to different interpretations of school quality, the line should be flat. Instead, there is a sharply positive slope, indicating people process the same underlying data (i.e., the percent of students scoring at grade level) differently between the two rating regimes. Districts with larger shares of students performing at grade level are evaluated more positively in the letter grade system than the star rating system, and districts with smaller shares of students performing at grade level are judged more harshly. Importantly, there is an asymmetry in these differences – the gap is larger for districts with lower test scores than for districts with higher test scores. In other words, individuals penalize schools with lower test scores more than they reward schools with higher test scores when provided a letter grade rather than a star rating. For example, among residents of school districts where approximately 40% of students score at grade level across both periods, resulting in an “academically unacceptable” rating under the earlier period but a D grade in the later period, the estimated difference in mean evaluations on the five-point response scale to the survey item is −0.41 (34.5% of a standard deviation). For residents of school districts where 75% of students scored at grade level, which generally earned a rating of three stars under the earlier system but an A grade under the later system, the estimated difference in opinion is +0.23 (19.3% of a standard deviation). Together, the experimental and observational studies from Louisiana demonstrate that asymmetric effects, whereby negative signals have a stronger effect than positive signals, are not automatic or ubiquitous; rather, they depend upon how states choose to present information about school district performance.
Difference in average opinions of local school quality between letter grade era and star-rating era, by percent of students in school district scoring at grade level proficiency. Note: Solid line represents the difference in the average evaluation of local public schools on a scale of 1 (F) to 5 (A) between participants during the star-rating era and participants during the letter grade era. The difference is displayed by the percent of students in the participant’s local school district who scored at grade level or above on standardized exams. Shaded area represents 95% confidence intervals. Full model results are available in Supplementary Table A6.

Study 3: analysis of national cross sections
Next, we turn to national survey data to examine whether perceptions of schools vary between accountability systems when comparing across states that use letter grades for schools or do not use grades. We use the series of Education Next surveys conducted annually since 2007.Footnote 24 The survey has asked respondents to evaluate the quality of local schools annually, with the exception of 2009 and 2010, with the same question analyzed in the previous sections of this article.Footnote 25 Annual samples frequently reach more than 4,000 participants, which we pool to estimate differences across states with different accountability policies. Of course, states differ in many ways that are related to how residents evaluate public schools, such as the academic performance of students or the political culture of the state, which may also relate to the decision to adopt letter grade systems. For instance, 14 of the 20 states that adopted letter grade systems did so under unified Republican control of state government (i.e., holding the governor’s office and majorities in both legislative chambers). Three more states adopted letter grades under Republican governors with Democratic-controlled legislatures. Only three states adopted letter grades under a Democratic governor, including just one that did so under unified Democratic control of state government.Footnote 26 We take two approaches to account for these differences. First, to account for characteristics that may correlate with the likelihood a state adopts a letter grade system, we limit our sample to only respondents who live in states that eventually adopted a letter grade system. Because we have multiple surveys over time, we can compare responses in states that have implemented a letter grade system to responses in states that would ultimately adopt a letter grade system but had not done so at the time the of the survey in which the responses appear. Second, we condition responses on a measure of student test scores in respondents’ school districts. This approach requires a common metric for scores across school districts. We use the Stanford Education Data Archive (SEDA) of the Center for Education Policy Analysis at Stanford University (Reardon et al. Reference Reardon, Ho, Shear, Fahle, Kalogrides and DiSalvo2017). SEDA includes a measure of district-level scores that adjusts state test results to NAEP test results, essentially providing average NAEP score for each district. For nine years of the Education Next survey, SEDA data are available in the academic years immediately preceding the survey: 2011 through 2019.
We model responses to the school quality question as a function of an indicator for whether the participant’s state used letter grade ratings for the academic year immediately preceding the survey year while controlling for test scores.Footnote 27 This approach amounts to comparing participants’ evaluations of their local schools in states with letter grade systems to participants’ evaluations in states without a letter grade system (but would eventually adopt one) and who also live in districts with the same level of student performance on standardized tests. During this period, states emphasized the levels of scores on standardized tests (e.g., average score or percent of students who achieved a certain score) in determining what rating a school or district received in the accountability system. Because of this emphasis, our approach amounts to comparing respondents whose state accountability systems take a similar “input” from the respondents’ local schools (i.e., similar test scores) but “output” the rating in different formats (i.e., a letter grade versus something else).Footnote 28 In a sense, the underlying information these two individuals receive is similar, but the package – a letter grade versus something else – is different.
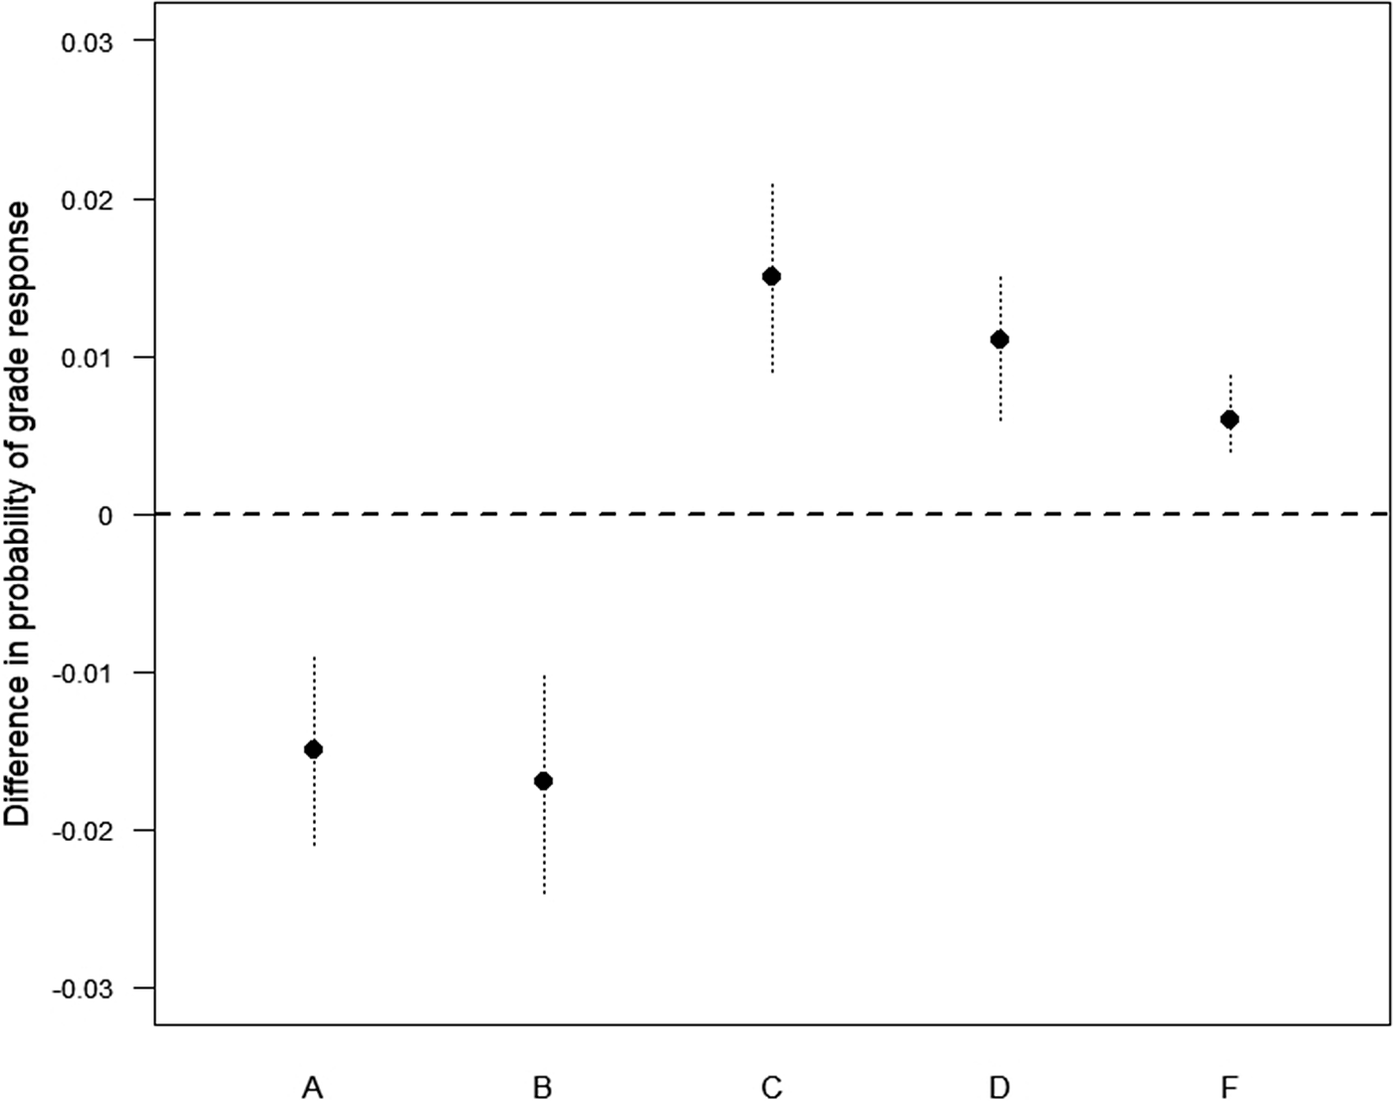
Results appear in Figure 3. Individuals in states with letter grade rating systems have worse opinions of their local public schools than individuals in other states. These individuals are less likely to think of their local public schools as deserving of an A or B, and more likely to think they merit a lower grade.Footnote 29
Differences in public evaluations of local schools between individuals in states with letter grade systems and individuals in states with other systems. Note: Horizontal axis displays the response options for participants to grade the quality of public schools in their local community. Points mark the difference in the probability of each response between individuals living in states with letter grade rating systems and individuals living in states with other systems. Dashed lines represent 95% confidence intervals. Full model results are available in Supplementary Table A7.

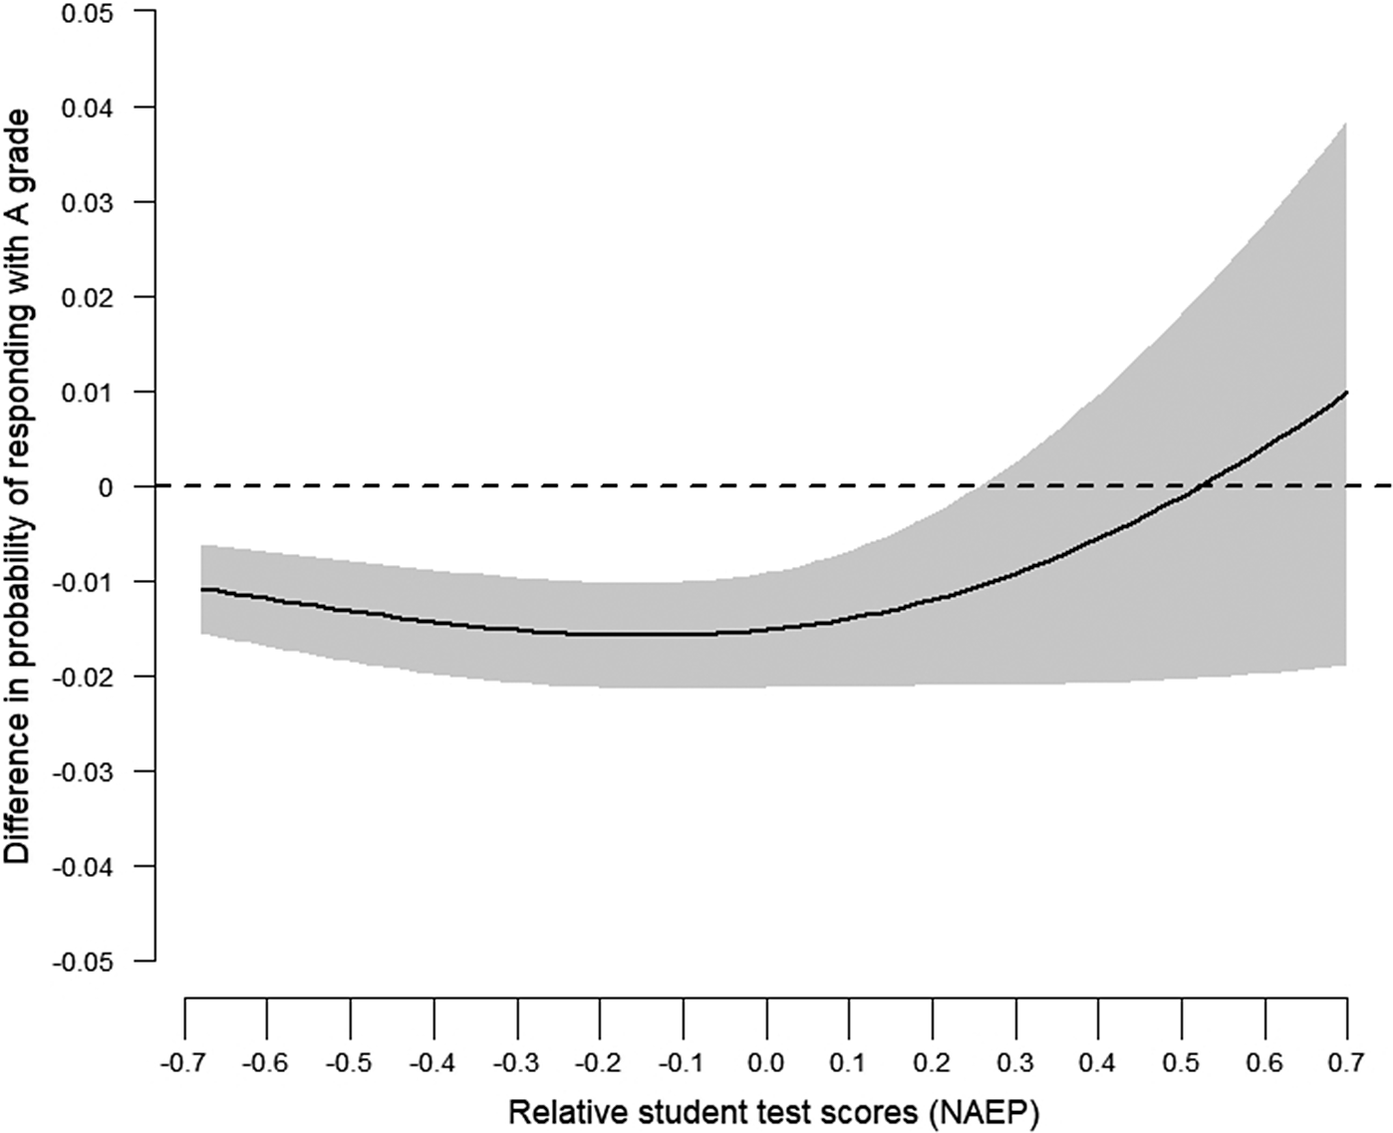
Additionally, in Figure 4, we plot the difference in the probability that individuals grade their local public schools with an A between those in states with and without letter grade rating systems by the average relative NAEP score in their local public school district. Once again, the results demonstrate mostly negative shifts in evaluations. Individuals living in states with letter grade systems rate their local schools worse than individuals in states without these systems but who live in districts with comparable test scores; this pattern holds for respondents up through the eightieth percentile of district-level NAEP scores in the sample. Only in the 81st percentile of scores do estimates become too noisy to distinguish from the null; and the point estimate for the difference does not reach zero until respondents are in the 96th percentile of scores.
Difference in probability of grading local schools as A, between individuals in states with letter grade systems and individuals in states with other systems by mean NAEP score in district. Note: Solid curves represent the difference in the probability that participants rate public schools in their local community with a grade of A between individuals living in states with letter grade rating systems and individuals living in states with other systems, by relative NAEP score in the local school district (i.e., how the district compares to districts across the country). Shaded area represents 95% confidence intervals. Full model results are available in Supplementary Table A7.

Study 4: analysis of national panel data
From 2013 through 2018, the Education Next surveys included a subset of individuals from the previous year’s sample producing a panel of participants observed on multiple occasions across years. The panel sample allows us to estimate models of opinion with individual-level fixed effects to control for all unobserved time-invariant characteristics. The approach requires use of a linear model to estimate average response on the five-point scale from F to A rather than the ordinal approach used above (Angrist and Pischke Reference Angrist and Pischke2009). In all, we analyze responses of 1,776 participants interviewed at least twice from 2013 to 2018.Footnote 30 This approach estimates within-individual change in opinion when a respondent’s state transitions from a non-letter grade system to a letter grade system.Footnote 31 The results in the first column of Table 1 indicate respondents’ evaluations of their local public schools sour by about −0.10 (on a five-point scale) when their state switches to letter grades.
Fixed effects model of letter grade rating system effect on evaluations of public schools

Note: Estimates from OLS model of evaluations of public schools on scale from 1 (F) to 5 (A) including individual-level fixed effects. Baseline year is 2013. In 2013 and 2014, surveys included experiments in which randomly selected participants were exposed to information comparing test scores in their school district to other areas. “Exposure to information” is an indicator for assignment to one of these conditions in those two years of the survey. Standard errors in brackets.
*** p < 0.01.
** p < 0.05.
* p < 0.1.
The evidence presented so far indicates people rate schools lower when those schools receive letter grades, but this evidence is consistent with two different ways people may process school accountability information. One possibility is negativity bias – that is, that people respond to negative information more so than positive information and letter grade formats make it easier for people to identify negative signals. Another possibility is the EDM – that is, that people respond to information that contradicts their prior beliefs and letter grade formats make it easier for people to identify positive and negative signals. Because Americans tend to rate their local schools relatively positively, the negative effects of letter grades may simply reflect the distribution of these prior beliefs (relatively positive compared to the information received in the letter grade). In either case, letter grade systems would enhance a form of information processing that yields asymmetric negative effects on beliefs about school quality.
Nevertheless, it is worthwhile to attempt to disentangle these explanations. To do so, we consider additional expectations of the EDM that would not manifest if negativity bias alone was at work: (1) people would be just as responsive to positive grades if they had lower prior beliefs about their local schools’ quality; and (2) people would not respond to information consistent with their prior beliefs about quality. To test these, we leverage another feature of the panel data – respondents’ responses to the previous year’s survey. We collected the actual letter grade assigned to each district in each state that issued letter grades from 2013 through 2018.Footnote 32 We compared those grades to the respondents’ own evaluation of their local school from the prior year and sorted them into three groups: Respondents whose local schools received a grade below their own prior perception (a negative signal), respondents whose local schools received the same grade as their own prior perception (an equivalent signal), and respondents whose local schools received a grade above their own prior perception (a positive signal).Footnote 33 If the EDM holds, we should see a negative effect of the negative signal, a positive effect of the positive signal, and no effect for the equivalent signal. If negativity bias is at work, we should see negative effects even among those who did not receive a negative signal.
We test this by replicating our fixed effects model but replacing the indicator for a letter grade system with three indicators for the signal type. Again, because this model includes individual fixed effects, we are estimating individual-level change in perceptions as someone goes from not having a letter grade system to receiving one of these three signals. The results appear in the final column of Table 1. Unsurprisingly, negative signals produce a negative shift in perceptions of quality. The results also reveal evidence both for the EDM and for negativity bias, suggesting both processes may be at work. Letter grades that are higher than respondents’ prior beliefs about school quality are associated with a positive shift in beliefs about quality, consistent with the claim that people respond to information that disconfirms expectations. However, there is also a negative shift in opinions even for people who receive a grade equivalent to their prior beliefs. This latter result is consistent with negativity bias and inconsistent with expectation disconfirmation. It appears that merely packaging the signal in the form of a letter grade exerts a negative influence on perceptions of quality. These results are not entirely definitive and should not be interpreted to mean that the EDM fails to apply at all. Nevertheless, the results do indicate that EDM does not on its own account for the negative shifts in perceptions of quality.
Discussion
Many Americans take a dim view of government, generally believing it to perform poorly. Although there is substantial evidence that the actual quality of public services shapes beliefs about government performance in specific sectors, there is compelling evidence that underlying partisan identities and ideological orientations bias people’s beliefs about government performance (Holbrook & Weinschenk Reference Holbrook and Weinschenck2020; Lerman Reference Lerman2019). The former evidence – that people evaluate government in accordance with how well it actually performs – is a boon for theories of democratic accountability. The latter evidence – that people have built in inclinations to view government negatively independent of actual performance – challenges those theories. We contribute to this discussion by highlighting another factor beyond actual government performance and individuals’ political predispositions – how governments describe their performance.
Our evidence indicates that letter grade systems have asymmetric effects, souring opinions of public schools relative to alternative systems. That is, using evidence from one state, we demonstrate a stronger impact of negative information than positive information under letter grade systems than under alternate presentation formats. Then, we generalize this effect across the United States by providing evidence that individuals in states with letter grade systems evaluate their local public schools more poorly, even after controlling for test scores and unobserved characteristics of individuals and states. Finally, we show that the negative effects are not confined only to those people whose local schools receive a grade worse than what they had thought – casting doubt on the EDM as an explanation for this pattern and indicating negativity bias.
To be clear, we do not claim that letter grade systems are the only means of invoking biases in people’s judgments about public services. Nor, do we claim that this evidence indicates policymakers necessarily choose these systems for this reason. Nevertheless, the case of letter grade systems demonstrates the importance of decisions about policy design for the political consequences of information policies on opinion. Indeed, even as several states abandoned letter grades in recent years they are replacing them with other formats for public reporting on school quality. How might these new designs interact witch cognitive processes to push opinions in one direction or another? There is no reason to think these findings are exclusive to letter grades or even to education.
The findings have two important implications for the study and practice of democracy. First, these results demonstrate that scholars should attend to features of policy design when assessing the impact of performance reporting. Prior empirical analysis of the effects of these policies has focused on a simplistic question: Do these policies influence knowledge, opinion, and behavior? Scholarship on these policies must go further to consider not only whether these policies matter but also the conditions under which they yield different effects – especially conditions of policy design.
Second, the results speak to the role of these policies in democratic practice. A naïve view holds that these policies have a benign effect, simply filling in gaps in knowledge so voters can make informed decisions. Our evidence indicates that these policies do not simply provide information; rather, they provide packaged information. People tend to process information with cognitive biases, and how information is presented can exacerbate these tendencies. Our evidence does not indicate that the evaluations people make of public schools under letter grade systems are any more correct or incorrect than those made under other systems, but the fact that opinions vary by policy design does indicate that policymakers have the power to shape opinions. Information provided by these policies is never just information; it is information designed and presented in a certain way.
Through their decisions about how to design informational policies, policymakers have the power not simply to inform public opinion but to steer it, and the political consequences can be quite widespread. Evaluations for public sector performance are related to confidence in government action (Wichowsky and Moynihan Reference Wichowsky and Moynihan2008), support for continued spending on programs (Peterson, Henderson, and West Reference Peterson, Henderson and West2014), and, in the case of public schools, attitudes toward policy interventions to overhaul the system through market-based initiatives (Moe Reference Moe2001). Measuring policy performance is a complicated matter fraught with decision points that can steer voters’ inferences about government performance. Our research suggests that the process is even more complicated. Accurately measuring government performance is not enough. The process of communicating information about performance plays a critical role in democratic accountability.
Supplementary material
The supplementary material for this article can be found at http://doi.org/10.1017/spq.2024.19.
Data availability statement
Replication materials are available on SPPQ Dataverse at https://doi.org/10.15139/S3/NLDIQK (Henderson and Davis Reference Henderson and Davis2024).
Acknowledgments
The authors thank Marty West, Matt Chingos, Charles Barrilleaux as well as participants in the Louisiana State University Department of Political Science research workshop for valuable comments. The authors also thank staff at the Louisiana Department of Education – especially Jessica Baghian, John White, and Jill Zimmerman – for assistance with state data on Louisiana public schools. Finally, the authors thank the Program on Education Policy and Governance at Harvard University and the Reilly Center for Media and Public Affairs at Louisiana State University for generously allowing them access to their survey data.
Funding statement
The authors received no financial support for the research, authorship, and/or publication of this article.
Competing interest
The authors declared no potential conflicts of interest with respect to the research, authorship, and/or publication of this article.
Author biographies
Michael Henderson is an associate professor of Political Science and Mass Communication at the Louisiana State University.
Belinda C. Davis is an associate professor of Political Science at the Louisiana State University.