If politics is about who gets what, when, and how, then the study of distributive politics is the study of politics writ large.Footnote 1 The breadth of scholarship that falls under the rubric of “distributive politics” is extraordinary. Research on the subject covers topics ranging from income inequality to tax policy to health care and social insurance spending to intergovernmental transfers to the distribution of disaster relief—among many other topics.Footnote 2 The literature highlights everything from the structural and institutional determinants of these outcomes to the preferences and beliefs underlying voters' support for various redistributive policies to the construction of the political and social coalitions that lobby for government favoritism.Footnote 3 Research is based on work in both advanced industrial societies and in some of the poorest developing countries in the world. Some of it is empirical; some almost wholly theoretical; and some a combination of the two.Footnote 4 The literature on distributive politics is vast and varied.
If there is a common thread running through this wide-ranging body of scholarship it is the preoccupation with the question of who profits from government policies and how the groups that do are able to secure the distributive outcomes that favor them. Progress in the field therefore depends critically on the ability of researchers to ascertain empirically who benefits from government allocation decisions. For it is only by collecting tangible evidence on the changing fortunes of various social groups and weighing this evidence against our theoretical expectations about who should benefit from government policies that theories of distributive politics can be tested and our understanding of the phenomenon deepened.
A growing recognition of the centrality of this task, combined with a growing availability of data collected by governments, aid agencies and others, has led to a burgeoning empirical literature on distributive politics. Most papers in this literature follow a similar pattern. They begin by describing a data set that has been (often painstakingly) assembled on the distribution of a valued patronage good. The data are explored for evidence regarding the particular communal groups, partisan coalitions, social classes, or special interests that appear to be favored. And conclusions are drawn about the theoretical approach that is best supported by these observed patterns. Thus Alberto Diaz-Cayeros and co-authors employ data from a major government-run anti-poverty program in Mexico to look for patterns of partisan targeting.Footnote 5 Kimuli Kasara analyzes data on taxes faced by producers of different cash crops in Africa to test whether political leaders favor their ethnic kin with lower taxes.Footnote 6 Miriam Golden and Lucio Picci use data on infrastructure expenditures across Italian provinces to examine the relative emphasis that legislators and ruling parties put on core and marginal voters.Footnote 7 Matz Dahlberg and Eva Johansson employ data on government grants to municipalities in Sweden to test whether incumbents channel resources to win votes.Footnote 8 Rebecca Weitz-Shaprio studies the allocation of workfare program funds in Argentina to evaluate whether they are distributed along partisan lines.Footnote 9 Raphael Franck and Ilia Rainer examine data on educational attainment and infant mortality in Africa to test hypotheses about ethnic favoritism.Footnote 10 And Robin Burgess and co-authors employ data on the construction of roads in Kenya to test similar arguments.Footnote 11
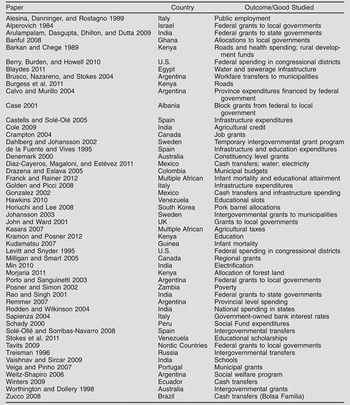
This literature (a sampling of its recent contributions is provided in Table 1) is a major growth area in the field of political economy. Many of the articles within it are exceedingly well done. Yet nearly all of them are vulnerable to a common and potentially devastating criticism: namely, that the pattern of favoritism that has been identified with respect to the outcome in question may be counterbalanced by a quite different, even opposite, pattern of favoritism with respect to other outcomes that are not being measured. For example, districts whose roads are rehabilitated may not receive school funding. Income groups that obtain tax concessions may not get social services. Households that receive cash transfers may not get electrification. Municipalities in which new clinics are constructed may not be given sanitation projects. The problem lies in the fact that governments can favor constituencies through the targeting of multiple public and private goods—roads, schools, clinics, electrification, cash grants and transfers, irrigation schemes, subsidies, tax breaks, public service jobs, and so on. Yet nearly all of the studies in the empirical distributive politics literature focus exclusively on just one or a small subset of these goods. So while the inferences these analyses draw about favoritism with respect to the particular outcome being studied may be warranted, conclusions about who benefits from distributive politics per se rest on shaky foundations. And if inferences about who benefits are open to question then so too are the conclusions reached about which theoretical approaches are best supported by the data. A good deal of what we think we know about distributive politics may be open to question.
Selected recent empirical investigations of distributive politics

We assess the severity of this potential problem by analyzing data from Africa, where partisan targeting in the allocation of government resources is rife and where unique data exist to test whether patterns of favoritism vary across the goods being distributed. Specifically, we employ Demographic and Health Surveys (DHS) from six African countries—Benin, Kenya, Malawi, Mali, Senegal, and Zambia—taking advantage of the fact that DHS collect household-level information about multiple outcomes that are both highly valued and plausibly products of government allocation decisions. We examine patterns of favoritism with respect to four different outcomes—infant survival, educational attainment, access to improved water sources, and household electrification—in order to test whether the inferences one would draw about favoritism vary with the outcome being studied.
We should be clear: our goal is not to demolish a straw man expectation that governments will favor their core constituents using every single distributive lever at their disposal. Such behavior is highly implausible, and we know of no empirical or theoretical study on distributive politics that makes such a claim. Nor is our claim that our analysis of favoritism in the distribution of selected public goods in six African countries captures the diversity of outcomes, channels, or types of favored groups that may be present in other settings. Nor is our goal to say anything particularly deep about the origins of the patterns of favoritism that we observe in the six countries we study. Our more modest objective is to investigate whether favoritism varies across outcomes in the particular context we study, and then to make a case for the implications of our findings for the kinds of claims that are commonly made in the broader literature on distributive politics. In the tradeoff between offering a tight but narrow test of this question versus attempting to investigate the issue more broadly but with much less confidence in our findings, we err on the side of the former.
Political favoritism takes many forms. The particular type of favoritism we study is the channeling of development resources by presidents to their coethnics. Such practice has long been assumed in the African politics literature and has, in recent years, been subjected to careful empirical scrutiny.Footnote 12 Much of this literature, however, tests for ethnic favoritism by focusing on the distribution of just one or two patronage goods. Our strategy of investigating four separate outcomes permits us to provide a more complete answer to the question of whether coethnics of African presidents are favored. It also permits us to assess directly whether the answer we arrive at varies with the particular outcome we happen to be studying. We find evidence that it does.
While our main goal is to test whether ethnic favoritism varies across outcomes, we make three additional contributions. First, as we describe below, we employ an innovative empirical strategy to estimate the impact of having a coethnic president on social welfare. This method puts us in a much stronger position than previous work on the topic to make inferences about the extent of presidential ethnic favoritism.Footnote 13 Second, although we focus on political favoritism, our cautionary finding that the answer one gets depends on the particular outcome one studies has broader implications for the investigation of other multifaceted phenomena—development, well-being, democracy, corruption—that can also be measured in terms of multiple indicators, a point to which we return in our conclusion. Finally, the demonstration that ethnic favoritism varies across outcomes opens the door to a new research agenda aimed at identifying the political, structural, bureaucratic, historical, or geographic reasons that might account for why political leaders choose to favor their supporters with some public and private goods rather than others. Although we do not fully take up these questions here, the findings and arguments we present provide a necessary foundation for this extremely promising research frontier.
Measuring the Range of Goods across Which Favoritism Might Take Place
As noted, we test whether patterns of favoritism vary across outcomes by taking advantage of data gathered in Demographic and Health Surveys in the six countries we study. DHS are nationally representative surveys that collect information on population, health, and nutrition at the household level in more than 85 developing countries. The surveys are typically conducted every five years in each country and have sample sizes of between 5,000 and 30,000 households. DHS are highly—indeed, uniquely—advantageous for testing whether individuals or groups that are favored with respect to one outcome are also favored with respect to others. First, as noted, standard DHS collect information about multiple outcomes in each survey household, which makes it straightforward to test whether outcomes are correlated. Second, DHS are implemented in standardized fashion in multiple countries. This makes it possible to compare the results of analyses undertaken in several settings, and thus to assess the generalizability of our findings. Third, DHS are repeated every five years, which permits both the stacking of data from each country across years and an analysis of how changes in the ethnic background of the president may affect patterns of resource distribution—an advantage we exploit in our estimation strategy. Finally, DHS data have the advantage of permitting a household-level analysis, which allows us to avoid relying on ecological inferences about the relationship between ethnicity and public goods provision—a problem that plagues many studies in this literature. We are aware of no other data set that combines these highly advantageous attributes; hence our decision to address our research question in a set of countries in which DHS data are available and vis-à-vis a set of outcomes on which it collects information. Expanding the analysis to other settings or to a different set of distributive outcomes might superficially broaden our findings, but at the cost of the confidence we have in the results we report.Footnote 14
Given the estimation strategy we employ (described later), which leverages change over time in the ethnicity of the president in each country, countries must meet three requirements in order to be included in our analysis. Data must be available for multiple DHS rounds. There must have been turnover in the ethnic backgrounds of the country's presidents during the interval between the country's first and last available DHS surveys. And the country's DHS questionnaire must collect information about the ethnic backgrounds of household heads. The six countries we include in our analysis constitute the universe of African cases that satisfy all three of these criteria.Footnote 15
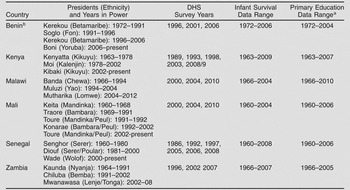
For each of the four public goods outcomes we study, we create an ethnic match variable that takes a value of 1 if the respondent or head of household was a coethnic of the president at the time that the benefit was received, and a 0 otherwise. Table 2 provides a list of each president in each country and his ethnic group membership.Footnote 16 Significant positive coefficient estimates on the ethnic match variable indicate that the president's group has been favored vis-à-vis other ethnic groups with respect to the outcome in question.
Country information and data availability

a Primary education data range is determined by the year in which the individual would have finished primary school.
b Benin had too many leadership transitions in the 1960s to generate meaningful predictions about the association between coethnic presidency and primary school attainment. Our analysis of Benin therefore begins at the start of the first Kerekou presidency in 1972.
Because decisions taken by a president on behalf of his coethnics might take several years to generate measurable effects, and because the coethnics of an outgoing president may continue to benefit after he leaves office (and before it is possible to alter entrenched patterns of resource distribution), we lag the ethnic match variable by two years for all outcomes. Increasing the lag to three or four years, reducing it to one year, or including no lag at all leads to modest changes in the coefficient estimates of some outcomes (refer to the Appendix, Table A1) but does not alter the substantive conclusions that we draw from the results taken as a whole: namely, that evidence for ethnic favoritism varies with the outcome one studies.
Infant Survival
Infant survival rates (the opposite of infant mortality) are one of the most basic measures of human well-being. They are also strongly affected by governmental intervention.Footnote 17 This makes them a natural outcome to examine in an analysis of political favoritism. An added attraction is that infant survival rates are shaped by other underlying conditions such as income; caloric intake; female literacy; and access to shelter, clean water, primary health care, and sanitation, and thus pick up other (often difficult to measure) indicators of welfare.Footnote 18
To calculate infant survival rates from the DHS data, we construct a dataset that includes all available surveys from each country where the unit of observation is the live birth and where infant survival is defined as surviving through the first twelve months of life. Using live births as the unit of analysis takes advantage of the fact that DHS collects retrospective information about all live births to all adult females in the household, as well as information about each child's current mortality status (including the date of death, if applicable). Because each adult female household member reports multiple live childbirths, each in different years, this strategy permits us to generate annual estimates of infant survival for a period of time that goes back more than two decades (and sometimes into the colonial era), and with a sample size that greatly exceeds that of the DHS sample itself.Footnote 19 An infant's ethnic match is determined by the ethnicity of the child's mother and the ethnicity of the president two years before the child was born. Thus, in Kenya, infants born to Kikuyu mothers before 1980 and after 2004 are coded as an ethnic match, since Jomo Kenyatta, a Kikuyu, served as president until 1978 and Mwai Kibaki, also a Kikuyu, assumed office in 2002. Between 1980 and 2004, infants born to Kalenjin mothers are coded as an ethnic match, as 1978–2002 was the era during which Daniel arap Moi, a Kalenjin, was president. Infants born to mothers of other ethnicities are given a 0 on the ethnic match variable for infant survival.Footnote 20
The retrospective childbirth section of the DHS also collects a wealth of additional information about each infant birth that allows us to include appropriate statistical controls in our models. We follow the public health literature in including birth-specific controls in our analyses for infant gender, the infant's birth order relative to other siblings (and its square), whether the infant is a multiple (a twin, triplet, and so on), the mother's age (and its square), and a dummy indicating whether the infant is born less that 24 months after a sibling.
Educational Attainment
Primary education is a highly desired good in Africa and a major object of political promises during election campaigns.Footnote 21 To the extent that distributive politics is about the allocation of limited but valued resources, primary education completion is a natural outcome to investigate. Following Franck and Rainer,Footnote 22 we create a dichotomous measure indicating whether the respondent completed primary school and then determine an ethnic match by connecting the ethnicity of the respondent to the ethnicity of the president when the respondent was aged 4–11, which is two years before the age range when most children attend primary school in Africa (primary school age is 6–13). If a change in the president occurred during this period, the match is coded based on the ethnicity of the president who was in power for the majority of the time period.
Access to Improved Water Sources and Electrification
In a setting where the vast majority of households do not have electricity and where a significant proportion get their water from streams, lakes, and other unimproved sources, electrification and access to protected or piped water are highly demanded. To test whether their receipt is related to ethnic favoritism, we create, for electrification, a dichotomous measure indicating whether the household has electricity and, for water, an ordered variable running from one to four coded as follows: 1 if the water source is natural, such as from rainwater, a lake, stream, or pond; 2 if the source is an unprotected borehole or well; 3 if the source is a protected borehole or well; and 4 if the respondent's water source is piped or better (bottled and so on).Footnote 23 We code an ethnic match in terms of the ethnicity of the respondent and the ethnicity of the president two years before the survey. Note that the DHS does not provide information about when the household first received electricity or water improvements, so we are not in a position to define the ethnic match variable based on the ethnicity of the president at the time that the electrification or water improvement took place. We discuss this limitation below.
Table 2 provides information about the DHS survey years used for each country and the data ranges for our analyses of infant survival and primary educational attainment.
Are the Outcomes We Study Really Products of Political Decisions?
The four outcomes we study differ in the extent to which they can be seen unambiguously as the result of allocation decisions made by the president. Whereas electricity delivery and education are almost always direct products of government action, access to improved water is often a product of interventions by donors or NGOs.Footnote 24 Infant survival is affected by a different problem: it is shaped by so many factors—some clearly in the government's control, some only weakly so—that it may be difficult to assign credit or blame to the government for childhood survival rates. To the extent that we want to draw conclusions about political favoritism from the distribution patterns we observe with respect to these outcomes, the question of who makes the decisions about how they are to be distributed obviously matters. If donors or NGOs are deciding which communities will get health interventions or where new boreholes are to be dug, then we would be wrong to interpret improvements in infant survival rates or the receipt of new water infrastructure by members of a particular ethnic group as evidence for distributive politics. However, precisely because these outcomes are highly valued, governments usually do their best to direct their distribution to their favored constituents, often by telling donors and NGOs where they can and cannot work. Consistent with this claim, Roland Hodler and Paul Raschky find that foreign aid is disproportionately funneled to the birth region of the country's president, especially in countries with weak political institutions, as in the cases we study here.Footnote 25 In Kenya, Ryan Jablonski finds similarly that World Bank and African Development Bank projects are disproportionately targeted toward coethnics of the president.Footnote 26 We interpret our results in light of these findings. Furthermore, because NGOs that locate their activities in one area tend to stay in that area, our strategy of analyzing changes in patterns of favoritism over time under presidents whose ethnic kin come from different regions helps us deal with this issue.
Testing For Ethnic Favoritism across the Four Outcomes
The key to our strategy for identifying ethnic favoritism lies in taking advantage of changes in each country in the ethnicity of the president during the period for which DHS data are available. This helps to solve two otherwise difficult inferential problems. First, it allows us to disentangle the effects of favoritism from the effects of historical or other factors that happen to make some groups better off than others. For example, if, in a given survey year, we found that the president's ethnic group had higher rates of infant survival than other groups, it would be difficult to know whether this positive outcome was a product of the president's favoritism or of deeper causes such as the group's location in a rich agricultural region, its earlier exposure to missionary education, its proximity to the national capital, its higher than average receipt of remittances, or some other group-specific natural advantage.Footnote 27 However, by employing a difference-in-difference estimation, which compares the fortunes of this group's members during periods when the president is from their group and when he is not, we can separate the relative contributions of presidential favoritism and group-specific factors.
A second issue that our empirical strategy helps us to deal with is the potential objection that distributive politics is about transfers of resources to constituencies for political ends, whereas the DHS data do a much better job of measuring stocks of public goods than flows. Hence, one could argue that distributive politics should be studied by looking at educational expenditures rather than primary schooling attainment, or by studying where health spending is channeled rather than cross-group variation in infant survival. A related problem—particularly relevant for our analyses of electrification and water source improvements—is that stocks of some durable goods (like infrastructure) tend to persist, which makes it difficult to disentangle recent preferential treatment from past favoritism when what one is measuring is the present-day presence or absence of the good in question.
The severity of this stock versus flow problem varies across the outcomes we study. In the case of infant survival and education, we can date the delivery of the service and thus make a strong inference about the flow of resources at a particular point in time, which we can then link to the ethnicity of the president at that moment (subject to the two year lag). In the case of electrification and access to improved water, for which we cannot match the date of the receipt of the good, we can take advantage of the variation across surveys in the ethnic group membership of the president, which permits us to compare data collected during years in which presidents of different ethnicities were in power, and thus to test whether changes in the ethnicity of the president lead to group-specific changes in these outcomes.Footnote 28
Moreover, even very stock-like outcomes such as electrification and water provision are often subject to proximate allocation decisions. Although the physical capital with which to deliver electricity or piped water clearly results from the accumulation of electricity and water infrastructure over time (and therefore is properly viewed as a stock measure), the actual utilization of that infrastructure often reflects flows of resources closer to the moment that the good is consumed. As Brian Min demonstrates, the electrification of rural Indian villages depends not only on the presence of electrical lines but also on proximate decisions made by politicians and their agents to make sure that the power lines are in good repair and that electricity is flowing through them.Footnote 29 The service delivery that we observe at any particular point in time is therefore a product of a combination of government decisions made both in the past and in the present. Hence, our measures of household electrification and water sources may be more flow-like than they at first appear.
We estimate a series of logit models for the three dichotomous outcomes (infant survival, primary school completion, and household electrification) and Ordinary Least Squares regressions for the ordered categorical outcome (household water source) in each country in which the key independent variable is the ethnic match variable described earlier.Footnote 30 The models include both ethnic-group and survey-year (or birth-year) fixed effects, the former for the reasons just discussed and the latter to control for year-specific shocks that might influence the outcomes we study (e.g., weather shocks, which might affect infant survival through their impact on crop yields and nutrition, or the correspondence between survey years and national elections, which might affect investments in electricity provision, water improvements, and perhaps even infant survival). We also include robust standard errors, clustered at the ethnic group-presidential regime level (since this is the level at which the treatment—presidential favoritism—is applied), and ethnic group-specific linear time trends to account for the fact that secular trends unrelated to who is in power may affect our outcomes of interest and that groups may experience these trends differently, and for reasons unrelated to their connections to the president.
The Outcome One Studies Affects the Answer One Gets
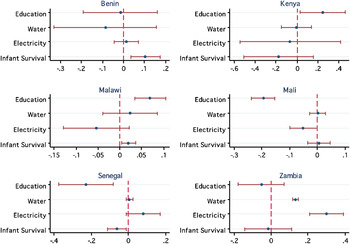
Our analysis sought to test whether the conclusion one reaches about who benefits from distributive politics varies with the outcome one happens to study. We investigate this broad question by analyzing specifically whether evidence for presidential ethnic favoritism in six African countries varies across four outcomes that are both critically important to citizens and plausibly products of government allocation decisions: infant survival, educational attainment, access to improved water sources, and household electrification. Our findings are summarized in Figure 1. Each panel presents the coefficient estimates for the ethnic match variable (with 95 percent confidence intervals) for each of the outcomes we study, based on the models reported in Appendix Tables A2-A7. The figure provides a graphical illustration of the inference that one would make about ethnic favoritism in each country for each outcome. It makes clear that inferences about ethnic favoritism by presidents in the six countries are outcome dependent.
Evidence for ethnic favoritism with respect to multiple outcomes in six African countries
Note: Figure 1 illustrates point estimates and 95 percent confidence intervals of the ethnic match coefficient for each outcome in each country. Positive point estimates with intervals that do not overlap with zero (the dotted lines) can be interpreted as evidence of ethnic (dis-)favoritism.

In Benin, Kenya, Malawi, and Zambia—all countries where descriptive accounts of national politics would lead us to expect to find evidence of ethnic favoritism—we find confirmation that coethnics of the president are in fact better off, at least on some outcomes: coethnics of the president are more likely to finish primary school in Kenya and Malawi, are more likely to survive their first year in Benin and Malawi, and are more likely to have access to improved water sources and household electricity in Zambia. However, we also find that, with respect to other outcomes, the president's coethnics are not favored relative to members of other groups. One's inference about ethnic favoritism in these countries depends entirely on the outcome one selects—or, as is more likely the case, on the data to which one happens to have access and thus be in a position to analyze. Scholars hoping to uncover evidence of ethnic favoritism in these countries might get lucky and choose an outcome for which there is evidence that the president's group enjoys an advantage. But they might also get unlucky and choose an outcome for which the data suggest that the president's group is no different from any other. Whichever it is, the conclusions they draw about distributive politics will be as much a function of the outcome they happen to select as of the general patterns of political behavior that they are trying to understand.
In Mali, a country where ethnicity is widely understood not to be particularly salient politically, we find evidence that the president's group is actually disadvantaged vis-à-vis members of other groups on some measures.Footnote 31 Coethnics of the president are equally likely as non-coethnics to survive their first year or to have access to an improved water source but are less likely to finish primary school or to have electricity. The notion that a president's ethnic group could be disfavored is not entirely novel: Kasara finds that this is the case with respect to agricultural taxation in 30 African countries.Footnote 32 The more important lesson here is that, yet again, the inference one makes depends on the outcome one happens to study.
The case of Senegal suggests a deeper potential problem. Here, we find evidence that coethnics of the president are favored with respect to water and electricity (ethnic match is significant at the 0.1 level in both models) but disfavored with respect to education and infant survival. Whereas scholars investigating patterns of ethnic favoritism in Benin, Kenya, Malawi, or Zambia might mistakenly conclude that there was no favoritism when in fact there was (at least on some other outcomes) or that there was strong ethnic favoritism when in fact it was limited to the particular outcome under study, here scholars risk drawing the completely opposite conclusion about distributive politics from the one they might have reached had they happened to study a different outcome. This result illustrates the worst-case scenario invoked in the introduction to this article: that ethnic favoritism in the allocation of some goods might be counterbalanced by an opposite pattern of allocation of others. The Senegal case makes clear the potential pitfalls of not examining the full set of outcomes over which government leaders have control.
Conclusion: Rethinking the Empirical Analysis of Distributive Politics
The literature on distributive politics has long been very strong on theoretical expectations but rather weak on careful empirical tests, particularly in developing countries. Over the past decade, this weakness has been addressed by a groundswell of painstaking empirical work drawing on rich data sources. However, many of these studies are vulnerable to the criticism that their findings may not travel beyond the particular outcome they have studied. For the outcomes and countries we have studied here, our results suggest that this worry is real. The implication is that researchers may need to revisit their conclusions to confirm that they represent underlying patterns of distributive politics, rather than just patterns of favoritism vis-à-vis the particular outcome they happen to have studied—either that or rephrase their conclusions to reflect their uncertainty about the applicability of their finings to other unmeasured distributive outcomes.
To propose that some of the extant findings in the empirical distributive politics literature may need to be qualified is not to suggest that this literature has not made valuable contributions to our understanding of government behavior and distributive patterns in particular domains. Almost always, the specific areas of distribution and targeting that have been studied are important and worthy of focus in their own right, as is the case with all four of the outcomes we focus on here and with all of the outcomes studied in the projects listed in Table 1. However if the goal of the research is to make general statements about governments' distributive strategies or propensities to favor certain political constituencies, or about how politics in a particular country operates more generally, then a narrow focus on one or a few goods can be misleading.
Some analyses of distributive politics will be more vulnerable to this critique than others. Studies of fungible goods such as cash transfers or all-encompassing measures such as total government spending may be less problematic than studies that focus on a single good that is one of several that the government allocates, such as tax rates in a particular sector, road construction, health spending, or schools. This caveat notwithstanding, our results underscore the importance of basing one's claims about who benefits from distributive politics on analyses that examine as complete as possible a portfolio of government activities.
Beyond Distributive Politics
Our focus here has been on distributive politics, but our critique and findings have implications for other literatures in which the underlying issue of interest can also be measured in multiple ways. Take, for example, the literature on the impact of democracy on well-being. Some scholars working on this question operationalize well-being in terms of infant and child mortality; others in terms of public health measures such as access to clean water, vaccination rates, and life expectancy; others in terms of educational outcomes; and still others in terms of government programs such as social security or health insurance.Footnote 33 Or take the literature on corruption, which some researchers measure in terms of local bribe taking by civil servants; others in terms of the valuation of publicly traded companies with connections to top government officials; others in terms of tax evasion; and others in terms of leakage in public expenditure.Footnote 34 The range of outcomes being investigated in these literatures reflects the fact that, as with government favoritism, well-being and corruption are complex, multi-dimensional concepts.Footnote 35
Researchers working on these topics must be attuned to the fact that the particular indicator of the phenomenon they choose to study may give them an answer that is different from the answer that they would have gotten had they chosen another equally plausible (but nonetheless different) indicator.Footnote 36 Democracy may be more associated with well-being when measured through educational attainment than through social security coverage. A country may be viewed as more corrupt when corruption is measured in terms of petty bribe taking than in terms of the leakage of large-scale infrastructure expenditures. The implication is that, exactly as with work on distributive politics, conclusions must either be couched narrowly in terms of the particular outcome being studied—that is, in terms of educational attainment or petty bribe taking rather than in terms of “well-being” or “corruption” generally—or efforts must be made to assess the robustness of the results to alternate measures of the underlying concept.
A New Research Agenda for the Study of Distributive Politics
While the main goal of our analyses is to demonstrate that one's answer to the question “does the president's group benefit disproportionally?” depends on the outcome one happens to study, our finding that it does raises important, broader questions for the study of distributive politics. Why does favoritism take place with respect to some outcomes but not others? What types of public goods are more open to political manipulation or partisan targeting and why? Do particular kinds of support coalitions tend to be favored with specific types of public goods? Are certain goods more likely to be targeted toward core supporters (or coethnics) while others are more likely to be distributed more broadly? What kinds of social structural factors (population density, social diversity) or institutional conditions (regime type, electoral rules) affect the kinds of goods that are used to favor a leader's support coalition and the pattern of their distribution? Such questions constitute the frontier for research on distributive politics. But we can only begin to answer them if we interpret existing and future empirical results with the recognition that patterns of distribution and favoritism can and do vary across outcomes.
Supplementary Materials
Explanatory file http://journals.cambridge.org/pps2013003
Replication file http://journals.cambridge.org/pps2013004
Table A1. Robustness of results to changes in the lag http://journals.cambridge.org/pps2013005
Table A2. Does the president favor his coethnics in Benin? Evidence across multiple outcomes http://journals.cambridge.org/pps2013006
Table A3. Does the president favor his coethnics in Kenya? Evidence across multiple outcomes http://journals.cambridge.org/pps2013007
Table A4. Does the president favor his coethnics in Malawi? Evidence across multiple outcomes http://journals.cambridge.org/pps2013008
Table A5. Does the president favor his coethnics in Mali? Evidence across multiple outcomes http://journals.cambridge.org/pps2013009
Table A6. Does the president favor his coethnics in Senegal? Evidence across multiple outcomes http://journals.cambridge.org/pps2013010
Table A7. Does the president favor his coethnics in Zambia? Evidence across multiple utcomes http://journals.cambridge.org/pps2013011