Americans spend much of their time and energy at work. The policies that govern workers vary state to state with some workers receiving higher pay, more generous overtime, or greater injury compensation. Joining a union may be easier and come with more bargaining power in one state versus another. Labour policy determines not just the distribution of economic resources, but also how much voice workers have in the workplace and in politics. Explaining changes in labour policy is crucial given its implications for political and economic inequality. Since 2010, some states have pushed to decrease workers’ ability to bargain as a collective unit (Bucci Reference Bucci2018), whereas others have enacted plans to increase the minimum wage (Franko and Witko Reference Franko and Witko2017). What accounts for differences in labour policy restrictiveness across the United States (US) states?
The conventional wisdom in the literature is that Republicans, with help from large conservative political networks, are more likely to adopt policies that restrict organised labour (Skocpol and Hertel-Fernandez Reference Skocpol and Hertel-Fernandez2016; Lafer Reference Lafer2017; Hertel-Fernandez Reference Hertel-Fernandez2018), which has historically been aligned with the Democratic Party coalition (Dark Reference Dark1999; Rosenfeld Reference Rosenfeld2014; Jansa and Hoyman Reference Jansa and Hoyman2018). We argue that differences in labour policy are more than simply a function of the partisan composition of state governments. Instead, we posit that party control of government matters but the willingness to enact new restrictions also depends on public approval of unions and the power of organised labour in the state.
To our knowledge, there is no modern measure of state-level public support for unions. To test what leads to restrictive labour policy, we first establish how individuals feel towards organised labour by creating new state-level estimates of union support. Estimating state-level opinion towards organised labour is difficult, as most polls are not designed to give accurate state-level estimates (Kastellec et al. Reference Kastellec, Lax and Phillipsn.d.). This article overcomes data shortcomings by gathering existing national opinion polls from 1992 to 2014 that ask about union support and include a state of residence, and using the technique of dynamic multilevel regression and poststratification (hereafter, dgMRP) to arrive at state-level labour opinion over time (Dunham et al. Reference Dunham, Devin and Warshaw2016)Footnote 1 . We use this technique to estimate average support for unions as well as support for unions by class, so we can test for differences in responsiveness of state government to the preferences of the wealthy, the middle class and the poor.
Our dynamic measure of union support across states, over time and by class is used to predict the adoption of restrictive labour policies, such as right-to-work and the lack of prevailing wage laws, along with alternate explanations about statehouse composition and unionisation rates. Overall, we conclude that the adoption of restrictive policies is a result of Republican unified state government and the strength of conservative political networks. However, Republican governments are less likely to adopt restrictive policies when unions are strong and when union support among middle- and low-income earners is high. Interestingly, these results demonstrate conditional responsiveness to middle- and low-income earners. While it is important to consider how a small number affluent people may shape labour policy to their advantage in less public ways, we find government is not always responsive to high-income people’s opinions. This is a surprising and important finding, as labour policy is a policy area where opinion is polarised by class and, therefore, we might expect unequal representation of the rich (Gilens and Page Reference Gilens and Page2014).
The importance of studying labour policy
Labour policy governs the wages, benefits, rights of workers and responsibilities of employers. Labour policy varies substantially across states and has seen a wave of revision. In the early 2010s, states passed legislation that limited public sector workers’ ability to bargain, implemented right-to-work laws in the private sector, restricted project labour agreements (PLAs), eliminated prevailing wage law, cut unemployment insurance and workers compensation, resisted attempts to raise the minimum wage and prevented localities from raising the minimum wage (Lafer Reference Lafer2017).Footnote 2
Increasing economic inequality has brought renewed attention to the impact of labour policy on the distribution of economic resources. According to power resources theory, workers benefit economically when they, through unions and left-controlled governments, are influential and hold power (Korpi Reference Korpi1983). Indeed, scholars have observed that where unions are stronger, there tends to be policies that increase redistribution to lower and middle-income workers (Radcliff and Saiz Reference Radcliff and Saiz1998; Kelly and Witko Reference Kelly and Witko2012; Bucci Reference Bucci2018; Hacker and Pierson Reference Hacker and Pierson2011; Rosenfeld Reference Rosenfeld2014; Flavin Reference Flavin2018). Increased redistribution also brings political benefits to workers, as workers and their unions tend to be more influential the more resources they have (Leighley and Nagler Reference Leighley and Nagler2007; Kelly and Witko Reference Kelly and Witko2012). Thus, increasingly restrictive labour policy has important implications in the workplace and society, as well as the political fortunes of American unions. Indeed, one of the most important developments in American politics over the past 50 years has been the decline in labour union membership and political influence (Hacker and Pierson Reference Hacker and Pierson2011).
Class and responsiveness to public opinion of unions
Labour policy provides leverage on the question of who is represented in the American states. As Key (Reference Key1949) notes, the correspondence between the preferences of the people and the policies produced by government is one of the central questions to the study of democratic governance. Early studies were optimistic about the health of American democracy, finding that average public opinion predicts legislator voting (Stimson et al. Reference Stimson, MacKuen and Erikson1995), government policy on specific issues (Page and Shapiro Reference Page and Shapiro1983), and the liberalism of policy at the national (Erikson et al. Reference Erikson, MacKuen and Stimson2002) and state level (Erikson et al. Reference Erikson, Wright and McIver1993). However, Lax and Phillips (Reference Lax and Phillips2012) demonstrate that across eight policy areas there is often less congruence with public sentiment than we might want or expect in a democracy. While the overall picture indicates a democratic deficit, the authors do find a greater degree of responsiveness to public opinion on some issues.
Other work finds evidence of biassed representation, concluding that when the preferences of higher income people diverge from everyone else, the well-off tend to win out on policy (Bartels Reference Bartels2008; Gilens Reference Gilens2012; Gilens and Page Reference Gilens and Page2014). High-income opinion is a stronger predictor of senators’ and representatives’ voting records (Bartels Reference Bartels2008; Ellis and Stimson Reference Ellis and Stimson2012), and government policy generally (Gilens Reference Gilens2012) than the opinions of middle-income Americans (Gilens and Page Reference Gilens and Page2014). While the wealthy and the poor share many policy preferences (Enns and Wlezien Reference Enns, Wlezien, Enns and Wlezien2011; Gilens Reference Gilens2005), and it would be unreasonable to expect perfect congruence between average public opinion and policyFootnote 3 , unequal responsiveness based on income level is concerning for the well-being of American democracy.
Patterns of unequal representation persist at the state level. State governments are more responsive to wealthy residents across a number of policies (Flavin Reference Flavin2012). State parties weigh the input of wealthy donors and volunteers more heavily than other constituents (Rigby and Wright Reference Rigby and Wright2013).Footnote 4 At the state level, economic elites have greater influence over economic policy in particular (Gray and Lowery Reference Gray and Lowery1991; Witko and Newmark Reference Witko and Newmark2005; Jansa and Gray Reference Jansa and Gray2017) as states compete with one another to attract and retain investment from wealthy individuals and businesses by maintaining low levels of worker-friendly policies (Peterson Paul Reference Peterson Paul1995; Witko and Newmark Reference Witko and Newmark2005; Jansa and Gray Reference Jansa and Gray2017). Although state parties have nationalised to some extent (Hopkins Reference Hopkins2018; Grossmann Reference Grossmann2019), biases in representation have not been eliminated. Wealth and business occupy a privileged position in American politics (Lindblom Reference Lindblom1977), including at the state level.
Yet, even as Lax and Phillips (Reference Lax and Phillips2012) show that states often fail to produce policies when super-majorities of constituents support them, they find that congruence improves when the policy is salient. We suspect labour policy may be perceived like a high-profile redistributive policy, with salient divisions in opinion between high- and low-income people. Indeed, opinion towards labour has historically been polarised, especially by class. Schickler and Caughey (Reference Schickler and Caughey2011) find that in the 1930s and 40s, the national level association between organised labour and radical politics limited support for a larger New Deal, where many of the more redistributive public policies had widespread appeal. Even among otherwise liberal groups, preferences towards more generous labour policy vary between high- and low-income people (Broockman et al. Reference Broockman, Ferenstein and Malhotra2019). Changes in labour policy tend to grab headlines, most famously when Act 10 – a bill curbing public sector union collective bargaining rights – was introduced in Wisconsin in 2011. As Lafer (Reference Lafer2017) profiles, Republican Governor Scott Walker of Wisconsin commented that he had “dropped the bomb” when introducing Act 10 to the legislature, after not mentioning limiting collective bargaining rights during the 2010 gubernatorial campaign.
We study labour policy because its implications for economic and political power and the likely divergent views by class on the issue make it an excellent venue for testing theories of who governs in American politics. Despite these advantages, labour policy remains understudied at the state level.
Labour policy adoption
The existing work on labour policy finds that the adoption of more restrictive labour policy is driven by party control of government. States are more restrictive when their policies make it harder on unions to organise. In contrast, some states’ labour policy is more permissive, allowing workers to freely join unions to bargain for better wages and benefits and to advocate for their rights in the workplace.
Institutionally, the US lacks any national social democratic or labour party (Eidlin Reference Eidlin2018; Archer Reference Archer2010). Unions, though disadvantaged by the lack of a dedicated labour party, have sought partners within the two-party system. Unions maintain a close alliance with the Democratic Party (Dark Reference Dark1999; Rosenfeld Reference Rosenfeld2014; Jansa and Hoyman Reference Jansa and Hoyman2018), although there is some variation in this relationship at the state level as some Democratic parties may align themselves more with business-oriented interests (Bucci and Reuning Reference Bucci and Reuningn.d.).
The Republican Party tends to oppose organised labour and speaks publicly against unionisation (Hacker and Pierson Reference Hacker and Pierson2011). In fact, recent scholarship documents the rise of restrictive labour policy pushed by conservative policy networks in states with Republican governments (Skocpol and Hertel-Fernandez Reference Skocpol and Hertel-Fernandez2016; Lafer Reference Lafer2017; Hertel-Fernandez Reference Hertel-Fernandez2018). Other studies look at the adoption of right-to-work laws, finding a positive association between Republican Party control and the probability of adopting right-to-work (Dixon Reference Dixon2010). Despite heterogeneity in state Republican parties, there has been a consistent national push by conservatives to paint union members, especially in the public sector, as overcompensated and in need of reigning in (Kane and Newman Reference Kane and Newman2019).
Separately, another literature shows a robust relationship between the strength of labour unions and public policy. Unions have an agenda that runs counter to business interests (Freeman and Medoff Reference Freeman and Medoff1984; Radcliff and Saiz Reference Radcliff and Saiz1998) and tend to act as advocates of the working class by pushing for more redistributive policy generally (Ahlquist and Levi Reference Ahlquist and Levi2013; Reynolds and Brady Reference Reynolds and Brady2012) and greater benefits in the workplace in particular (Bucci Reference Bucci2018; Witko and Newmark Reference Witko and Newmark2005). Where unions are stronger, working class people are more politically active and more likely to vote (Radcliff and Saiz Reference Radcliff and Saiz1998; Wallerstein Reference Wallerstein1989) and more likely to mobilise in opposition to threats to workers’ and unions’ economic resources and political clout. As a result, states with stronger unions have more liberal public policy (Radcliff and Saiz Reference Radcliff and Saiz1998; Bucci Reference Bucci2018; Kelly and Witko Reference Kelly and Witko2012), higher levels of political participation across income levels (Leighley and Nagler Reference Leighley and Nagler2007) and greater political equality (Flavin Reference Flavin2018).
But, the labour movement is not a uniform political actor. Some unions have engaged in more universalistic political work, whereas others have been more directly focused on the welfare of their members (Ahlquist and Levi Reference Ahlquist and Levi2013). While many labour unions would not support restrictive labour policy, there are avenues that divide the labour movement. Wade (Reference Wade2018) discusses division among public sector employee unions that cut across occupation. The study finds that teachers, who are frequent allies of and donors to the Democratic Party, are often included in legislation limiting collective bargaining, but police officers who tend to associate with Republicans are not. For parties deciding which policies to pursue, labour restricting legislation may have important exemptions and those exemptions may line up with groups important to the party itself.
Despite the clear strain in the literature that points to Republican control of state government as the main predictor of restrictive labour policy, the literature does not as clearly consider nor test for the constraints placed on legislative agendas by organised interests and public opinion. We know that where labour is stronger, policy tends to be more redistributive, but not whether labour strength may shift labour policy in a less restrictive direction. Furthermore, despite a burgeoning literature of responsiveness to public opinion (Lax and Phillips Reference Lax and Phillips2012) and how it varies by income (Gilens Reference Gilens2012), it is unclear how GOP state governments with a restrictive labour policy agenda will respond to a public supportive of unions. In the next section, we outline several expectations about how party control, unionisation and public opinion interact to affect the restrictiveness of state labour policy.
Expectations
First, given the differences in preferred policy across party, and that unified government allows parties to select the types of policies they want, we expect that unified Republican governments will be more likely to adopt more restrictive labour policy than divided or unified Democratic governments.
Yet, enacting new restrictions is likely to come at a high political cost as groups compete for control of labour policy. Walker and his Republican allies correctly identified that if middle- and working class individuals support unions, and workers are well organised into unions, then their introduction of Act 10 would be consequential. Specifically, they would likely face heavily political penalties, such as increased negative media coverage, increased disapproval, reduced likelihood of reelection, and even recall, as unions mobilise members and voters in opposition to new restrictions. Therefore, we expect that unified Republican state governments will be less likely to adopt restrictive labour policies when union membership is high.
Alternatively, one could argue that where unions are strong, Republican governments will be more likely to enact restrictions. For one, there needs to be some union presence to restrict, otherwise legislative time would be better spent on other issue arenas. Also, governments may seek to pass restrictive legislation that “targets” groups that are seen as contenders for power (Schneider and Ingram Reference Schneider and Ingram1993). Indeed, recent research using Schneider and Ingram’s (Reference Schneider and Ingram1993) framework shows that policy targeting is an influential factor in the diffusion of public policies across the states (Boushey Reference Boushey2016). Unions are also seen as politically powerful but negatively viewed and, therefore, targeted for punishment through public policy (Kreitzer and Smith Reference Kreitzer and Smith2018).
Unions are a contender for power in the eyes of many Republican political elites. As both Hertel-Fernandez (Reference Hertel-Fernandez2018) and Lafer (Reference Lafer2017) argue, both social and economic conservatives see the weakening of unions as a means to an end. For economic conservatives, weakening unions is an end in and of itself. Weakening unions helps to transfer economic and political power to business leaders and the wealthy and makes achieving conservative economic policy goals more likely. Social conservatives support these efforts because weakening unions reduces the probability of Democrats winning office, which increases the probability of socially conservative Republicans winning.
Furthermore, where public sector unionisation in particular is high, the GOP may have a pretence for rallying public opinion to their side, as Cramer (Reference Cramer, Bermeo and Bartels2014), Cramer (Reference Cramer2016), and Kane and Newman (Reference Kane and Newman2019) show that resentment of public sector employees can run high if they are framed as overcompensated, lazy, and undeserving. Directing resources towards restricting public sector unions would also help to curtail the power of some of the largest and most politically active unions (Wade Reference Wade2018). By directing the public to focus on public sector union members, Republican state governments can enact labour policy restrictions and reinforce resentment towards public sector employees and the government itself.
Thus, Republican governments may actually choose to spend political capital on these fights in order to achieve the greatest long- and short-run benefits of enacting new restrictions. While we expect that when unions are stronger there will be less restrictive labour policies, we also test the alternative possibility that strong labour unions (especially public sector unions) encourage Republicans to enact restrictions.
Public opinion also plays a key role in shaping Republican governments’ calculus. Recent scholarship on unequal responsiveness to opinion by income group suggests that a set of expectations by income group is appropriate rather than just a single expectation about average opinion.
First, it is likely that the opinions of the wealthy are at odds with permissive labour policy. Support for organised labour may viewed as harmful for a wealthy person’s self-interest. Indeed, higher levels of unionisation are related to higher wages for workers (Freeman and Medoff Reference Freeman and Medoff1984; Rosenfeld Reference Rosenfeld2014), lower levels of chief executive officer (CEO) compensation (Card, Lemieux and Riddell Reference Card, Lemieux and Riddell2004) and lower levels of income inequality (Bucci Reference Bucci2018). For politicians, the motivation to maintain votes and donations from high-income earners, who are likely to engage in politics at higher rates than the middle- and working class (Schlozman, Verba and Brady Reference Schlozman, Verba and Brady2012; Flavin Reference Flavin2012; Carnes Reference Carnes2013) and likely to be less supportive of labour unions, may help offset the political costs of enacting restrictions. Therefore, we expect that unified Republican governments are more likely to adopt restrictive labour policies as union approval among wealthy individuals decreases.
What role, if any, do middle- and working class opinions play in the propensity of conservative governments to adopt labour restrictions? The tempting answer from the literature would be either none (Gilens and Page Reference Gilens and Page2014), or some if the middle- and working class agree with the wealthy (Branham, Soroka and Wlezien Reference Branham, Soroka and Wlezien2017). But, the middle- and working class are historically much more supportive of unions than the wealthy, meaning the opportunity for incidental policy representation (Branham, Soroka and Wlezien Reference Branham, Soroka and Wlezien2017; Enns Reference Enns2015) is low.
When the middle and working class are supportive of unions, it could signal to Republican legislators of high costs of action, thereby reducing the chance of new restrictions. But, it might also be a signal of potential benefits. Restricting a popular labour movement could stem the ability for unions to add more members and gain in political power. In fact, this seemed to be the impetus behind Southern states adopting right-to-work laws in the wake of Taft-Hartley Act of 1947 – to prevent Blacks from joining unions and becoming more politically powerful (Frymer Reference Frymer2008). Thus, if Republican agendas are responsive to broad public opinion, as seminal works suggest (Erikson, Wright and McIver Reference Erikson, Wright and McIver1993), we would expect that unified Republican governments will be less likely to adopt restrictive labour policies as union approval among middle and low earners increases as they seek to minimise electoral costs. However, we also test for the alternative that unified Republican governments are more likely to adopt restrictive labour policies as union approval among middle and low earners increases, as government seeks to “target” union supporters and potential members.
Data and measurement
The literature provides a number of competing expectations which can be tested empirically. Using all fifty states from 1992 through 2014, we model labour restrictiveness as a function of opinion, unionisation, and party control. In what follows, we discuss data sources, coding and use of dgMRP, as well as the limitations of our data.
Labour policy restrictiveness
Our dependent variable is a standardised factor score (mean = 0, SD = 1) with high values indicating highly restrictive labour policy and low values indicating less restrictive labour policy. We refer to this variable as labour policy restrictiveness. We opt for a factor score because composite measures of state policies provide methodological advantages, such as reduction of measurement error if the indicators tap into a single latent variable (Caughey, Xu and Warshaw Reference Caughey, Xu and Warshaw2017) and because doing so is common in similar studies assessing the role of opinion, party and stakeholders in shaping state-level policy (Erikson, Wright and McIver Reference Erikson, Wright and McIver1993; Witko and Newmark Reference Witko and Newmark2005; Caughey and Warshaw Reference Caughey and Warshaw2018).
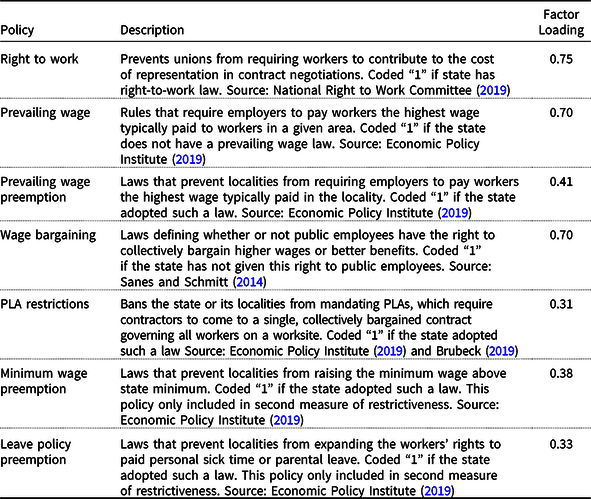
To construct this variable, we collected whether each state had adopted five common labour policies that govern unions: right-to-work, prevailing wage, prevailing wage preemption, wage bargaining and PLA restrictions. These policies are tracked by several think tanks and were the focus of recent qualitative work on restrictive labour policy (Lafer Reference Lafer2017). A more detailed description of each policy and the data source is presented in Table 1.
Labour policies and coding scheme for measuring restrictiveness
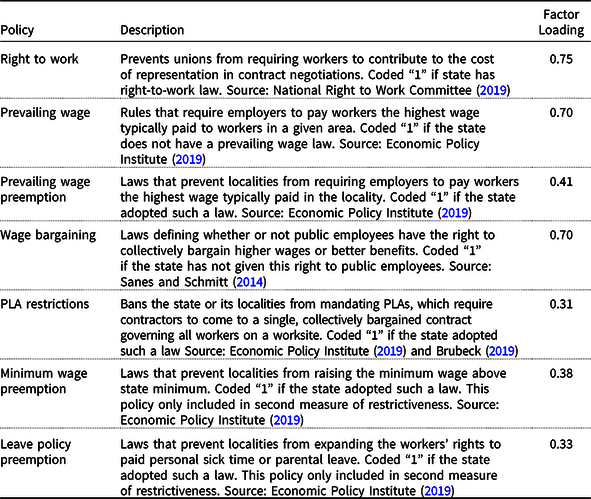
Note: Eigenvalue = 1.80. Cronbach’s α = 0.72.
For each policy, if a state had the restrictive version of the policy, it is coded as “1”. For example, having right-to-work would be a “1”, but allowing wage bargaining for public sector workers would be a “0”. This coding mirrors Witko and Newmark (Reference Witko and Newmark2005) measurement of pro-business policy in the states. Next, we perform factor analysis to obtain individual factor loadings. The results demonstrate that the policies load on a single factor, with a relatively large eigenvalue of 1.80, and is internally consistent with a Cronbach’s alpha of 0.72. Following Witko and Newmark (Reference Witko and Newmark2005), we take the individual factor loadings (see Table 1) and use it to weight each policy. These weighted values are summed to get an overall factor per state year. Finally, we subtract the mean and divide by the standard deviation to standardise the measure.Footnote 5
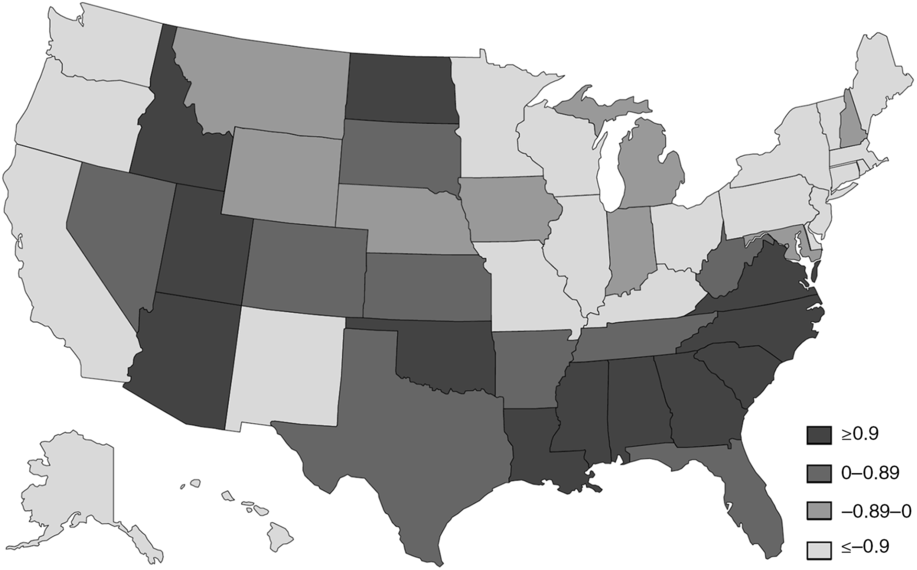
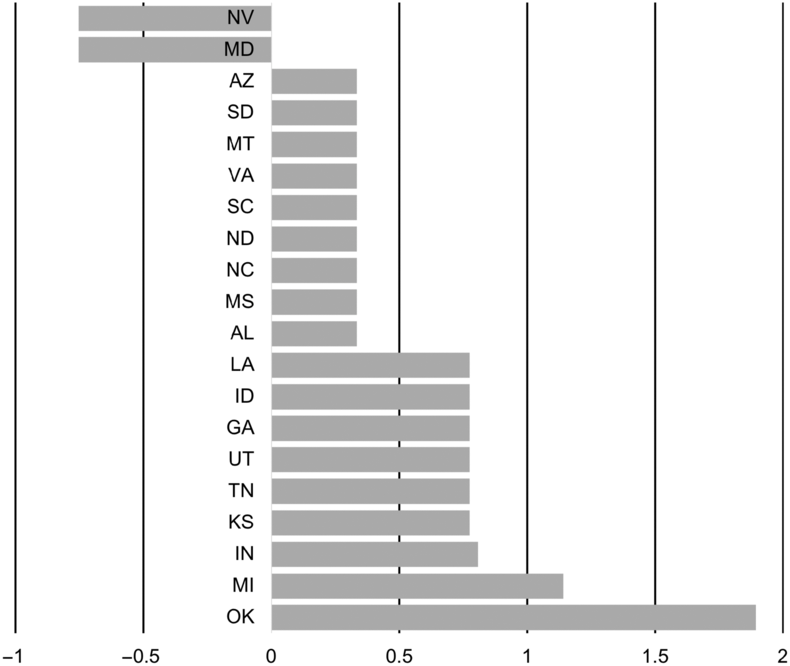
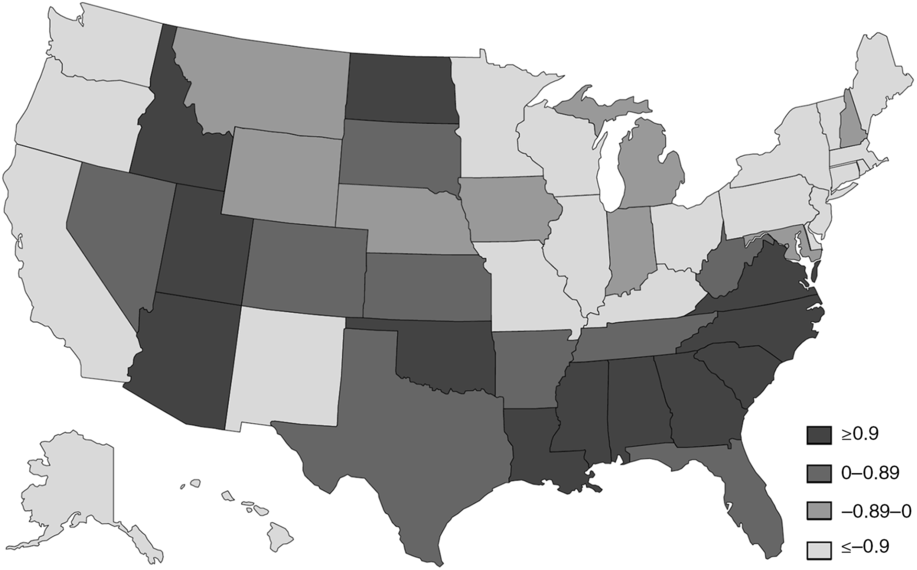
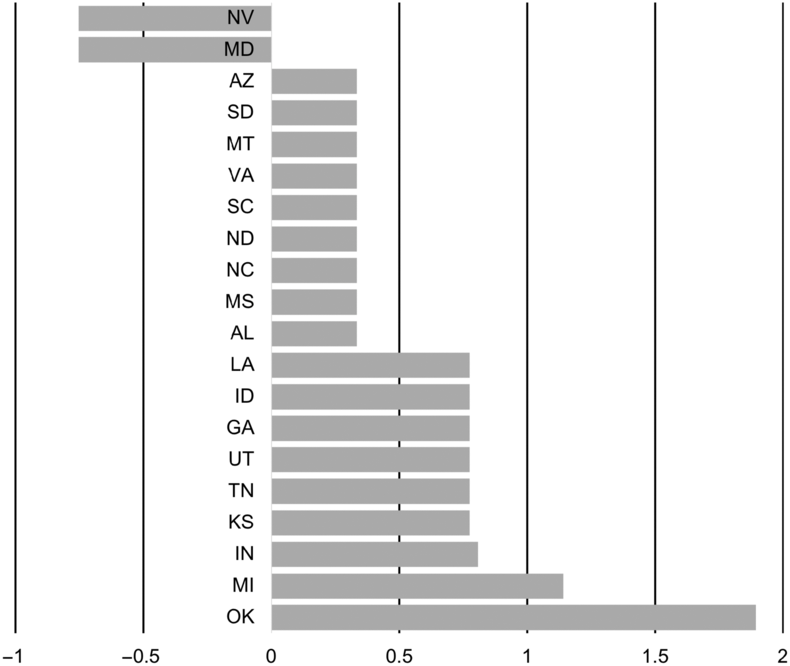
Figure 1 is a map of the average labour policy restrictiveness from 1992 to 2014 for the 50 states, and there is clear variation across the states. Figure 2 shows states that have changed in restrictiveness. 18 states have grown increasingly restrictive over time by adding at least one of the five policies (weighted by factor loadings). These states are mostly in the south, with some exceptions. Michigan and Indiana, states with large labour movements and traditionally pro-labour policy, shift substantially towards the restrictive end of the scale. Indiana adopted a right-to-work law in 2012, the same year that Michigan adopted right-to-work and PLA restrictions. Oklahoma saw the largest change, becoming more restrictive after repealing its prevailing wage law in 1995, adopting right-to-work legislation in 2002 and restricting PLAs in 2012. Only 2 states became less restrictive (Maryland and Nevada), while 30 others stayed the same.
Labour policy restrictiveness, 1993–2014.
Change in labour policy restrictiveness over time.
Note: Absent states did not experience change in labour policy restrictiveness from 1992 to 2014.
Union support by income thirds
One way to determine public opinion of a state population is to combine polls until the samples are large enough to make valid inferences about the states. Previous work gathered existing polls and disaggregated them to the state level (Erikson, Wright and McIver Reference Erikson, Wright and McIver1993). But, because we are interested in changes to labour policy over time, a stationary measure of public opinion is inadequate for proper modelling.
To estimate support for unions in each state, we use a dgMRP described by Dunham, Devin and Warshaw (Reference Dunham, Devin and Warshaw2016). DgMRP takes information gathered through national opinion polls about a respondent’s demography and geography and estimates opinion for subnational units, like states. Respondents are then weighted based on their percentage in census data. Through this method, we arrive at more accurate estimates of state-level public opinion than from simple averages by state (Kastellec et al. Reference Kastellec, Lax and Phillipsn.d.; Lax and Phillips Reference Lax and Phillips2009; Park, Gelman and Bafumi Reference Park, Gelman and Bafumi2004; Warshaw and Rodden Reference Warshaw and Rodden2012; Pacheco Reference Pacheco2013). This method of data aggregation generally produces more accurate results (Warshaw and Rodden Reference Warshaw and Rodden2012)Footnote 6 . We collect all available national public opinion polling that asks questions on labour favourabilityFootnote 7 and state of residence. In total, we have over 47,400 respondents across 50 states and 23 years. A more thorough discussion of the polls, questions, and model used to estimate the dgMRP is included in the Supplemental Information.
In the first stage of this model, we determine labour support using race, income, year surveyed and geographic location. Income is measured in thirds by coding respondent into the bottom 33%, middle 33% or top 33% of their state’s income distribution, similar to previous studies (Rigby and Wright Reference Rigby and Wright2013).Footnote 8 Models predicting individual union support are simulated 2,500 times.Footnote 9 In the second stage, we make a prediction for each race and income category based on the proportion of that population in the state year. The estimates are weighted by actual state-level proportions generated from the Current Population Survey. We divide race into two categories, White and non-White, and use income thirds. Together, there are six distinct groups in each state and year.
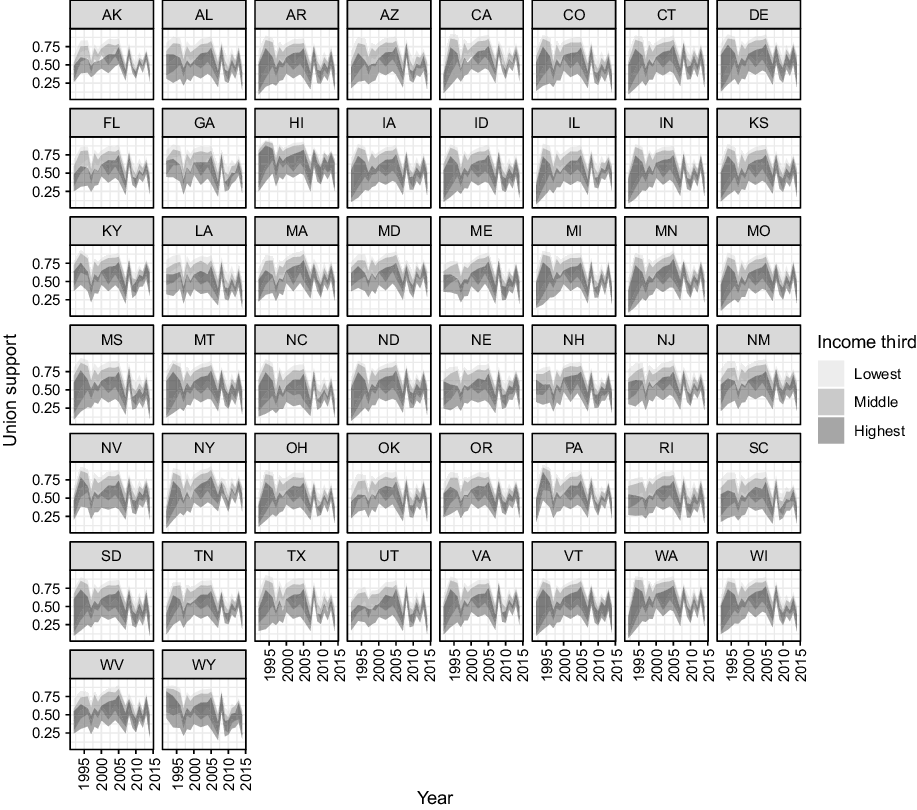
Figure 3 shows the poststratified predictions by income third for each state. Each ribbon is the 95% interval for our data, acknowledging that there is some uncertainty in our predictions. While there are similarities across each plot, the states vary in both pattern and the overall spread of the data. In general, low-income people in every state tend to have higher opinions of organised labour than higher income people. Over time, as data get more abundant, we see income thirds growing closer together. However, for many of these plots, the general pattern is fairly flat, and positive, over time. In California, for example, the line of support tends to slope slightly upwards over time. In Alabama and Wyoming, the line trends downwards.
Support for unions by income thirds.
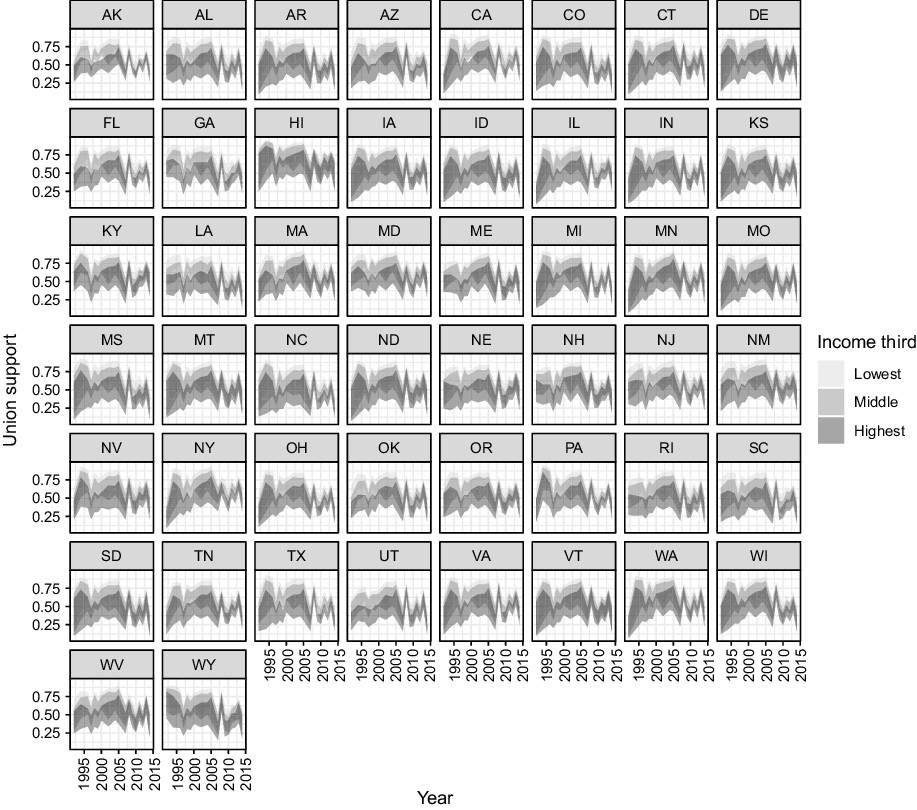
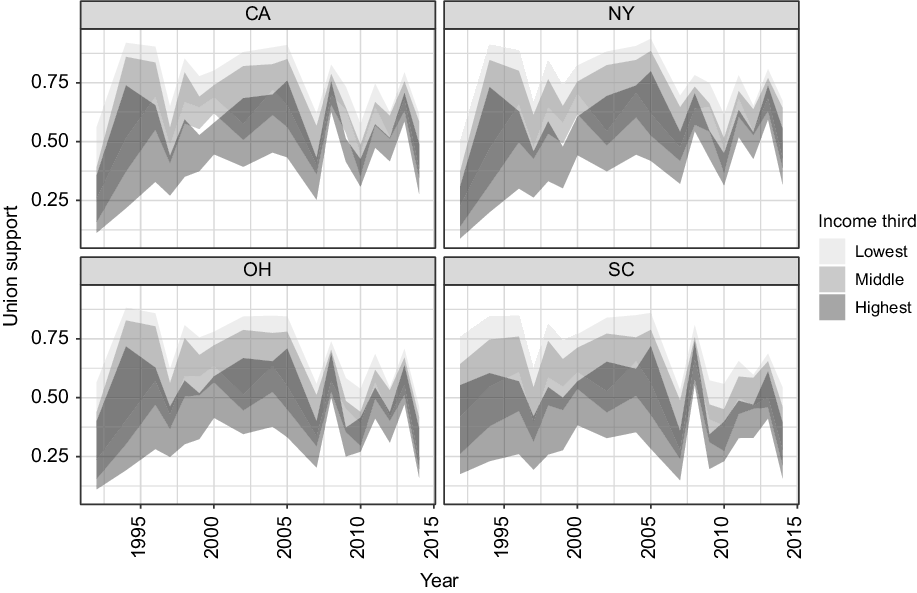
Figure 4 presents levels of union support over time in four states: CA, NY, OH and SC. These states vary regionally, in levels of historic unionisation and in existing labour policy. Income groups tend to trend similarly, with a drop in one group leading to declines in others. However, high-income groups are always less likely to support organised labour, though in some states, like New York, the line of support trends upward. In Ohio, on the other hand, the line remains consistently flat. Low-income and middle-income people are often closely clustered in their opinion, whereas higher income people are much lower.
Support for unions by income thirds in four states.
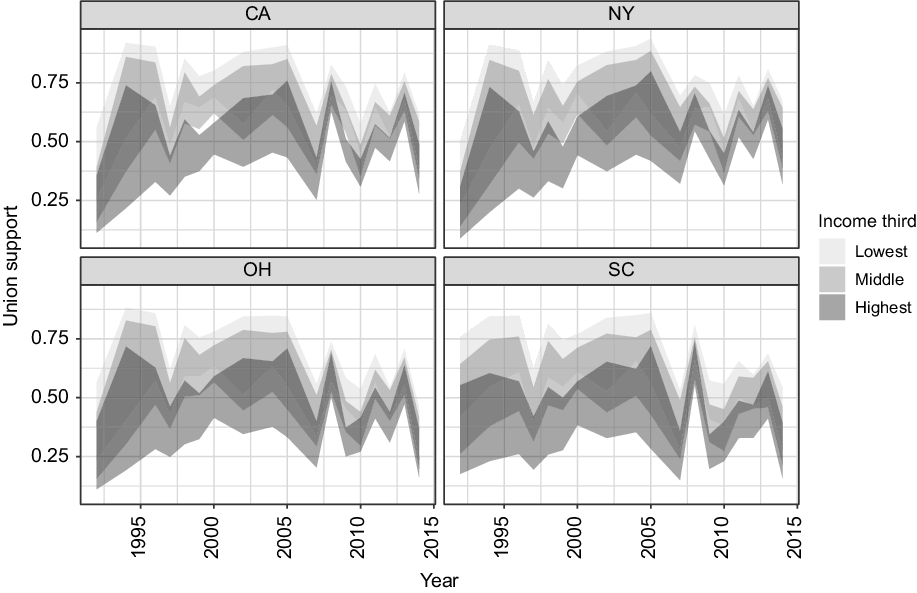
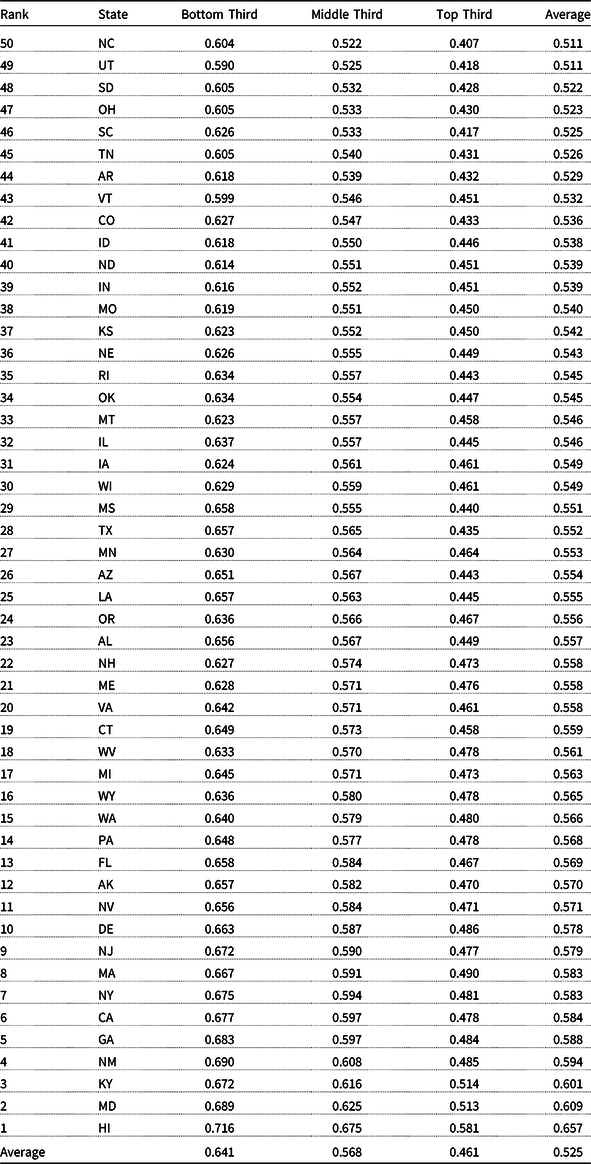
Table 2 ranks the states by levels of support across years. Overall, the individuals in the lowest income third are always more supportive of labour than the other income thirds in their state. High-income people always demonstrate the lowest levels of support. This result is consistent with our expectation that low-income and high-income people are unlikely to hold congruent opinions on labour policy. In fact, in almost all states, a majority of the middle- and low-income people approve of unions while a majority of wealthy income people disapprove of unions. Because of majority support among two-thirds of the population, overall support for organised labour is consistently above 0.5. Upper income groups are still fairly high, with average opinion around 0.45 in most states. Hawaii, Maryland and New York all have the highest levels of support across income groups, whereas South Carolina, Utah, South Dakota and Ohio all have among the lowest levels. Consider for a moment Ohio, a state that has historically had high levels of unionisation, but ranks among the lowest levels of support for labour. This is largely due to the gap between high-income and low-income groups being so vast: it is a polarised state in opinion towards labour. Other states exhibit similar polarisation such as Indiana, Missouri and Wisconsin. Georgia, for example, is one of the most restrictive states in terms of labour policy but exhibits wide support for labour on average.
Labour support by income third, sorted lowest to highest on average labour support
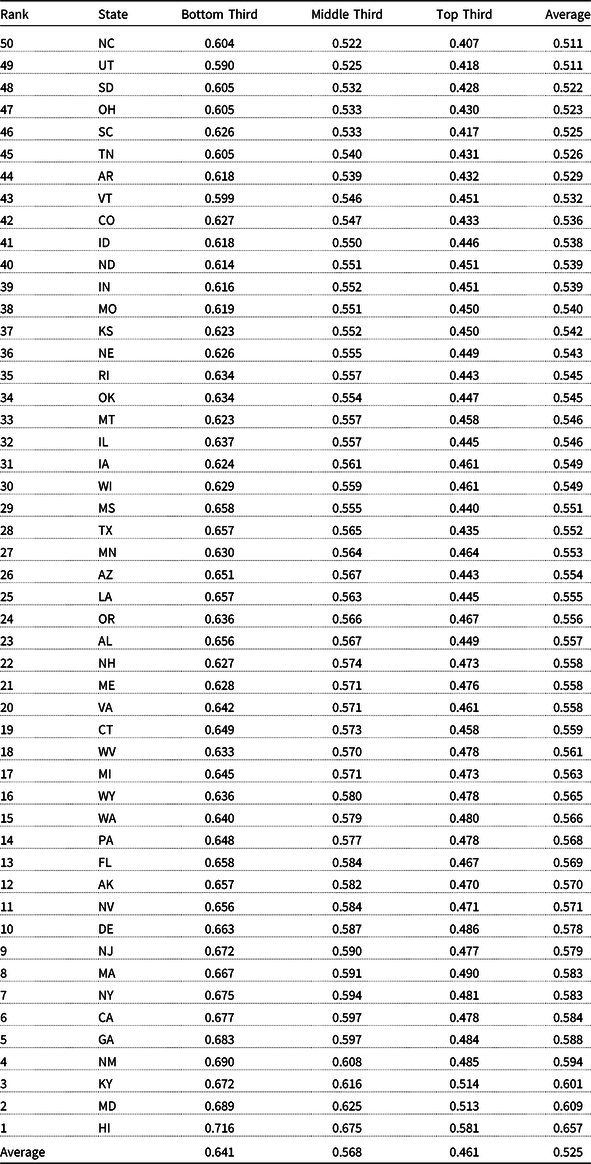
Note: Level of support is estimated in each state year using 1,500 simulations. Responses are weighted by racial and income composition of a state in a given year. This table averages across each state year estimate.
Other independent variables
First, we include a measure of Republican Party control (1 if Republicans control the governorship and both chambers of the legislature, 0 otherwise). We expect that unified Republican control will produce more restrictive labour policy. We also interact GOP party control with each opinion measure to test the conditional relationships we expect.
Second, we control for total unionisation rate in a state, coded from the Current Population Survey by Hirsch and Macpherson (Reference Hirsch and Macpherson2003), as a measure of state union strength. We include this in the model and interact it with GOP control to test whether unionisation moderates the relationship between party control and adoption of labour restrictions. We also break the measure into private sector unionisation and public sector unionisation, also using data from Hirsch and Macpherson (Reference Hirsch and Macpherson2003), to examine if there are differences by union type, since public sector unionisation has arguably been a stronger subject of targeting by GOP state governments (Lafer Reference Lafer2017; Kane and Newman Reference Kane and Newman2019).
As a measure of the presence of conservative policy networks in the state, we include a measure of whether Americans For Prosperity (AFP) established an office with a full-time director in the state (1 if yes, 0 if no). This measure was developed by Skocpol Hertel-Fernandez (Reference Skocpol and Hertel-Fernandez2016) for use in a similar application. We expect this variable to be a positive predictor of the adoption of labour restrictions.
Finally, also following Skocpol and Hertel-Fernandez (Reference Skocpol and Hertel-Fernandez2016), we control for the unemployment rate in the state, as governments may be wary to adopt new restrictions on labour unions and workers during an economic downturn, regardless of party in power or public opinion. This is measured as the percent of workers unemployed in each state. We expect this variable to have a negative affect on labour policy restrictiveness.
Modelling strategy
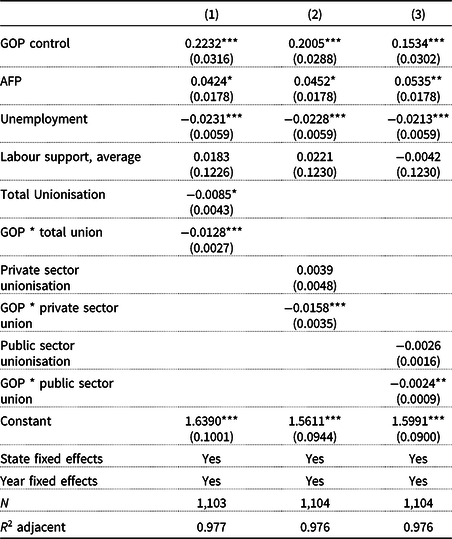
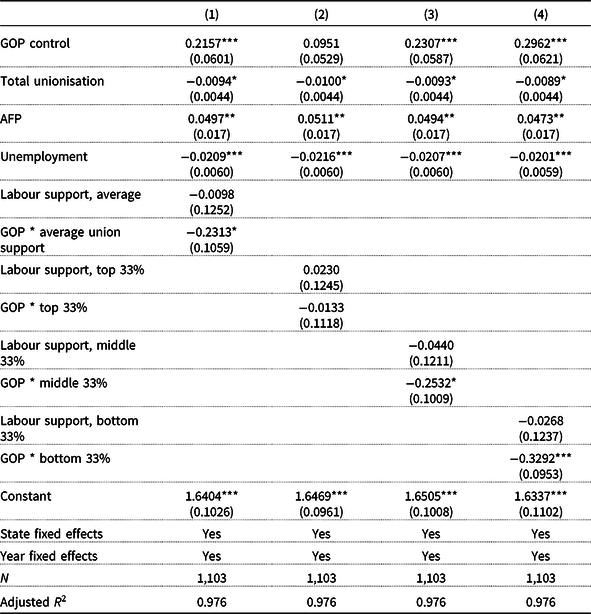
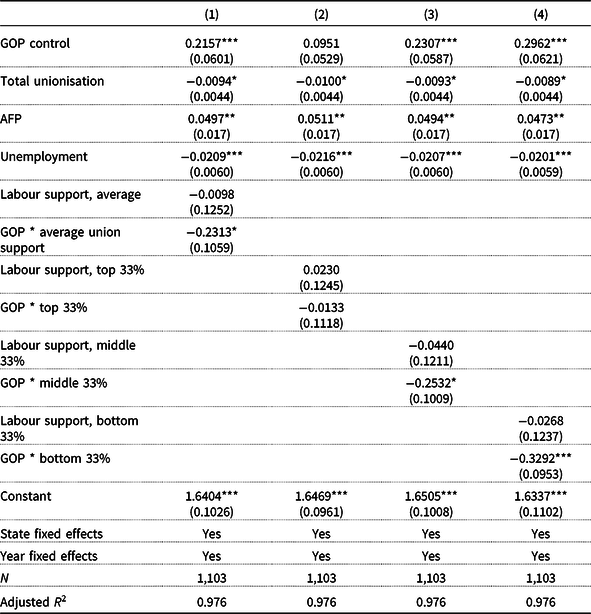
To test our expectations, we estimate a series of two-way fixed effects (for state and year) regression models. In Table 3, we present three models examining the conditional relationship between party control, different measures of unionisation and labour policy restrictiveness, while controlling for average labour support, AFP presence and unemployment. In Table 4, we present four models examining the relationship between party control, different measures of public opinion and labour policy restrictiveness, while controlling for total unionisation, AFP presence and unemployment.
Effect of party control and unionisation on labour policy
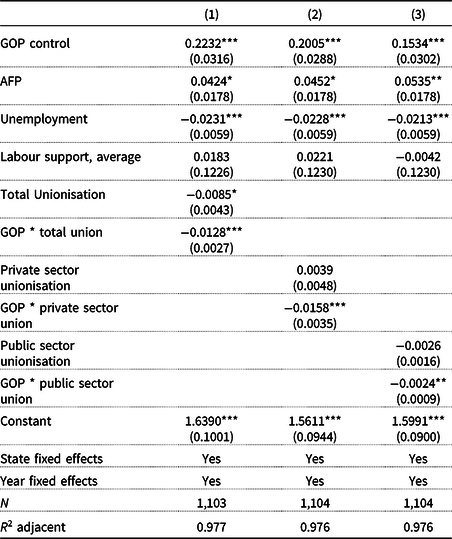
Note: Standard errors in parentheses.
*p < 0.05, **p < 0.01, ***p < 0.001.
Effect of party control and public opinion on labour policy
Note: Standard errors in parentheses.
+p < 0.10, *p < 0.05, **p < 0.01, ***p < 0.001.
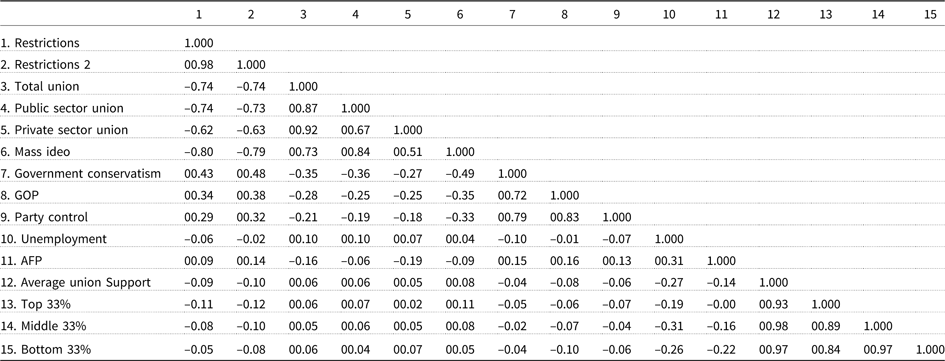
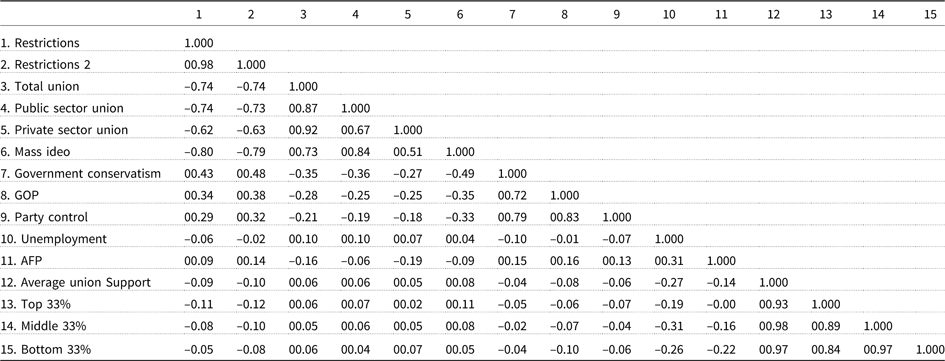
Although some studies include all measures of opinion in one model to assess relative influence over policy (Flavin Reference Flavin2012; Rigby and Wright Reference Rigby and Wright2013; Gilens and Page Reference Gilens and Page2014), one of the downsides of this strategy is the introduction of potentially high multicollinearity into regression models which can produce inefficient estimates and “flip” the direction of the estimated effect if the covariates are positively correlated. This is a potential problem for our study because the opinions of the lower income third and middle-income third are correlated at r = 0.97, middle and top income third are correlated at r = 0.89 and the lower and top income third are correlated at r = 0.84. Similarly, total unionisation and private sector unionisation are correlated at r = 0.92, total and public sector unionisation are correlated at r = 0.87 and public and private sector unionisation at r = 0.66.Footnote 10 Thus, we run separate models for each public opinion measure and each unionisation measure.
Results
The models in Table 3 conform to our expectation that unified Republican governments are more likely to enact restrictive labour policy. Unified Republican governments are statistically more likely to adopt more restrictive labour policies than other governments, all else equal. Since the dependent variable is standardised, the coefficient estimates can be interpreted as standard deviation changes. Across all three models in Table 3, Republican governments are associated with labour policies that are from about 15 to 23% of a standard deviation more restrictive than other governments. The results are significant across all three models and are also positive and significant and of similar size in four of the five models in Table 4.
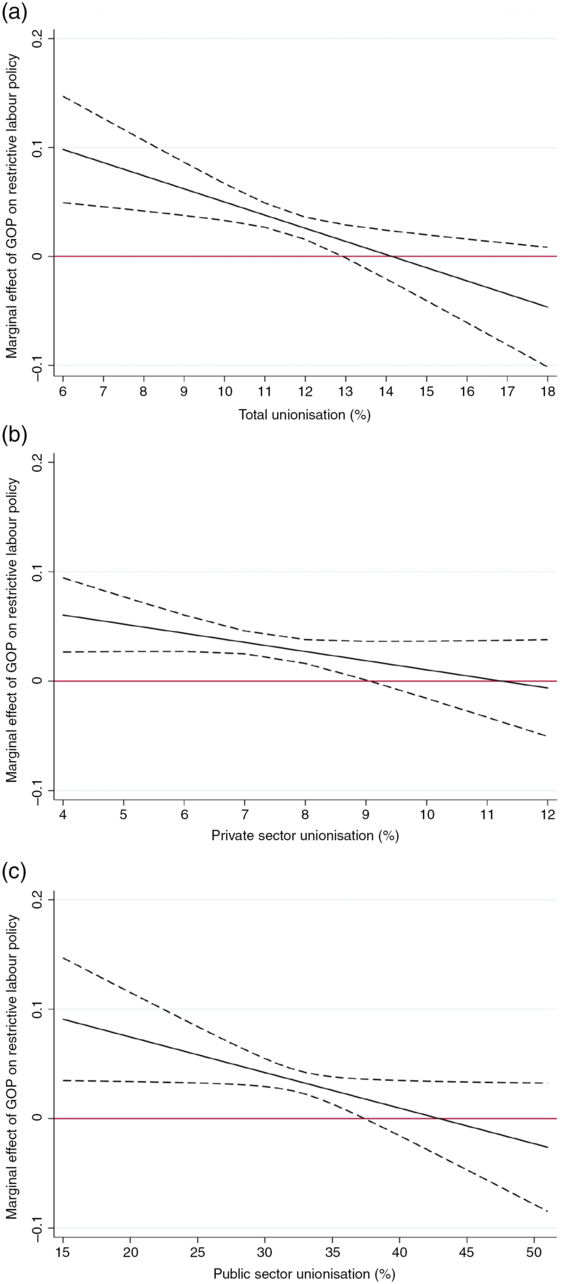
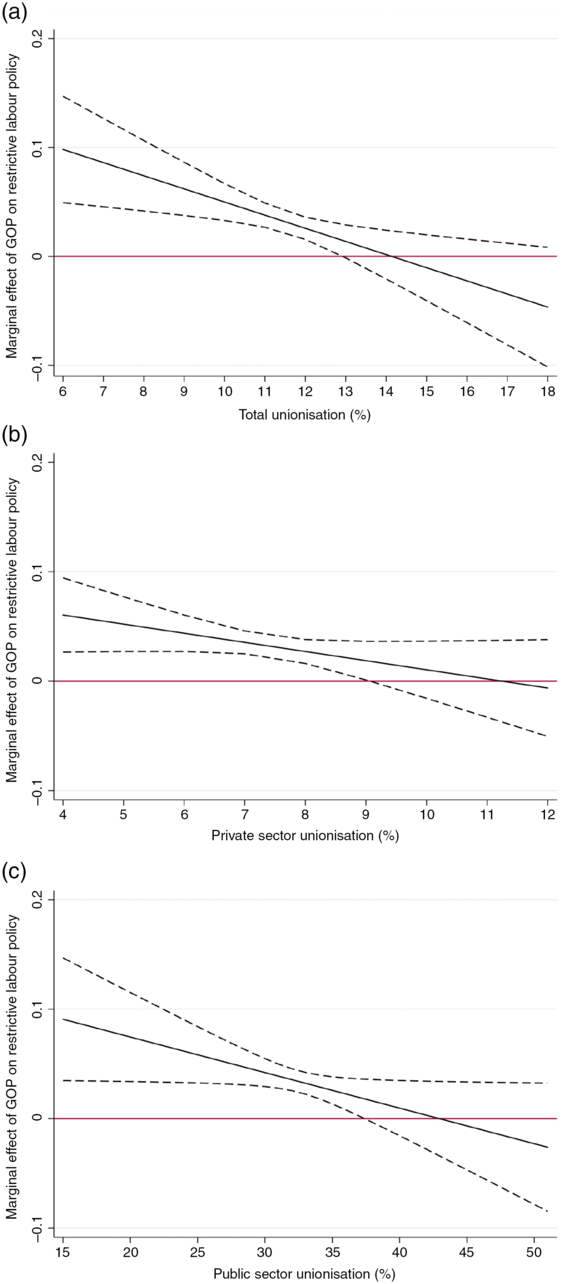
We also expected an indirect, inverse relationship between unionisation and labour policy restrictiveness. The models yield support for this expectation. Model 1 shows that Republican governments are actually less likely to enact restrictions where unionisation is high and this relationship holds for private sector unionisation (Model 2) and public sector unionisation (Model 3), respectively. In this way, unions of all stripes act as a check against labour policy restrictions being adopted, albeit indirectly, when state government is under unified Republican control.Footnote 11 Put differently, Republicans are responsive to the political landscape in their state: where public and private sector unions are strong, Republicans are less likely to enact restrictions.
This effect is depicted in Figure 5. Subfigure (a) shows is that in states with low total unionisation (around 5% union membership), unified Republican governments are associated with labour policy that is 0.15 of a standard deviation more restrictive than average, but this effect wanes at higher levels of total unionisation (around 15% union membership). A similarly sloped marginal effect is present in subfigures (b) and (c) for private sector unionisation and public sector unionisation, respectively. At mid and low levels of unionisation Republican governments are much more likely to enact labour policy restrictions but are no more likely than divided or Democratic-controlled governments to enact them when unionisation is high.
Effect of GOP control on labour restrictions by unionisation. (a) Total unionisation. (b) Private sector unionisation. (c) Public sector unionisation.
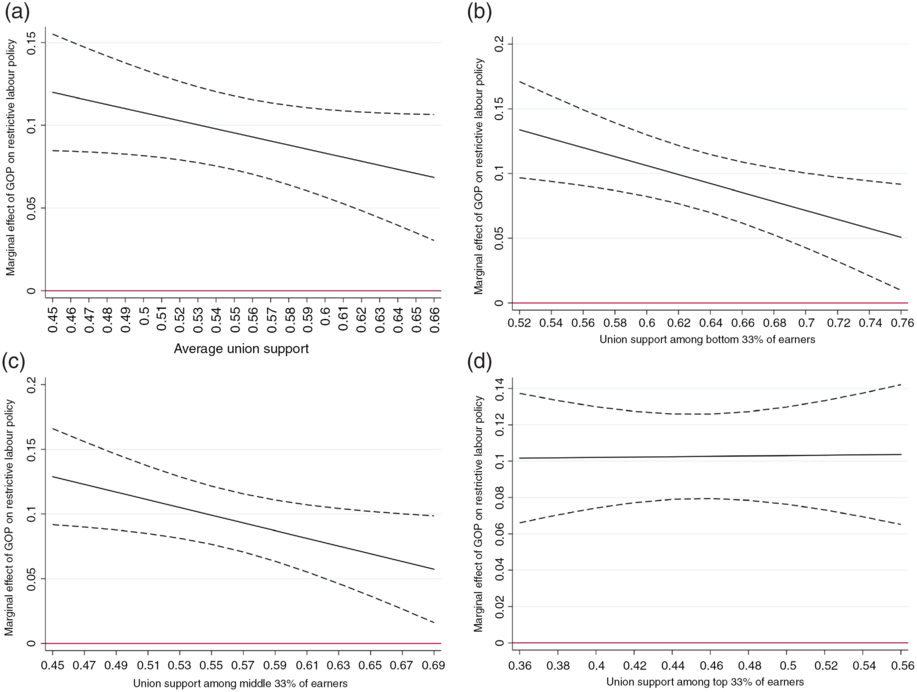
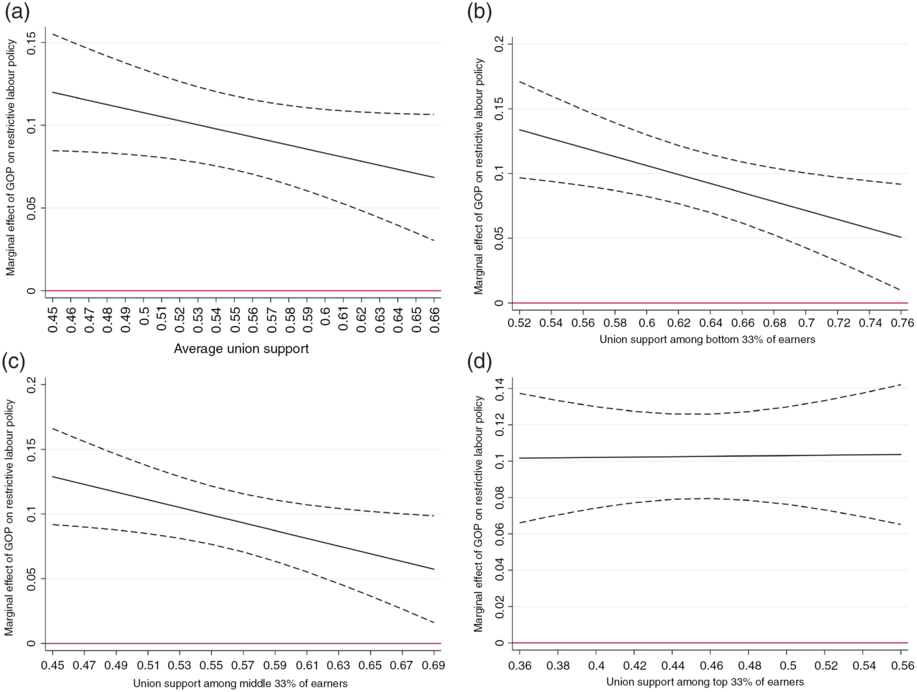
We see a similar and perhaps surprising pattern of responsiveness across the models in Table 4. Model 1 shows that the interaction between Republican control and public support for unions is negative and significant, meaning Republicans become less likely to enact restrictions as union support among the public increases. Breaking union support down by income thirds, as we do in Models 2, 3 and 4, we see that unified Republican governments are less likely to move labour policy in a restrictive direction when union support among middle- and lower income individuals is high. There is no significant effect for top earners’ opinions on Republican efforts on labour policy restrictiveness.
These marginal effects are also depicted in Figure 6. The marginal effect curve for top earners in particular is surprising, as we expected that higher (lower) support for unions among top earners would discourage (encourage) Republicans to enact more restrictions. Instead, there is a flat relationship across all values of union support among top earners. Unified Republican governments (i.e. those most interested ideologically in moving labour policy in a more restrictive direction) are less likely to do so if union support is high among lower and middle-income earners, indicating some responsiveness to the mass electorate. With labour opinion divided by class in the vast majority of states, these models suggest that labour policy is one area where the opinions of the wealthy do not have as strong a sway over policy as has been recently found (Bartels Reference Bartels2008; Gilens and Page Reference Gilens and Page2014; Flavin Reference Flavin2012).
Effect of GOP control on labour restrictions by public opinion. (a) Average public support for unions. (b) Bottom earners. (c) Middle earners. (d) Top earners.
Additional results
Across all seven models in Tables 3 and 4, the AFP indicator was a positive and significant predictor of states having more restrictive labour policy. That is, the more established the conservative policy and political network in the state, the more likely the state is to having more restrictive labour policy. Additionally, unemployment is a consistently negative and significant predictor of states that have less restrictive labour policy. These results are in the expected direction and consistent with previous research (Skocpol and Hertel-Fernandez Reference Skocpol and Hertel-Fernandez2016).
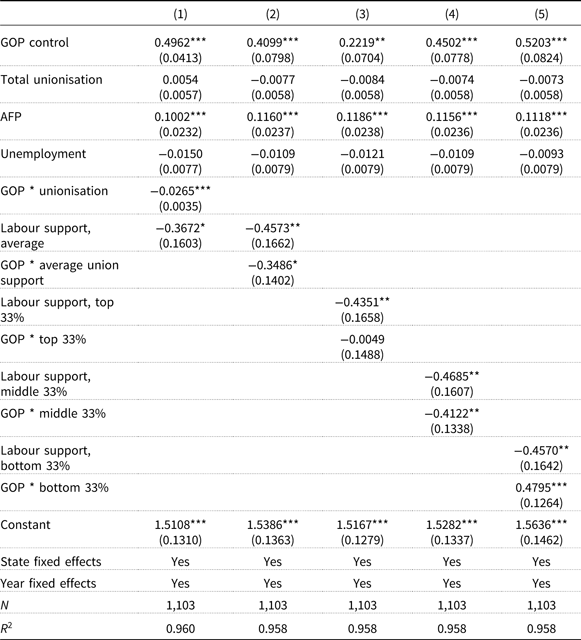
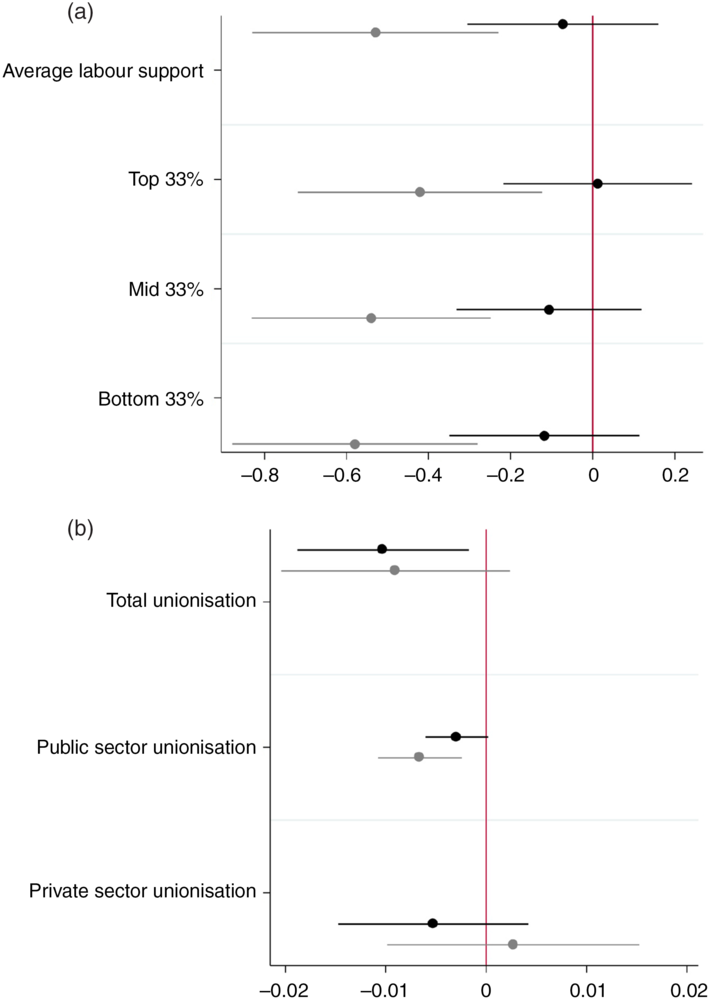
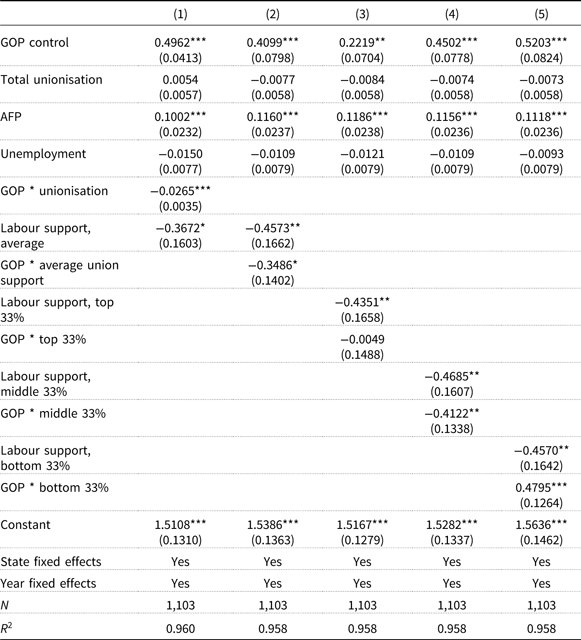
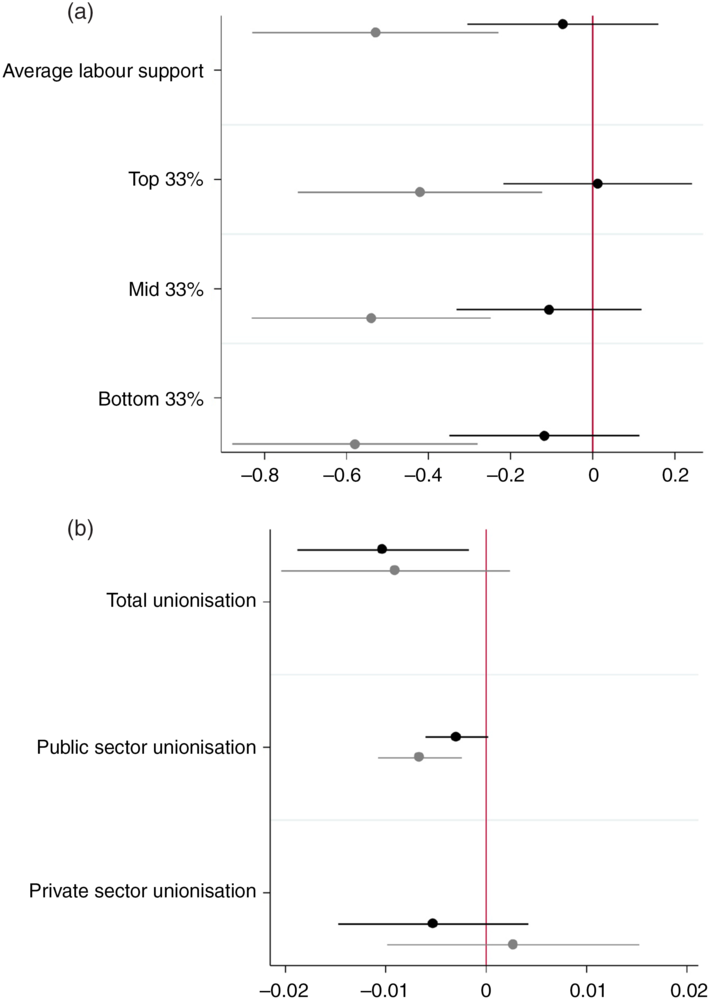
One criticism may be that our dependent variable is overly narrow and focused only on the policies that most directly affect labour unions, even though unions are often seen as advocates for workers’ wages, benefits and rights broadly (Ahlquist and Levi Reference Ahlquist and Levi2013). The principle reason we did this is because our opinion measure is focused on people’s opinions of unions, not workers’ rights more generallyFootnote 12 , and we wanted the two measures to correspond. To see if the results are robust to broader definitions of labour policy, we developed an alternative measure that included two important policies that affect workers individually: minimum wage preemption and Family and Medical Leave Act (FMLA) expansion preemption (see Table 1 for more information). These policies were included in the index, weighted by their factor score, and the index was standardised according to the same procedure outlined above. We then reestimated five models from aboveFootnote 13 which are presented in Table A.1 in the Appendix. Using this broader index of restrictive labour policy, we obtained similar results for each of the five models, with the notable exception being that we find support for a direct, negative and significant effect of public support for unions and labour policy restrictiveness across all measures of public opinion.
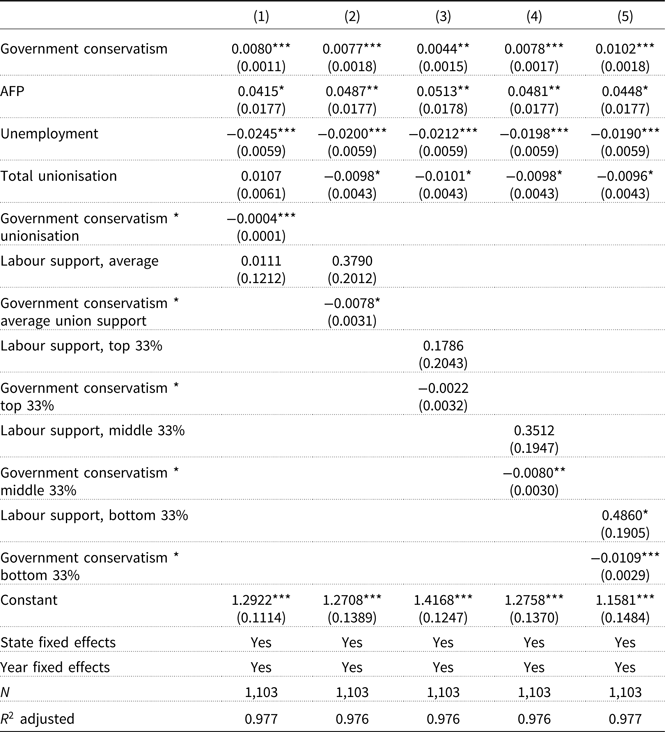
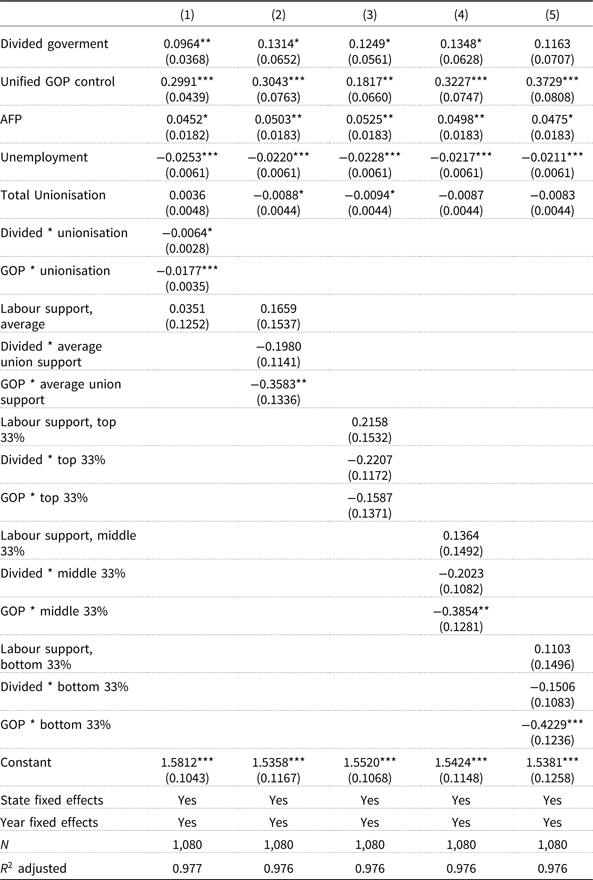
We also reestimated these five models using government conservatism as an alternative measure of GOP control.Footnote 14 The results are presented in Table A.3 in the Appendix and provide consistent results. We also turned our dichotomous measure into a trichotomous measure of party control that included divided government.Footnote 15 The results are in Appendix Table A.4. We find that a larger effect of GOP control – 18–35% of a standard deviation more restrictive – and otherwise similar results.
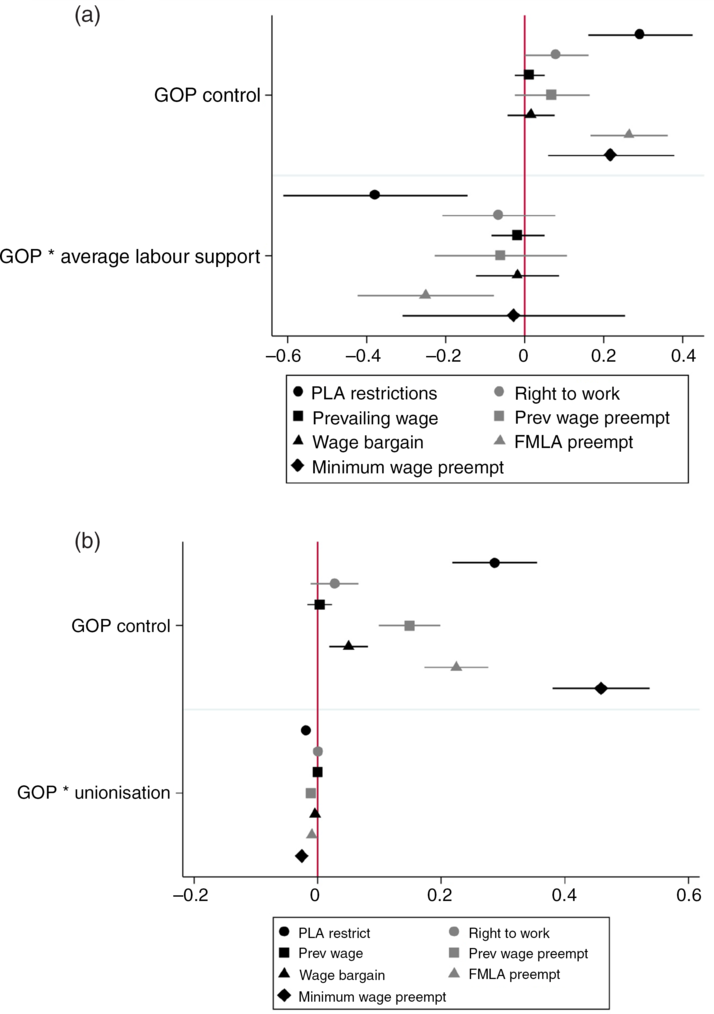
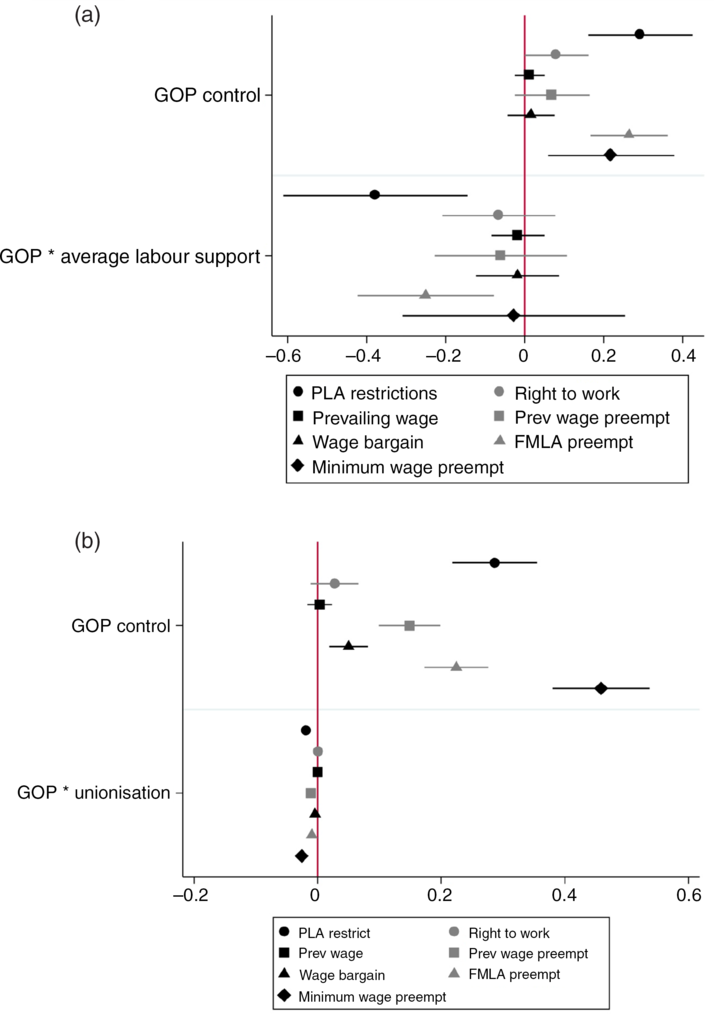
Finally, we also reestimated the models for total unionisation and average labour support for each individual labour policy rather than using a standardised index as the dependent variable. The results are presented in a coefficient plot in Figure A.2. The coefficients for GOP control, the interaction of GOP control and average labour support, and the interaction of GOP control and total unionisation are in the expected direction in all models. GOP control is significant at the p< 0.05 level for models of PLA restrictions, right to work, prevailing wage preemption, wage bargaining, FMLA preemption and minimum wage preemption, while the interaction term on GOP control and total unionisation is significant in the PLA restrictions, wage bargaining, prevailing wage preemption, FMLA preemption, and minimum wage preemption models, and the interaction term on GOP control and average labour support is significant in the PLA restrictions and FMLA preemption models. These are remarkably consistent results with differences in significance seemingly due to frequency in the adoption of these policies over the time period studied.
Conclusion and implications
In this article, we examine why some states adopt restrictive labour policies and others do not. When the Republican Party controls state government, GOP legislators enact the types of policies that they support, which have traditionally been and continue to be more restrictive policies on workers. But, Republicans are less likely to do so when unions are strong and support for unions among the public is high. In fact, when unions are strong, Republicans are no different than Democrats in enacting labour restrictions. This result may be surprising to many who followed the dramatic labour protests in Wisconsin, or the adoption of right-to-work laws in the Rust Belt, but on average these events mask larger trends across the states on labour policy. Instead, the majority of new restrictions were adopted by Southern and Great Plains states with Republican governments, low unionisation and comparatively low support for unions. States like Oklahoma, Tennessee, Kansas, Idaho, and Louisiana were leaders in moving labour policy in a more restrictive direction over the past 20 years. In essence, labour restrictions happen in places that are already fairly restrictive, drawing less attention than restrictions in other states.
Consistently, our results demonstrate that Republican state governments will try to adopt more restrictive labour policy. Across all configurations of our models, GOP-controlled states maintain a high likelihood of adoption, as do states with well-organised conservative policy networks like AFP. Consistent with Hertel-Fernandez (Reference Hertel-Fernandez2018), the presence of pro-business conservative lobbies affect public policies in ways that may exacerbate economic inequality and provide adverse outcomes for low-income people. When unemployment is high, though, and perhaps labour policy is salient, the likelihood of adopting labour policy decreases.
Yet party goals are not the only factor leading to the adoption of labour policy. Public opinion in this policy arena matters, and Republican governments are less likely to adopt restrictive legislation where middle- and low-income union support is high. Previous scholarship had found that the wealthy are disproportionately influential in state and federal policymaking (Gilens and Page Reference Gilens and Page2014), but others have warned that this is only likely to extend to areas of policy where there are differences in the preferences of the wealthy and the poor (Flavin Reference Flavin2012; Soroka and Wlezien Reference Soroka and Wlezien2008; Gilens Reference Gilens2009). On labour policy, high- and low-income people tend to be polarised and, surprisingly, support for unions from middle- and low-income people checks Republican governments’ efforts to place restrictions on unions, while high-income opinion has no discernible effect. Even an alternative explanation from the social construction of target populations (Schneider and Ingram Reference Schneider and Ingram1993) failed to predict this outcome. The empirical results harken back to early scholars who found state governments to be responsive to average public opinion (Erikson, Wright and McIver Reference Erikson, Wright and McIver1993).
In producing this finding, we developed an original measure of labour union support by income group in states over time. This measure is consistently positive for middle- and low-income individuals over time. In all states and all years, the highest income third remains the least favourable towards organised labour. While we provide explanation and verification of the measure in the Supplemental Information, more should be done to study labour opinion itself, as excellent qualitative work has developed some expectations about rural resentment towards urban and public sector workers and their unions (Cramer Reference Cramer2016).
Our results are somewhat optimistic about the possibility of statehouse democracy. The public and organised interests have some mechanism to constrain state officeholders. Higher labour union membership can result in a lowered chance of policy adoption when the GOP is in charge. Moreover, public opinion also constrains GOP state governments from enacting new restrictions on workers’ right to organise. The connection between public opinion and public policy, especially when that opinion tends to correspond more to the average voter than an elite one, seems a welcome break in the literature of economic domination (Gilens and Page Reference Gilens and Page2014), incidental representation (Enns and Wlezien Reference Enns, Wlezien, Enns and Wlezien2011) and policy targeting (Schneider and Ingram Reference Schneider and Ingram1993).
This pattern may be heartening as organised labour’s membership is waning, but the question remains whether this mechanism is enough to prevent the drift towards more restrictive labour policy. Here we are less optimistic. Although our results suggest that even state governments inclined to enact restrictions have some understanding of union influence, this relationship cannot sustain itself indefinitely. Union support seems meaningless if there are few actual union members are doing work on the ground.
Without union members to mobilise against rollbacks of workers’ rights, and to shape public sentiment towards unions, it is unlikely that union support will mean much to most people. This renders unions and public support for unions a relatively weak check for determined governments to overcome. Wisconsin, after all, did adopt Act 10 over protestations of unions and their supporters and went on, after the scope of this study, to adopt right-to-work legislation.
The results also speak to the relationship between economic inequality and public policy. The adoption of restrictive labour policies can have a financial impact on the lives of low- and middle-income people. The effects of labour restrictions are concentrated both geographically and on to certain populations. The passage of restrictive labour policy seems more possible as unions lose members and public support for unions becomes more symbolic. The consequences will be felt most heavily by the working poor.
Supplementary material
To view supplementary material for this article, please visit https://doi.org/10.1017/S0143814X20000070
Data Availability Statement
Replication materials are available in the Journal of Public Policy Dataverse at https://doi.org/10.7910/DVN/F6CVMG
Appendix
Models of labour restrictiveness including min wage and FMLA preemption
Note: Standard errors in parentheses.
+ p < 0.1, * p < 0.05, ** p < 0.01, *** p < 0.001.
Correlations
Models with government conservatism as alternative measure of GOP control
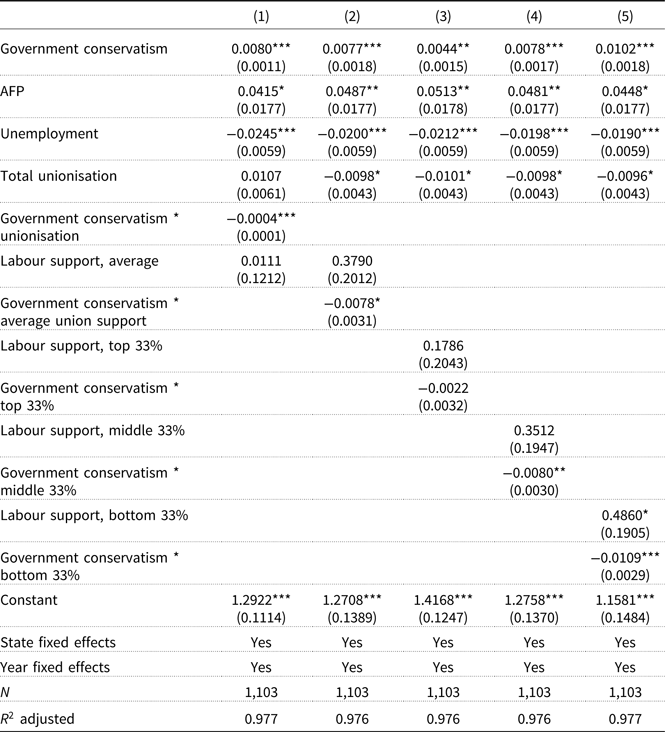
Note: Standard errors in parentheses.
*p < 0.05, **p < 0.01, ***p < 0.001.
Models with divided government and GOP control
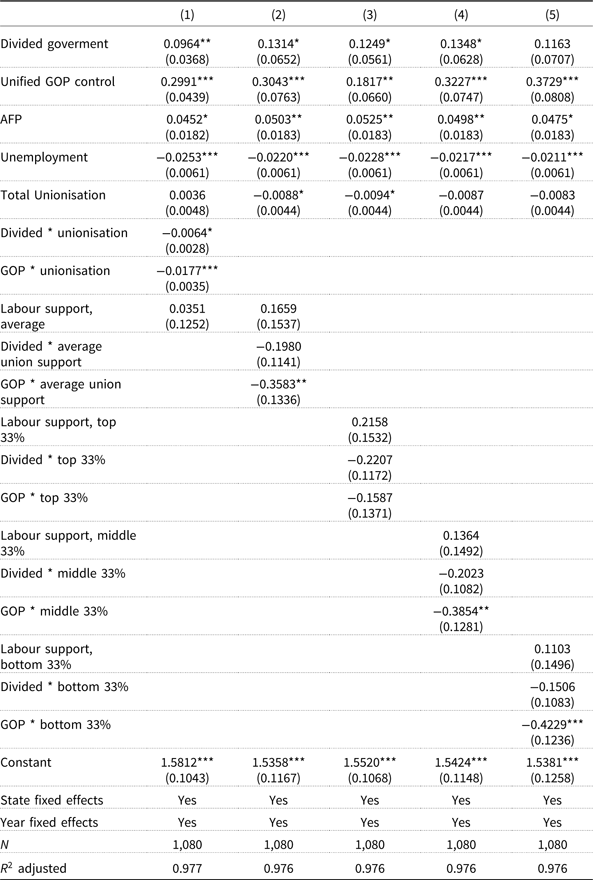
Note: Standard errors in parentheses.
*p < 0.05, **p < 0.01, ***p < 0.001.
Coefficient plot for direct effects of unionisation and public opinion. (a) Public opinion and labour policy restrictiveness. (b) Unionisation and labour policy restrictiveness.
Note: Black: DV = narrow measure of restrictiveness; grey: DV = broad measure of restrictiveness.
Coefficient plot of key variables for models of individual labour policies. (a) Party and public opinion. (b) Party and unionisation.