Implications
Here, we have characterized the tissues expression pattern and variability of the angiopoietin-like protein 3 (ANGPTL3) gene in native Chinese cattle. Four single nucleotide polymorphisms (SNPs) were identified in the coding and promoter region of ANGPTL3 gene. Two missense SNPs resulted in different predicted protein structures that may affect performance traits. Association analyses showed that four SNPs are associated with several economic traits, such as BW, hipbone width, Warner–Bratzler shear force and ribeye area. Exploitation of ANGPTL3 variants in cattle breeding programs is promising, providing that breed-specific effects are considered and further investigated.
Introduction
The angiopoietin-like proteins (ANGPTLs) are a family of secreted glycoproteins structurally similar to angiopoietins with specific roles in regulating lipid, glucose and energy metabolism (Arca et al., Reference Arca, Minicocci and Maranghi2013). ANGPTL3 is a liver secreted protein encoded by the ANGPTL3 gene (Conklin et al., Reference Conklin, Gilbertson, Taft, Maurer, Whitmore, Smith, Walker, Chen, Wattler, Nehls and Lewis1999b). ANGPTL3 plays a key role in lipid metabolism by increasing plasma lipids and high-density lipoprotein cholesterol (HDL-C) through the inhibition of lipoprotein lipase (Foka et al., Reference Foka, Karamichali, Dalagiorgou, Serti, Doumba, Pissas, Kakkanas, Kazazi, Kochlios, Gaitanou, Koskinas, Georgopoulou and Mavromara2014). A recent study has shown that human ANGPTL3 affects insulin sensitivity, free fatty acids (FFA) transport and plays an important role in the crosstalk between liver and adipose tissue (Arca et al., Reference Arca, Minicocci and Maranghi2013). Romeo et al. (Reference Romeo, Yin, Kozlitina, Pennacchio, Boerwinkle, Hobbs and Cohen2009) also noted that a genetic variation of ANGPTL3 was associated with the lowest quartile of blood glucose levels. Therefore, ANGPTL3 appears to have an important role in lipoprotein, FFA and glucose metabolism (Robciuc et al., Reference Robciuc, Maranghi, Lahikainen, Rader, Bensadoun, Öörni, Metso, Minicocci, Ciociola, Ceci, Montali, Arca, Ehnholm and Jauhiainen2013).
In human, ANGPTL3 is located on chromosome 1 (1p31.1-p22.3) and encodes a 460-amino acid protein. ANGPTL3 contains an N-terminal signal peptide that directs the proteins towards secretion, an N-terminal coiled-coil domain, a linker region and a C-terminal fibrinogen-like domain. The N-terminal region of ANGPTL3 is essential for the regulation of plasma triglyceride (TG) levels and the C-terminal portion has the ability to induce angiogenesis (Quagliarini et al., Reference Quagliarini, Wang, Kozlitina, Grishin, Hyde, Boerwinkle, Valenzuela, Murphy, Cohen and Hobbs2012). In humans, ANGPTL3 is predominantly expressed in liver, with minor expression in kidney (Lin et al., Reference Lin, Rao, Zha and Xu2013). Expression of ANGPTL3 could be modulated by the nutritional status (Sato et al., Reference Sato, Seol, Sato, Kamada and Akiba2008; Chen et al., Reference Chen, Bai, Mai, Cai, Liu, Wang, Xiao, Dong, Wang and Sun2012), ligands of nuclear receptors (Foka et al., Reference Foka, Karamichali, Dalagiorgou, Serti, Doumba, Pissas, Kakkanas, Kazazi, Kochlios, Gaitanou, Koskinas, Georgopoulou and Mavromara2014) and hormones (Fugier et al., Reference Fugier, Tousaint, Prieur, Plateroti, Samarut and Delerive2006).
In recent years, numerous efforts have been made to predict susceptibility to diseases on the basis of ANGPTL3 gene variations (Willer et al., Reference Willer, Sanna, Jackson, Scuteri, Bonnycastle, Clarke, Heath, Timpson, Najjar, Stringham, Strait, Duren, Maschio, Busonero, Mulas, Albai, Swift, Morken, Narisu, Bennett, Parish, Shen, Galan, Meneton, Hercberg, Zelenika, Chen, Li, Scott, Scheet, Sundvall, Watanabe, Nagaraja, Ebrahim, Lawlor, Ben-Shlomo, Davey-Smith, Shuldiner, Collins, Bergman, Uda, Tuomilehto, Cao, Collins, Lakatta, Lathrop, Boehnke, Schlessinger, Mohlke and Abecasis2008; Minicocci et al., Reference Minicocci, Montali, Robciuc, Quagliarini, Censi, Labbadia, Gabiati, Pigna, Sepe, Pannozzo, Lütjohann, Fazio, Jauhiainen, Ehnholm and Arca2012; Noto et al., Reference Noto, Cefalù, Valenti, Fayer, Pinotti, Ditta, Spina, Vigna, Yue, Kathiresan, Tarugi and Averna2012). Several single nucleotide polymorphisms (SNPs) near ANGPTL3 have been associated with plasma lipid concentrations in human. The ANGPTL3 rs12130333 polymorphism was strongly associated with Fredrickson hyperlipoproteinemia type 5 (Köster et al., Reference Köster, Chao, Mosior, Ford, Gonzalez-DeWhitt, Hale, Li, Qiu, Fraser, Yang, Heuer, Jaskunas and Eacho2005). ANGPTL3 rs11207997 was consistently associated with lower plasma HDL-C and apolipoprotein A-I levels in both adolescents and adults (Legry et al., Reference Legry, Bokor, Cottel, Beghin, Catasta, Nagy, Gonzalez-Gross, Spinneker, Stehle, Molnár, Moreno, Amouyel, Dallongeville and Meirhaeghe2009). ANGPTL3 rs2131925 was associated with a mean reduction in plasma TG levels (Teslovich et al., Reference Teslovich, Musunuru, Smith, Edmondson, Stylianou, Koseki, Pirruccello, Ripatti, Chasman, Willer, Johansen, Fouchier, Isaacs, Peloso, Barbalic, Ricketts, Bis, Aulchenko, Thorleifsson, Feitosa, Chambers, Orho-Melander, Melander, Johnson, Li, Guo, Li, Shin Cho, Jin Go, Jin Kim, Lee, Park, Kim, Sim, Twee-Hee Ong, Croteau-Chonka, Lange, Smith, Song, Hua Zhao, Yuan, Ja, Lamina, Ziegler, Zhang, Zee, Wright, Witteman, Wilson, Willemsen, Wichmann, Whitfield, Waterworth, Wareham, Waeber, Vollenweider, Voight, Vitart, Uitterlinden, Uda, Tuomilehto, Thompson, Tanaka, Surakka, Stringham, Spector, Soranzo, Smit, Sinisalo, Silander, Sijbrands, Scuteri, Scott, Schlessinger, Sanna, Salomaa, Saharinen, Sabatti, Ruokonen, Rudan, Rose, Roberts, Rieder, Psaty, Pramstaller, Pichler, Perola, Penninx, Pedersen, Pattaro, Parker, Pare, Oostra, O/’Donnell, Nieminen, Nickerson, Montgomery, Meitinger, McPherson, McCarthy, McArdle, Masson, Martin, Marroni, Mangino, PKE, Lucas, Luben, RJF, Lokki, Lettre, Langenberg, Launer, Lakatta, Laaksonen, Kyvik, Kronenberg, Konig, Khaw, Kaprio, Kaplan, Johansson, Jarvelin, Cecile, Janssens, Ingelsson, Igl, Kees Hovingh, Hottenga, Hofman, Hicks, Hengstenberg, Heid, Hayward, Havulinna, Hastie, Harris, Haritunians, Hall, Gyllensten, Guiducci, Groop, Gonzalez, Gieger, Freimer, Ferrucci, Erdmann, Elliott, Ejebe, Doring, Dominiczak, Demissie, Deloukas, de Geus, de Faire, Crawford, Collins, Chen, Caulfield, Campbell, Burtt, Bonnycastle, Boomsma, Boekholdt, Bergman, Barroso, Bandinelli, Ballantyne, Assimes, Quertermous, Altshuler, Seielstad, Wong, Tai, Feranil, Kuzawa, Adair, Taylor, Borecki, Gabriel, Wilson, Holm, Thorsteinsdottir, Gudnason, Krauss, Mohlke, Ordovas, Munroe, Kooner, Tall, Hegele, JJP, Schadt, Rotter, Boerwinkle, Strachan, Mooser, Stefansson, Reilly, Samani, Schunkert, Cupples, Sandhu, Ridker, Rader, van Duijn, Peltonen, Abecasis, Boehnke and Kathiresan2010). In another report, ANGPTL3 rs12042319 was associated with lower levels of low-density lipoprotein cholesterol, TG and IL-6 (Angelakopoulou et al., Reference Angelakopoulou, Shah, Sofat, Shah, Berry, Cooper, Palmen, Tzoulaki, Wong, Jefferis, Maniatis, Drenos, Gigante, Hardy, Laxton, Leander, Motterle, Simpson, Smeeth, Thomson, Verzilli, Kuh, Ireland, Deanfield, Caulfield, Wallace, Samani, Munroe, Lathrop, Fowkes, Marmot, Whincup, Whittaker, de Faire, Kivimaki, Kumari, Hypponen, Power, Humphries, Talmud, Price, Morris, Ye, Casas and Hingorani2012). These studies clearly showed there is a genetic link between ANGPTL3 and regulation of lipid metabolism, which suggested that variation in ANGPTL3 might affect its function.
The bovine ANGPTL3 gene is located on chromosome 3 and encodes a 459 amino acid protein. There is only one study concerning the bovine ANGPTL3 gene in Chinese cattle. Guan et al. (Reference Guan, Cai, Sun and Lu2010) found that ANGPTL3 is mainly expressed in the liver in Chinese Holstein cow. However, other studies showed that ANGPTL3 could be considered as a candidate gene for growth and meat quality traits in goats and pigs (Chen et al., Reference Chen, Bai, Mai, Cai, Liu, Wang, Xiao, Dong, Wang and Sun2012; Xiao et al., Reference Xiao, Wang and Sun2012a). Growth traits and meat quality traits are two of the most economically important traits in beef cattle production.
For traditional reasons, the Chinese called Bos taurus ‘yellow cattle’. Chinese yellow cattle can be divided into three categories: northern, central plain and southern yellow, based on their natural distribution and ecological conditions. Cattle of the central plain are the best type of yellow cattle due to their meat quality and appearance. Henan is often referred to as ‘central plains’, although the name is also applied to the entirety of China proper. Nanyang and Jiaxian cattle are local draught and meat cattle breeds that perform well and exist mainly in Henan. This resulted in tremendous improvements in two yellow cattle, particularly in relation to their body size, work ability and individual meat yield.
The aims of this study were to determine (i) the spatial expression of ANGPTL3 in Jiaxian cattle, (ii) detect SNPs in the bovine ANGPTL3 gene, (iii) predict if these SNPs result in detrimental effects to the protein structure and (iv) if there is an association of these SNPs with growth traits in 171 local yellow cattle of Henan province and carcass traits in 192 beef cattle. Initially, we identified the abundance of ANGPTL3 in Jiaxian cattle was highest in the liver. Additionally, four SNPs were discovered and two of these SNPs determined to potentially have detrimental effects on protein structure by causing amino acids substitutions. These four SNPs were also determined to be associated with growth traits (including: BW and hipbone width) and meat quality traits (including: Warner–Bratzler shear force (WBSF) and ribeye area (RA)).
Materials and methods
Animals and samples
Nine samples (heart, liver, spleen, lung, kidney, rumen, muscle, adipose tissue and testis) were collected from three 5-year-old Jiaxian bulls from the breeding farm of Jiaxian Cattle (Jiaxian County, Henan Province, P.R. China). For each tissue, three samples were collected within 30 min postmortem, immediately frozen in liquid nitrogen and stored at −80°C for spatial expression analysis.
We investigated the genetic variation in the bovine ANGPTL3 gene using 707 individuals representing 11 cattle breeds in China. Blood samples were collected and genomic DNA was extracted from leukocytes according to a standard protocol (Sambrook and Russell, Reference Sambrook and Russell2001).
A total of 515 unrelated female cattle belonging to five yellow cattle breeds and Gaoyuan yak were randomly chosen from Chinese farms: Jiaxian cattle (JX, n=121), Luxi cattle (LX, n=123), Nanyang cattle (NY, n=139), Qinchuan cattle (QC, n=30), Bohai cattle (BH, n=35) and Gaoyuan yak (GY, n=67). Animals in every breeding farm were under the same forage and feeding management conditions. The animals were weaned at an average of 6 months age and raised on a corn-corn silage diet, according to nutrient requirements of growing heifers (NRC, 2000; Ma et al., Reference Ma, Chen, Li, Xu, Li, Li, Gao, Li and Shi2014). The NY animals were randomly chosen from the breeding center of Nanyang cattle (Nanyang city, Henan Province, P.R. China); the JX animals were randomly chosen from the breeding farm of Jiaxian cattle (Jiaxian county, Henan Province, P.R. China); the QC animals were randomly chosen from the breeding farm of Qinchuan cattle (Fufeng county, Shaanxi Province, P.R. China); the LX and BH animals were randomly chosen from the breeding farm of LX and BH cattle (Juancheng city, Shandong Province, P.R. China). These selection and breeding stations have been established since the 1950s for conserving the plentiful cattle genetic resources and accelerating genetic gain. Local enterprise and national standards have been drawn up for every cattle breed. Every year, superior cattle with best growth and work performance are identified for selection and the poor performers eliminated. Progeny testing, comprehensive selection index and Best Linear Unbiased Prediction methods were also used to identify superior sires. In the 1970s, artificial insemination stations were established in these Provinces in order to spread superior sires. Through these methods, selection progress of the growth performance and meat quality has accelerated at the local breeding stations.
In China, breeding farms of NY and JX cattle are two of the largest farms with complete production records. For the association study, a total of 171 NY and JX cows were recorded for growth traits, including BW recorded at birth, after 6 (weaning), 12, 18 and 24 months, body length, heart girth, hip height, hipbone width and average daily weight gain for four different growth periods (6, 12, 18 and 24 months). These traits were measured using previously described methods (Gilbert et al., Reference Gilbert, Bailey and Shannon1993).
For the association study, carcass and meat quality traits were recorded from 192 beef cattle (bullocks) of Angus (AG, n=48), Hereford (HF, n=15), Limousin (LM, n=25), Luxi (LX, n=28), Simmental (ST, n=52) and Jinnan (JN, n=24). Their average weight was 405±50.5 kg and average age at slaughter was 30±2 months. The individuals were reared in the provinces of Inner Mongolia and Hebei. Carcass and meat quality traits were measured according to the criteria of the GB/T17238-1998 Cutting Standard of Fresh and Chilled Beef in China (China Standard Publishing House). Six traits were measured or calculated: carcass weight (CW), dressing percentage, backfat thickness (BF), marbling score (MS), RA and WBSF. BF and RA were measured between the 12th and 13th rib. MS for quality grade was evaluated on a cross-section of the loin muscle between the 12th and 13th rib, and is scored on a scale of 1 to 5. Meat samples for measuring WBSF were taken from the interface between the 12th and 13th rib and were measured at 7 days postmortem. WBSF is the internationally accepted standard for the determination of tenderness and was used as our quantitative measurement (Shackelford et al., Reference Shackelford, Wheeler and Koohmaraie1999). All experimental procedures were performed according to authorization granted by the Chinese Ministry of Agriculture.
RNA extraction, cDNA synthesis and quantitative real-time PCR (qRT-PCR)
Total RNA was extracted from tissue samples using the RNAisoTM Plus reagent (TaKaRa, Dalian, China). Total RNA concentration and purity were checked by using a NanoDrop ND-1000 spectrophotometer (Nanodrop, Wilmington, DE, USA). RNA quality and integrity were confirmed using 2100 Bioanalyzer (Agilent Technologies, Palo Alto, CA) according to RNA integrity number. The first-strand cDNA was synthesized from 1 μg of total RNA using PrimeScriptsRT reagent Kit with gDNA Eraser (TaKaRa). The following protocol of reverse transcription was used: 37°C for 15 min, 85°C for 5 s and cooling at 4°C.
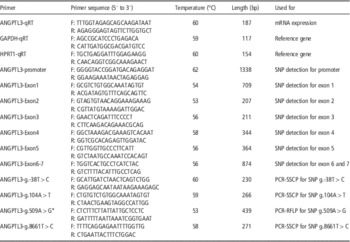
The expression levels of genes were quantified by SYBR Green I assay and qRT-PCR reactions were performed as two-step reactions in ABI 7300 (Applied Biosystems, Foster City, CA, USA; Ma et al., Reference Ma, Chen, Li, Xu, Li, Li, Gao, Li and Shi2014). Primers for ANGPTL3 were designed with Primer Premier 5.0 software (GenBank number NM_001080345.1). Hypoxanthine phosphoribosyl-transferase 1 (HPRT1; GenBank number NM_001034035) and glyceraldehyde-3-phosphate dehydrogenase (GAPDH GenBank number NM_001034034.2) were used as controls to normalize the differences among individual samples (Table 1). GAPDH was used as the internal control. Each sample was run in triplicate along with the internal control gene using a standard shuttle PCR protocol (95°C for 5 s, 60°C for 15 s and 72°C for 30 s) for 40 cycles. The geometric mean of the expression levels of GAPDH and HRPT1 were used to normalize the expression data (Vandesompele et al., Reference Vandesompele, De Preter, Pattyn, Poppe, Van Roy, De Paepe and Speleman2002). Gene expression results were calculated using the delta delta cycle threshold
 $$\left( {2^{{-\Delta \Delta } {{C_{t} }} } \right)$$
method. Expression levels were considered undetectable when the C
t
value of the targeted gene exceeded 35 in the sample tissues. Means±s.d. were calculated for each tissue type.
Primer pairs designed for the bovine ANGPTL3 gene

ANGPTL3=angiopoietin-like protein 3; SNP=single nucleotide polymorphism; SSCP=single strand conformation polymorphism; RFLP=restriction fragment length polymorphism.
* ANGPTL3-SNPg.509A>G: the pairs of primers for identifying mutations by HinfI restriction endonuclease. ANGPTL3-SNPg.509A>G R: GAAT-, G is the mismatch base.
Cloning and analysis of the bovine ANGPTL3 promoter
The 5′-flanking fragment upstream from the start codon was amplified using genomic DNA from a Jiaxian cow. The 5′-flanking DNA sequence was analyzed using Transcription Element Search Software (TESS; http://www.cbil.upenn.edu/cgi-bin/tess/tess; Xu et al., Reference Xu, Xu, Liang, Wang, Jin, Liu, Ma, Yuan, Song and Zeng2013), Promoter Scan (http://www.bimas.cit.nih.gov/molbio/proscan) and CpG island prediction (http://www.urogene.org/methprimer/index1.html; Wang et al., Reference Wang, Xiong, Zuo, Lei, Ren and Xu2012).
SNP detection and genotyping
ANGPTL3 primers were designed by Primer Premier 5.0 software (GenBank accession number: NC_007301) and synthesized by Nanjing Genscript biological Engineering Technology Company (China; Table 1). SNPs were scanned by constructing a genomic DNA pool and sequencing method. A total of 110 individuals were selected for the DNA pool: 10 DNA samples were randomly selected from every cattle breed, respectively. The PCR products were sequenced by ABI PRISM 3730 DNA analyzer (Applied Biosystems), then the SNPs were analyzed by BioXM software (Version 2.6) (Ma et al., Reference Ma, Chen, Li, Yang, Xu, Li, Gao, Zheng, Li, Zhang, Huang, Bai, Wang, Li, Wang and Li2012). SNP3 was genotyped by a forced PCR-restriction fragment length polymorphism (PCR-RFLP) method with one primer containing a mismatched nucleotide for HinfI restriction endonuclease (Table 1). Six-microliters PCR products were digested with 0.5 U HinfI for 3 h at 37°C. The digested products were separated by 16% Polyacrylamide gel (PAGE) in 1×Tris-borate-EDTA (TBE) buffer under constant voltage (130 V) for 13 h at room temperature. The PCR-single strand conformation polymorphism (PCR-SSCP) method was used to detect polymorphisms in SNP1, SNP2 and SNP4. Three-microliters PCR products were separated by 13% PAGE in 1×TBE buffer under constant voltage (130 V) for 12 h at room temperature. The gels were stained with 0.1% silver nitrate and the genotypes were estimated based on different electrophoretic patterns (Ma et al., Reference Ma, Chen, Li, Xu, Li, Li, Gao, Li and Shi2014).
Predicted protein structures
To predict protein structures, we retrieved mRNA sequence of the bovine ANGPTL3 from NCBI Genbank database (GenBank number NM_001080345.1) and then introduced three missense mutations identified in our populations, SNP2 (rs451104723: g.104A>T), SNP3 (rs482516226: g.509A>G) and SNP4 (rs477165942: g.8661T>C), using BioEdit version 7.0 software. We translated these three mRNAs along with the non-mutated form to proteins using DNAstar software (DNASTAR, Madison, WI, USA). We compared sequences of attained proteins to those of the available sequences in the UniProt Knowledgebase website. To predict the three-dimensional structure of ANGPTL3, we used PyMOL 0.97 and SWISS-MODEL software available at the ExPASy website (Bahrami et al., Reference Bahrami, Behzadi, Miraei-Ashtiani, Roh and Katoh2013).
Statistical analysis
Gene frequencies were determined by direct counting. Population genetic indices, such as heterozygosity (H e ), homozygosity (H o ), effective allele numbers (N e ) and polymorphism information content (PIC) were calculated according to Nei’s methods (Nei and Roychoudhury, Reference Nei and Roychoudhury1974; Ma et al., Reference Ma, Gao, Lin, Chen, Xu, Jiang, Li, Lu, Zhao, Shi, Cheng and Li2013). The formulas were as follows:
 $$\eqalignno{H_{o}& =\mathop{\sum}\limits_{i{\,=\,}1}^n {p_{i}^{\,\,2} ,\;H_{e} =1{\minus}\mathop{\sum}\limits_{i{\,=\,}1}^n {p_{i}^{\,\,2} } } ,\;N_{e} ={1 \over {\mathop{\sum}\limits_{i{\,=\,}1}^n {p_{i}^{\,\,2} } }},\;\cr &\!\!\!\!\!\!\!{\rm PIC}=1{\minus}\mathop{\sum}\limits_{i{\,=\,}1}^m {p_{i}^{2} } {\minus}\mathop{\sum}\limits_{i{\,=\,}1}^{m{\minus}1} {\mathop{\sum}\limits_{j{\,=\,}i{\plus}1}^m {2p_{i}^{2} p_{j}^{2} } } $$
where P i and P j indicate the frequency of the i and j alleles, respectively. n is the number of alleles. Hardy–Weinberg equilibrium was also analyzed (Emigh, Reference Emigh1980). The linkage disequilibrium (LD) structure and haplotypes were determined using SHEsis software (http://analysis.bio-x.cn/myAnalysis. php; Shi and He, Reference Shi and He2005).
Statistical analysis was performed on records of six growth traits in NY and JX cattle at five different ages. All analyses were done in two steps, first using a full animal model and then using a reduced animal model. Initially, the full animal model included the fixed effects of marker genotype, birth year, season of birth (spring v. fall), age of dam, sire, farm, sex and random effects of animal. However, preliminary statistical analysis indicated that season of birth, age of dam, sire, farm and sex did not have a significant influence on the variability of the growth traits in our populations. So these factors were subsequently removed from our analysis in the reduced model.
The reduced model was used in the final analysis (Hickford et al., Reference Hickford, Forrest, Zhou, Fang, Han, Frampton and Horrell2010). The SPSS software was used to analyze the relationship between the genotypes and traits in cattle (Ma et al., Reference Ma, Chen, Li, Xu, Li, Li, Gao, Li and Shi2014). The linear model was: Y ijkl =μ+B i +G j +A k +e ijkl , where Y ijk is the phenotype of the animal, μ the mean of the population, B i the effect of breed, G j the effect of genotype, A k the effect of age and e ijkl the random error. Differences between the means for each group was considered significant at P<0.05. The least square mean estimates with standard errors for different genotypes and growth traits were used. In this model, age and marker genotypes were considered as fixed effects, dam (calf) as a random effect and growth traits as the dependent variables.
The associations between SNP marker genotypes and carcass and meat quality traits were analyzed according to the following linear model: Y ijkl =μ+BF i +Month j +G k +e ijkl , where Y ijkl is the observed value, μ the overall mean for each trait, BF i the fixed effect of i th breed and farm, Month j =the fixed effect of j th month of slaughtering, G k the fixed effect of k th single SNP marker genotype; e ijkl the random error (Hou et al., Reference Hou, Yuan, Gao, Li, Gao, Chen and Xu2010).
Results
Gene expression profile of the bovine ANGPTL3
The mRNA levels of the bovine ANGPTL3 gene were analyzed in nine tissues by qRT-PCR with normalization against GAPDH and HPRT1. The specificity of the intended product was monitored by analyzing the dissociation curve of the amplicon. The results showed that ANGPTL3 was predominantly expressed in the liver, with minor expression in the spleen, lung and kidney (Figure 1).
Tissue distribution of the bovine angiopoietin-like protein 3 (ANGPTL3) mRNA assessed by qRT-PCR. The values shown in this figure are the averages of three independent experiments. Error bars represent the s.d. (n=3) of relative mRNA levels of the bovine ANGPTL3. The expression data were normalized using the geometric mean of the RNA levels for two control genes (GAPDH and HRPT1).

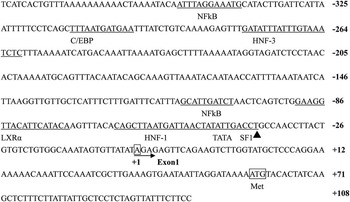
Characterization of the bovine ANGPTL3 promoter
To investigate the transcriptional regulation of bovine ANGPTL3, we cloned and sequenced the 5′-flanking sequence that includes sequence upstream from the translation initiation codon (ATG) and the first exon (Figure 2). Sequence and promoter prediction analysis indicated two interesting features: no apparent CAAT box near the ATG or downstream of it, there are several binding sites for cis-acting regulatory elements, including sites for steroidogenic factor 1 (SF1), TATA, hepatocyte nuclear factor 1 (HNF-1), liver X receptor α (LXRα), nuclear factor kappa-light-chain-enhancer of activated B cells (NFκβ), HNF-3 and CCAAT-enhancer-binding proteins (C/EBP).
Putative transcription factor binding sites in the angiopoietin-like protein 3 (ANGPTL3) 5′-flanking region are underlined and indicated above the sequence. The nucleotide corresponding to the major transcription start site is shown in bold as (+1). Filled arrowhead shows the start of exon 1. Filled black triangle represent single nucleotide polymorphism 1 (SNP1).

Identification of genetic variants in ANGPTL3
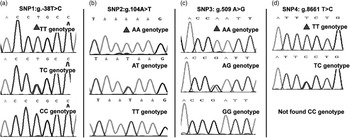
Bovine ANGPTL3 contains seven exons and six introns (Figure 3). In this study, four SNPs, SNP1 (rs469906272: g.−38T>C) in the promoter region, SNP2 (rs451104723: g.104A>T), SNP3 (rs482516226: g.509A>G) and SNP4 (rs477165942: g.8661T>C), all in the coding region, were identified by sequencing (Figure 4).
Structural graph of the bovine angiopoietin-like protein 3 (ANGPTL3) gene. Green band indicated DNA structure of the bovine ANGPTL3 gene (GenBank Number: AC_000160); blue band indicated mRNA structure of the bovine ANGPTL3 gene (GenBank Number: NM_001080345.1); red band indicated protein structure of the bovine ANGPTL3 protein (GenBank Number: NP_001014861.1); two black band indicated signal peptide (Sig-Peptide AA) and fibrinogen-related domains (FReDs) of the bovine ANGPTL3, respectively. Three blue stars indicate the positions of the three polymorphic sites in bovine ANGPTL3.

Sequence chromatograms of fragments at four single nucleotide polymorphisms (SNPs). (a) Sequence chromatograms of different genotypes (TT, TC and CC) at the g.−38T>C locus. (b). Sequence chromatograms of different genotypes (AA, AT and TT) at the g.104A>T locus. (c) Sequence chromatograms of different genotypes (AA, AG and GG) at the g.509A>G locus. (d) Sequence chromatograms of different genotypes (TT and TC) at the g.8661T>C locus. Red triangles represent polymorphic sites (color figure online).

The genotyping of SNP1, SNP2 and SNP4 were successfully implemented using PCR, DNA sequencing and PCR-SSCP methods. SNP1 mutation was located in the predicted binding sites for SF1 element in the promoter region (Figure 2). SNP2 results in a missense mutation, ATT (9 Ile)>TTT (9 Phe), as does SNP4, TCT (365 Ser)>TCC (365 Pro). SNP3 results in a missense mutation, CAA (144 Glu)>CGA (144 Arg), and can be distinguished by a HinfI PCR-RFLP. At the HinfI locus, the allele ‘G’ produced four bands (282 bp, 70 bp, 64 bp and 23 bp), while the allele ‘A’ produced three bands (282 bp, 93 bp and 64 bp). Therefore, genotype AA showed three bands (282 bp, 93 bp and 64 bp), and genotype GG showed four bands (282 bp, 70 bp, 64 bp and 23 bp), while genotype AG showed five bands (282 bp, 93 bp, 70 bp, 64 bp and 23 bp). Fragments <20 bp were not detectable on the gel due to their small size.
Predicted protein structure
In our study, two substitutions (SNP3: g.509A>G and SNP4: g.8661T>C) lead to changes of amino acids (Glu>Arg and Ser>Pro) in the predicted protein structures (Figure 5 and Figure 6), but their biological functions need further confirmation.
Amino acid changes and resulting changes in predicted angiopoietin-like protein 3 (ANGPTL3) protein structure. The change of Glu to Arg at codon 144.

Amino acid changes and resulting changes in predicted angiopoietin-like protein 3 (ANGPTL3) protein structure. The change of Ser to Pro at codon 365.

Genetic characteristics of the four SNPs in the bovine ANGPTL3 gene
To evaluate genetic diversity of the population analyzed, genetic indexes (H o , H e , N e and PIC) and genotypic and allelic frequencies were calculated at the four polymorphic loci (Supplementary Table S1). The results showed that the frequencies of alleles T, A, A and T were dominant at SNP1, -2, -3 and -4, respectively. However, only two genotypes (TT and TC) of SNP4 were found in the studied population. Genetic indices (H e , N e and PIC) in 11 cattle populations are presented in Supplementary Table S1. These data demonstrate that the ranges of H e , N e and PIC of the four SNPs were from 0.000 to 0.446, 0.000 to 1.923 and 0.000 to 0.365 among all populations, respectively.
LD and haplotype structure analysis
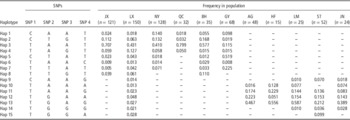
LD between polymorphism pairs and haplotype structure analysis of the bovine ANGPTL3 gene in 11 cattle populations are shown in Supplementary Table S2 and Table 2.
The haplotype frequencies for four SNPs in ANGPTL3 gene in studied populations

SNP=single nucleotide polymorphism; ANGPTL3=angiopoietin-like protein 3; Hap=haplotype; JX=Jiaxian; LX=Luxi; NY=Nanyang; QC=Qinchuan; BH=Bohai; GY=Gaoyuan; AG=Angus; HF=Hereford; LM=Limousin; ST=Simmental; JN=Jinnan.
LD between each pair of four SNPs in 11 cattle populations was estimated. The D' values ranged from 0.000 to 1.000. The r 2 values were from 0.001 to 1.000. The mean r 2 values between adjacent SNPs were 0.015, 0.087, 0.258, 0.134, 0.432, 0.817, 0.364, 0.081, 0.146, 0.221 and 0.019 for 11 breeds, respectively. The mean D′ values between adjacent SNPs were 0.863, 0.497, 0.005, 0.003, 0.056, 0.203, 0.060, 0.510, 0.357, 0.863 and 0.601 for 11 breeds, respectively. These data suggest that low levels of LD could be detected in the four SNPs. One possible explanation for these results is that recombination is high and LD is low in regions of dense gene variation.
The haplotype analysis of the four SNPs showed that 15 haplotypes were identified in these animals (Table 2). There were 15 haplotypes in LX cattle, while only four haplotypes in QC, AG and HF cattle. Only four haplotypes (Hap 1, -2, -3, -4) were present among all five native Chinese cattle populations, and among them haplotype 3 (Hap 3: TAAT) had the highest frequency in JX (70.7%), LX (43.1%), NY (40.1%), QC (79.7%) and BH (57.7%) cattle, while other three haplotypes (Hap 11, −12, −13) were present among all five beef cattle. Haplotype 13 (TGAG) had the highest frequency in AG (46.7%), HF (55.6%), LM (58.7%), ST (21.2%) and JN (38.9%) cattle. The most frequent haplotypes are present in all studied cattle populations, whereas the rare haplotypes were exclusive to specific breeds.
Relationships between ANGPTL3 SNPs and growth traits
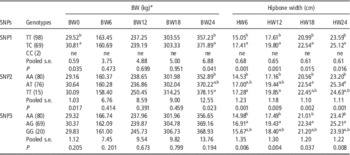
We analyzed the association between four SNPs and growth traits in 171 NY and JX cattle. The results are shown in Table 3. Animals with a SNP1-TC genotype had significantly greater body weight at birth and 24 months compared with those with a TT genotype (P<0.05) (Table 3). The animals with a TC genotype had significantly greater hipbone width at 6, 12, 18 and 24 months compared with those with a TT genotype ( P<0.05; Table 3).
Associations between three SNPs and BW and hipbone width in Jiaxian and Nanyang cattle

SNP=single nucleotide polymorphism; ne=not estimated; pooled s.e.=pooled standard error; BW0=birth BW; BW6=BW at 6 months old; BW12=BW at 12 months old; BW18=BW at 18 months old; BW24=BW at 24 months old; HW6=hipbone width at 6 months old; HW12=hipbone width at 12 months old; HW18=hipbone width at 18 months old; HW24=hipbone width at 24 months old.
Least square means for each genotypic class are reported.
* The values bearing different superscripts differ significantly (P<0.05) from each other.
Animals with SNP2-TT and -TA genotypes had significantly greater body weight at birth and 24 months compared with those with an AA genotype (P<0.05; Table 3), demonstrating that the T allele might be associated with increased BW at birth and 24 months. The animals with TT and TA genotypes had significantly greater hipbone width at 6, 12, 18 and 24 months compared with those with an AA genotype (P<0.05; Table 3), demonstrating that the T allele might be associated with greater hipbone width at 6, 12, 18 and 24 months.
For SNP3, NY and JX animals with an AG genotype had significantly greater hipbone width at four different ages compared with those with an AA genotype (P<0.05; Table 3), demonstrating that the allele G might be associated with increased hipbone width at all ages.
Relationships between ANGPTL3 SNPs and meat quality traits
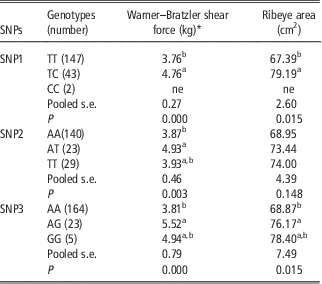
To verify the effects of the bovine ANGPTL3 on meat quality traits, we also correlated the four SNPs with meat traits in 192 beef animals, and the results are shown in Table 4. The WBSF values of individuals with heterozygous genotypes of three loci (SNP1-TC, SNP2-AT and SNP3-AG) were higher compared with those with the respective homozygous genotypes (SNP1-TT, SNP2-AA and SNP3-AA) (P<0.05). RA values of individuals with SNP1-TC and SNP3-AG genotypes were higher compared with those with respective TT and AA genotypes (P<0.05).
Association analysis between three loci in ANGPTL3 and meat quality traits

ANGPTL=angiopoietin-like protein 3; SNP=single nucleotide polymorphism; ne=not estimated; Pooled s.e.=Pooled standard error.
Least square means for each genotypic class are reported.
* The values bearing different superscripts differ significantly (P<0.05) from each other.
Discussion
Many studies in humans, mice and livestock have shown that ANGPTL3 is involved in the regulation of lipid, glucose metabolism and energy balance (Kadomatsu et al., Reference Kadomatsu, Tabata and Oike2011; Arca et al., Reference Arca, Minicocci and Maranghi2013; Robciuc et al., Reference Robciuc, Maranghi, Lahikainen, Rader, Bensadoun, Öörni, Metso, Minicocci, Ciociola, Ceci, Montali, Arca, Ehnholm and Jauhiainen2013). Accumulating evidence indicates that some genes closely related to ANGPTL3, especially LXRα, ANGPTL4 and ANGPTL6, function as a new class of lipid and energy metabolism modulator (Kadomatsu et al., Reference Kadomatsu, Tabata and Oike2011). It has been reported that ANGPTL3 is a direct target of LXRα, which is a nuclear receptor activated by oxysterols and known to play an important role in the control of lipid homeostasis (Kaplan et al., Reference Kaplan, Zhang, Hernandez, Gan, Wright, Waters and Cai2003). Dahlman et al. (Reference Dahlman, Nilsson, Jiao, Hoffstedt, Lindgren, Humphreys, Kere, Gustafsson, Arner and Dahlman-Wright2006) reported that LXRα mRNA levels are higher in obese women (P=0.03) and that mutation in LXRα is associated with body mass index and obesity. The ANGPTL4 rs4076317 polymorphism was associated with a higher percentage of body fat in adolescents as well as a higher waist-to-hip ratio in adults (Legry et al., Reference Legry, Bokor, Cottel, Beghin, Catasta, Nagy, Gonzalez-Gross, Spinneker, Stehle, Molnár, Moreno, Amouyel, Dallongeville and Meirhaeghe2009). In cattle, previous research into the expression profiles and SNPs of the bovine LXRα, ANGPTL4 and ANGPTL6 also indicated that these genes were mainly expressed in liver and adipose tissue and that they were significantly associated with growth and slaughter traits (height at withers, body length, hip width, height at hip cross and CW) of cattle (Mamedova et al., Reference Mamedova, Robbins, Johnson and Bradford2010; Li et al., Reference Li, Lan, Sun, Gao, Ma, Ma and Chen2012; Ma et al., Reference Ma, Chen, Li, Xu, Li, Li, Gao, Li and Shi2014). Considering the similar functions of these new lipid and energy metabolism modulators, we hypothesized that ANGPTL3 may also be relevant to growth development of cattle. This study was designed to determine the ANGPTL3 expression profile, detect genetic variation in the ANGPTL3 gene and evaluate its effects on growth performance in native Chinese cattle.
QRT-PCR analysis revealed that ANGPTL3 was highly expressed in the liver of Jiaxian cattle. The result is similar to studies in Chinese Holstein cattle (Guan et al., Reference Guan, Cai, Sun and Lu2010), pigs (Xia et al., Reference Xia, Dai, Peng and Yang2006), goats (Chen et al., Reference Chen, Bai, Mai, Cai, Liu, Wang, Xiao, Dong, Wang and Sun2012), mice (Conklin et al., Reference Conklin, Gilbertson, Taft, Maurer, Whitmore, Smith, Walker, Chen, Wattler and Nehls1999a) and humans (Kersten and Bensadoun, Reference Kersten and Bensadoun2009). The similar structure of ANGPTL3 between cow and other species indicated that ANGPTL3 might have similar functions among various species. The high level of ANGPTL3 expression in mature yellow cattle liver may indicate that it also plays an important role in lipid and energy metabolism. It is important to note that in a recent study, icariin treatment in pig significantly increased the expression of ANGPTL3 (Xiao et al., Reference Xiao, Wang and Sun2012a). This finding suggested that the percentage of fat in meat and BF were positively correlated with ANGPTL3 expression in swine. Thus, ANGPTL3 expression may also improve meat quality of cattle.
It is currently accepted that genetic variability is high in cattle. Therefore, it is necessary to evaluate the variability within each breed and to determine the effects of genetic variation in bovine ANGPTL3 on growth and development in cattle. In this study, four SNPs were identified, SNP1 (rs469906272: g.−38T>C) in the promoter region, SNP2 (rs451104723: g.104A>T) and SNP3 (rs482516226: g.509A>G) in exon 1 and SNP4 (rs477165942: g.8661T>C) in exon 6. ANGPTL3 expression is regulated by nuclear receptors LXRα and HNF-1α, which affects ANGPTL3 mRNA levels via response elements located within the promoter of ANGPTL3 (Foka et al., Reference Foka, Karamichali, Dalagiorgou, Serti, Doumba, Pissas, Kakkanas, Kazazi, Kochlios, Gaitanou, Koskinas, Georgopoulou and Mavromara2014). Although no mutations were founded in the response elements of LXRα and HNF-1α, the SNP1 was located in the predicted binding site of SF1 element (Figure 2). Indeed, several studies have reported that mutations in promoter contribute to change promoter activity (Xiao et al., Reference Xiao, Wang, Mo, Li, Chen, Zhang and Cong2012b; Li et al., Reference Li, Sun, Hua, Lai, Lan, Lei, Zhang, Qi and Chen2013; Dang et al., Reference Dang, Chu, Shi, Yu, Han, Gu and Chen2015). So it is possible that the SNP1 within SF1 element might influence promoter activity of the bovine ANGPTL3 gene, but its biological function needs further confirmation.
Several literature surveys were performed to retrieve functional and disease-associated mutations in the signal peptide domains (Boson et al., Reference Boson, Sarubi, D’Alva, Friedman, Faria, De Marco and Wajchenberg2003; Mohren and Weiskirchen, Reference Mohren and Weiskirchen2009; Mencarelli et al., Reference Mencarelli, Zulian, Cancello, Alberti, Gilardini, Di Blasio and Invitti2012). Signal peptide is critical for localization and function of cell surface receptors and ligands that mediate cell–cell communication (Jarjanazi et al., Reference Jarjanazi, Savas, Pabalan, Dennis and Ozcelik2008). The SNP2 (9 Ile>Phe) was located in the signal peptide (residues 7 to 15) of ANGPTL3. This mutation may impair the signal peptide function and then influence ANGPTL3 protein transportation, but its biological function needs further confirmation. The C-terminal region of ANGPTL3 is involved in angiogenesis, while the N-terminal region of ANGPTL3 is important for lipid metabolism (Quagliarini et al., Reference Quagliarini, Wang, Kozlitina, Grishin, Hyde, Boerwinkle, Valenzuela, Murphy, Cohen and Hobbs2012). The SNP3 mutation leads to a substitution of glutamine for arginine at position 144 in the predicted N-terminal coiled-coil domain (Figure 5), which may alter the function of ANGPTL3 and affect regulation of plasma TG levels. However, its biological function still needs further confirmation. The SNP4 mutation leads to a substitution of serine for proline at position 365 in the predicted C-terminal fibrinogen-like domain. The KinasePhos 2.0 web server was used to predict phosphorylation sites of the ANGPTL3 (Wong et al., Reference Wong, Lee, Liang, Huang, Wang, Yang, Chu, Huang, Ko and Hwang2007). The result showed that serine-365 (S365) is a potential phosphorylation site. Many proteins are switched ‘on’ or ‘off’ by phosphorylation and dephosphorylation, thereby altering their function and activity (Ashcroft et al., Reference Ashcroft, Kubbutat and Vousden1999). The 365 Ser>Pro amino acid substitution may disrupt the phosphorylation site of ANGPTL3 and have an effect on the protein structure and biological function of ANGPTL3 (Figure 6). However, there is no evidence of ANGPTLs family being phosphorylated, so further confirmation of this is needed. Thus, these four mutations may influence the function and specificity of ANGPTL3.
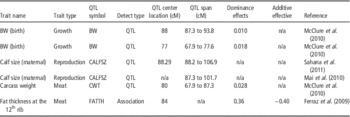
Growth and meat quality traits are controlled by an unknown number of genes. Many have been mapped to quantitative trait loci (QTL) regions, and some of these genes may have strong effects on a specific trait. Bovine ANGPTL3 is located on chromosome 3 (from approximately 83.49 to 83.58 Mb). Alignment of bovine chromosome 3 on the radiation hybrid (RH) map of the USDA-MARC cattle Database indicated that QTLs associated with growth traits in this region (DIK4116), such as BW at birth (McClure et al., Reference McClure, Morsci, Schnabel, Kim, Yao, Rolf, McKay, Gregg, Chapple, Northcutt and Taylor2010), calving traits (HH51 marker), such as calf size (Mai et al., Reference Mai, Rychtárová, Zink, Lassen and Guldbrandtsen2010; Sahana et al., Reference Sahana, Guldbrandtsen and Lund2011), meat quality traits, such as CW and fat thickness at the 12th rib (Ferraz et al., Reference Ferraz, Pinto, Meirelles, Eler, de Rezende, Oliveira, Almeida, Woodward and Nkrumah2009; McClure et al., Reference McClure, Morsci, Schnabel, Kim, Yao, Rolf, McKay, Gregg, Chapple, Northcutt and Taylor2010) (details are shown in Table 5). Our association analysis showed that the SNP1, SNP2 and SNP3 mutations were significantly associated with BW (birth and 24 months), hipbone width (6, 12, 18 and 24 months), WBSF and RA, respectively. All the evidence along with the known biological function and the fact that bovine ANGPTL3 maps closely to many growth and meat quality QTLs make ANGPTL3 a promising candidate gene for growth and meat quality traits. The SNPs described here may be used as genetic markers linking QTLs with effects on these traits.
QTLs of economic traits around ANGPTL3 gene

ANGPTL3=angiopoietin-like protein 3; QTL=quantitative trait loci; CALFSZ=calf size; CWT=carcass weight; FATTH=fat thickness at the 12th rib.
In conclusion, the expression profile of the bovine ANGPTL3 provides helpful information to better understand the role of ANGPTL3. The association results suggest that the four SNPs in bovine ANGPTL3 can be used as genetic markers to improve growth traits. However, these effects remain to be confirmed. Further functional and physiological research elucidating the impact of the ANGPTL3 on bovine growth and meat quality traits, including information from comparative physiology and genomic variations will help in understanding the complex interplaying processes and pathways linked to lipid, glucose, and energy metabolism and possibly the genetic basis of variation in obesity-related phenotypes.
Acknowledgments
This study was supported by The National Natural Science Foundation of China (NSFC) (No. 31172193), The Chinese National High Technology Research and Development Program (No. 2013AA102505-4), The Plan For Scientific Innovation Talent of Henan Province (No. 134100510012), The Inner Mongolia Autonomous Region Natural Science Foundation Project (No. 2012MS0403), The Science & Technology Innovation Talents in Universities of Henan Province (No. 2012 HASTIT027) and The Technology Innovation Teams in Universities of Henan Province (No. 14IRTSTHN012).
Supplementary material
To view supplementary material for this article, please visit http://dx.doi.org/10.1017/S1751731115000658