1. Introduction
Consider a scientist who must convey her data as either a numerical array or a scatter plot. I call whatever stays the same between these two representations “content” and whatever differs “representational style.” In this article, I examine the epistemic role of visual representational style in scientific practice. I consider two philosophical approaches to the epistemology of scientific visual representation and propose my own. The first claims that a visual, a numeric, and a linguistic representation with the same content all make the same contribution to scientific knowledge. The second follows Goodman (Reference Goodman1968) and focuses on the conventional formal features that distinguish visual and textual representation. These formal features arguably contribute to the “epistemic advantages and disadvantages” (Kulvicki Reference Larkin and Simon2010, 296) of visual representations in scientific contexts (e.g., Perini Reference Plaisted, Swettenham and Rees2005). Goodmanians might acknowledge that cognition contributes to epistemically relevant features of visual representation, like perceptual salience. However, they defer on such matters to “cognitive psychologists” who “are in a good place to study the specifics” (Kulvicki Reference Larkin and Simon2010, 300).
I take a third approach, which I call “nonarbitrary conventionalism.” My approach departs from Goodman's primary focus on the formal conventions of visual representation. In addition to formal conventions, I consider the cognitive limitations and abilities of human scientists that representational conventions exploit. In doing so, I hope to defend and develop Humphreys’ (Reference Humphreys2004) epistemic requirement that representations must facilitate understanding in a scientific audience, rather than merely have content in principle. My account draws on Perini's formal analysis of visual representation (e.g., Reference Plaisted, Swettenham and Rees2005), scientific case studies, and empirical research on pattern detection in neurotypicals, autistics, and dyslexics.
2. Style, but Substance
Computer simulations and other computerized instruments are interesting case studies because they output data sets that can, in principle, be represented in many different styles (e.g., numerically or visually). Since each of these stylistically distinct outputs represents the same data set, they should have the same content and thus, prima facie, be intersubstitutable in whatever scientific arguments they are used without a change in soundness. Suppose, for example, that a scientific argument includes the sentence “refer to figure 1,” where figure 1 is a graph. If an equivalent numerical array is substituted for a graph, it might be more difficult to understand that the argument is sound, but whether it is sound should be unaffected. These considerations might lead one to conclude that, while visual representation might be more practically useful than numerical representation, visualization does not contribute to scientific knowledge.
Nevertheless, Humphreys argues that representational style plays an epistemic role in scientific contexts such as computer simulation: “Because one of the goals of current science is human understanding, how the simulation output is represented is of great epistemological import when visual outputs provide considerably greater levels of understanding” (Reference Humphreys2004, 114). Humphreys’ most compelling examples are where a change in representational style determines whether it is possible, in practice, for scientists to understand a data set: “graphical representations are not simply useful; they are in many cases necessary because of the overwhelming amount of data generated by modern instruments. … [In these cases] data displays in numerical form are impossible for humans to assimilate, whereas the right kind of graphic displays are, perceptually, much easier to understand” (113).
Wilhelmson et al., for example, simulate a severe storm in order to gain “improved understanding of severe storm structure and evolution” (Reference Wolff and Lundberg1990, 20). Another explicit goal of this simulation study was to develop and use “a variety of visualization methods” to tractably analyze “the amount of data produced during a simulation” (20). One visualization method, pictured in figure 1, uses weightless tracer particles to track the movement of air originating at locations of interest in or near the storm during its mature stage (25–27). This figure tracks two sets of tracers as they move through the storm's updraft (in red) and downdraft (in blue). Notably, figure 1 shows that the mature simulated storm evolved an intertwined updraft and downdraft, which is a structure that Browning (Reference Browning1964) first hypothesized in order to (partially) explain the longevity and severity of storms he called “supercells.” Because the updraft and downdraft intertwine, rather than interfere with each other, they are “able to co-exist continuously” (636) without causing each other to dissipate.
Reproduced with permission from Wilhelmson et al. (Reference Wolff and Lundberg1990).

Visualization is necessary, in practice, to show that Wilhelmson et al.'s simulated storm has this intertwined structure because it represents over 3,000 data points. If the data (i.e., content) in figure 1 were presented as a massive numerical array, it would be impossible for a normal human scientist to detect the nonlinear structure of interest. With figure 1, Wilhelmson et al. (Reference Wolff and Lundberg1990) show that the intertwined structure can evolve in a simulated storm, and they provide evidence for Browning's theory. In doing so, they contribute to scientific knowledge. Yet it was possible, in practice, for figure 1 to play this epistemic role because of Wilhelmson et al.'s (Reference Wolff and Lundberg1990) visualization methods.
These considerations highlight the shortcomings of any epistemology that ignores practical questions about understanding and focuses instead on the content of representations. In many cases, such an epistemology would not capture how it is possible for scientists to justify beliefs (i.e., gain knowledge) on the basis of their data. Our epistemic access to the world is constrained by practical considerations like the cognitive abilities and limitations of human scientists.Footnote 1
Nonetheless, the fact that a particular scientist fails to understand a representation does not entail that this representation makes no contribution to knowledge. A representation's epistemic status is not impugned, for instance, if it is presented to an interlocutor in a language or technical discourse that she does not understand. Thus, I propose that the epistemology of scientific representation should balance between two constraints. We should not require that any particular scientist understand a representation but instead that it could be understood by an interlocutor who is fluent in whatever linguistic and scientific dialect in which a representation is presented.Footnote 2
If we idealize away from scientific and linguistic expertise, however, why not also abstract from the constraints of human cognition? Because it is also a desideratum to account for the epistemic distinction between visual and numerical representations that can and cannot possibly be understood in practice. These epistemic constraints arise largely because of the cognitive abilities and limitations of human scientists. As such, I postulate that our idealized scientific interlocutor is human (not an unreasonable assumption, demographically).Footnote 3
3. Formalities and Conventions
According to Goodman's (Reference Goodman1968) wholehearted conventionalism, the human visual system is not a primary determinant of the epistemic effectiveness of visual representations. Instead, Goodman aims to account for such effectiveness in terms of formal conventions. Even in art forms that aim to “realistically” depict their subject matter, Goodman claims that “the ways of making a painting look right are not reducible to fixed or universal rules” (20) associated with perspective (10–19) or color perception (35–36), for example. Instead, he contends that “realism is relative, determined by the system of representation standard for a given culture or person at a given time” (37). Although Goodman acknowledges that “countless and variable factors” (14) can influence whether a painting looks accurate, formal conventions are prominent in his theory.
In defense of the conventionality of realism, Goodman's cites (among other examples) color inversion. It is often assumed, Goodman claims, that the amount of information conveyed by a painting can be used as a criterion to determine whether it is realistic. Yet we could replace each color in a painting with its complement to create a new work that would seem vastly unrealistic but that “appropriately interpreted, yields exactly the same information as the first” (Goodman Reference Goodman1968, 35). Goodman's conclusion is that convention determines what seems realistic. Goodman's argument rests on the assumption, which philosophers have made since Locke (Reference Navon1689/1975, 15), that color inversion is possible without a loss of information.
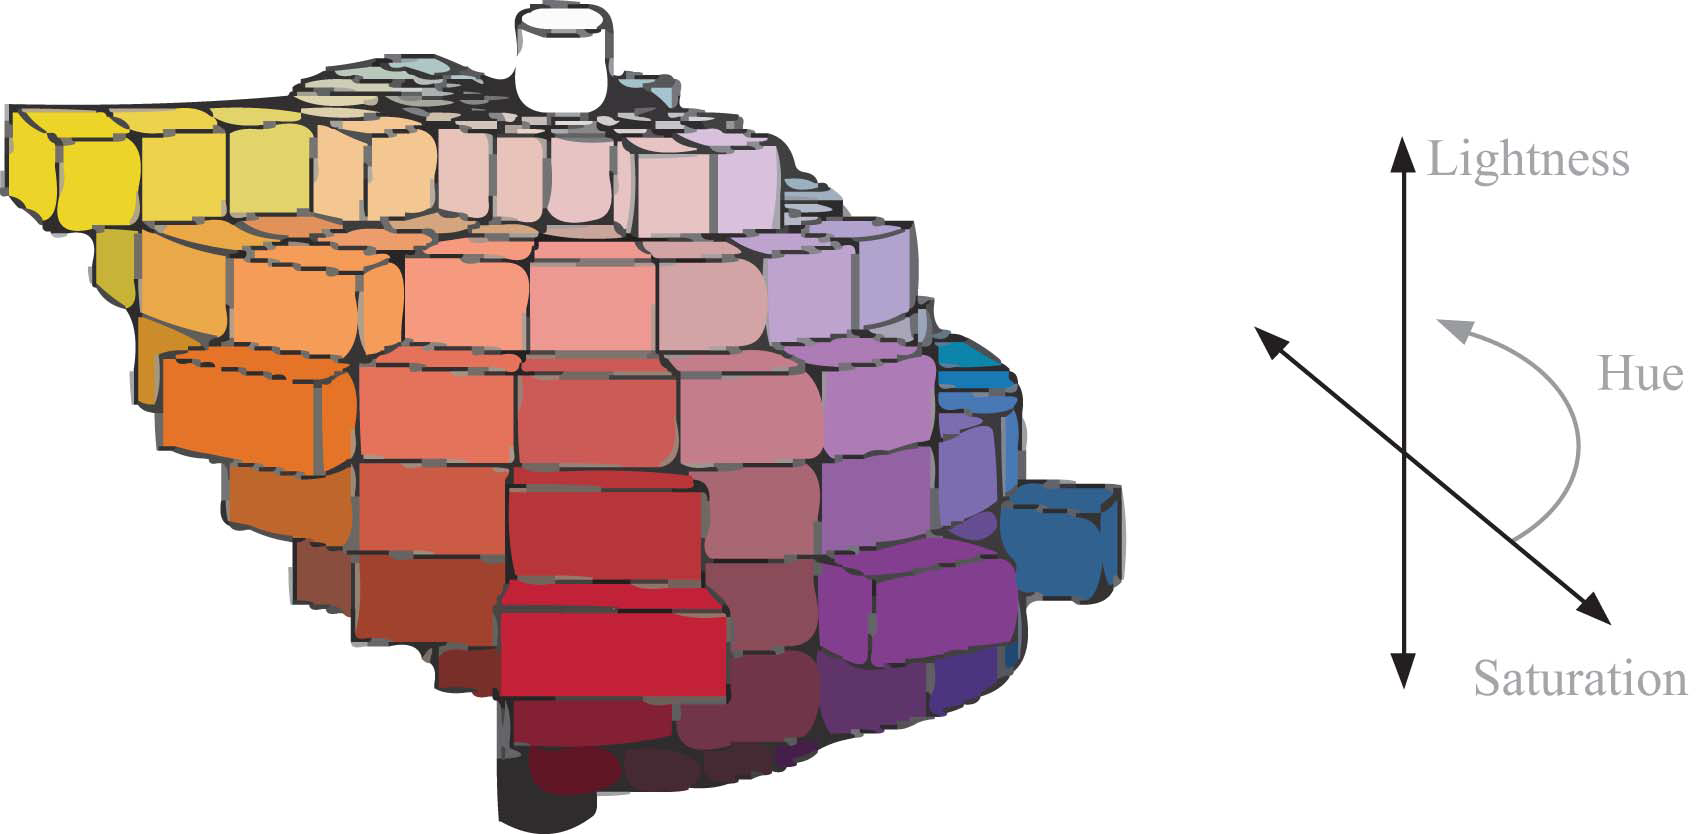
When we examine the details of human color vision, however, it becomes less plausible that any lossless color inversion is possible. Inversion scenarios assume that human color vision is symmetrical. For example, in order for yellow and blue to be inverted, there must be a one-to-one mapping of the hues in the visible blue and yellow spectrums. But there are “more distinguishable hue steps between blue and red than there are between yellow and green” (Byrne Reference Byrne and Zalta2010), which rules out lossless red-green and blue-yellow inversion. Moreover, humans distinguish colors not only in terms of hue (e.g., yellow, blue) but also by saturation and brightness, and the ensuing three-dimensional color tree is asymmetrical along a variety of dimensions (fig. 2; cf. Harrison Reference Harrison1967; Byrne Reference Byrne and Zalta2010).
Adapted from adobe.com. Represents color along three dimensions (lightness, saturation, and hue).

My argument is not meant as a wholesale refutation of Goodman's thesis that convention determines what looks realistic. Indeed, the color inversion scenario is hardly Goodman's strongest argument, and it may be the case that “any number of other drastic but information preserving transformations are possible” (Reference Goodman1968, 35). Rather, my point is that we must examine the human visual system to determine whether lossless color inversion is possible for humans. Representational color schemes are an example of a general point: the epistemic efficacy of conventions is often contingent on the abilities and limitations of the agents who made them. As such, I propose an approach, which I call “nonarbitrary” conventionalism, to study the epistemology of visual representation in science. I will analyze not only scientific case studies and formal conventions but also the features of human cognition that representational conventions exploit.
4. Nonarbitrary Conventions of Scatter Plots
Perini states that “the fundamental formal difference between visual representations and text is the sequential format of linguistic representations versus the two-dimensional spatial format of visual representations” (Reference Plaisted, Swettenham and Rees2005, 263–64). The spatial features of text distinguish written characters (letters, punctuation marks, etc.) and the order in which we read a sequence of characters (e.g., left to right). Yet these spatial features do not, in themselves, represent any features of the target phenomena and are thus “arbitrary with respect to [the] meaning” (263) of written text. In contrast, “the relation of the … component parts [of figures] in space does contribute to the[ir] meaning” (264). For example, the spatial relation between point A and B on a map may represent that A is southwest of B.
Throughout this section, my primary examples will be workaday scatter plots, which are pervasive in science from grade school to peer-reviewed journals. Scatter plots have two features of interest from my perspective: first, like visualization in simulation, they have the same content as numerical arrays. Second, again like other visualizations, they can have meaningful spatial features. Consider the epistemic role that scatter plots play in pedagogy, laboratories, journal articles, and so on. They are often consulted alongside or before more detailed statistical analysis in order to facilitate expedient initial analyses of a data set. They are useful in these contexts because they tend to emphasize global patterns in a data set (e.g., trends and outliers) over precise local features (i.e., the precise location of each data point).
To explicate the intuitive notion of “emphasis” employed in the preceding paragraph, I will use aspectual theories of representation. Such theories claim that whenever we represent a state of affairs, we always represent some aspects of it and not others. Goodman, for example, notes that “the object before me is a man, a swarm of atoms, a complex of cells, a fiddler, a friend, a fool, and much more” (Reference Goodman1968, 6) and thus any representation of that object must be of “one such aspect, one of the ways the object is and looks” (7; cf. Reference Goodman1960, 48–56).Footnote 4 Thus, two descriptions that have the same content can present that content under different aspects. Similarly, I believe, visual and numerical representations can present the same data set under different aspects, which affects what they convey to human scientists in epistemic contexts. To explain why visual and numerical representations present different aspects of their content, I will discuss both the formal properties of these representational styles and human psychology.
First, I note that scatter plots emphasize the coarse global location (e.g., just under four, or about three and three-quarters) of each data point rather than its precise value (e.g., 3.692). This is largely because the position of each point is represented spatially, and the limitations of human vision make it easier for scientists to detect larger spatial changes. In contrast, every digit in a numerical array is equally easy to detect because the spatial features of numerals do not represent features of the target. For example, we can detect all four digits in ‘3.692’ with the same degree of ease. Thus, in practice, numerical representation allows human scientists to locate a point with greater precision than visual representation. This distinction need not hold in principle: suppose the human visual apparatus could detect very small spatial features easily and accurately. If this were the case, then scatter plots and numerical arrays could present data to the same number of significant digits. Given the limitations of human vision, however, numerical representations can represent each datum with more precision.
Second, the spatial layout of a scatter plot, along with a bias in human vision toward global pattern detection, emphasizes the global properties of a data set (in contrast to individual points). Because the spatial location of individual points on a scatter plot is meaningful, the spatial relations between points represent meaningful relations between data. As such, global patterns in a data set (like trends and outliers) are represented by spatial patterns like clusters and isolated points. I will argue that scientists can easily interpret these meaningful spatial patterns, in part because our visual systems are biased toward and more effective at processing global patterns versus local features in a visual field. As such, scatter plots allow scientists to quickly inspect the holistic properties of a data set in a way that numerical representations do not.
5. Does Practice Make Perfect?
Goodman might concede that scientists seem to effortlessly detect global patterns in a scatter plot but respond that this is due to expertise, rather than intrinsic biases of the human visual system. Many representational conventions seem “natural” or “effortless,” Goodman claims, because “practice has rendered symbols so transparent that we are not aware of any effort, of any alternatives, or of making any interpretation at all” (Reference Goodman1968, 36). Indeed, one of the distinctive features of expertise is the capacity to detect, encode, and recall patterns of task-relevant information as unified global “chunks,” rather than to individually process local information. For example, the accepted explanation of chess masters’ exceptional memory of chessboards is that, unlike ordinary individuals, they do not remember the position of individual pieces but instead remember moves that involve many pieces (e.g., a queen's gambit that has been accepted; Chase and Simon Reference Chase and Simon1973; see Gobet et al. Reference Gobet, Lane, Croker, Cheng, Jones, Oliver and Pine2001 for a review). Similarly, given sufficient expertise, scientists may be able to detect meaningful global chunks such as trends or outliers in numerical arrays.
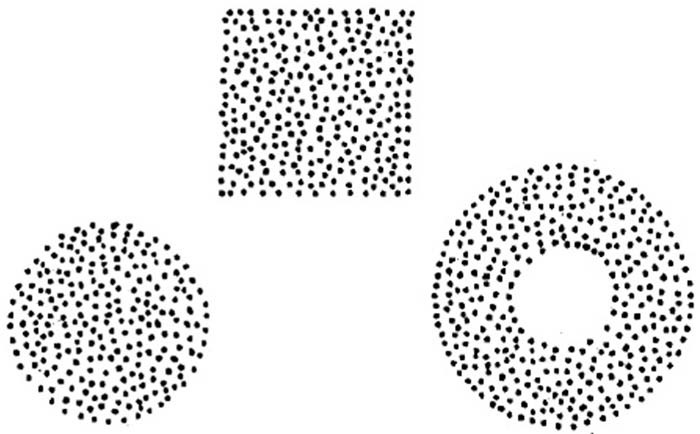
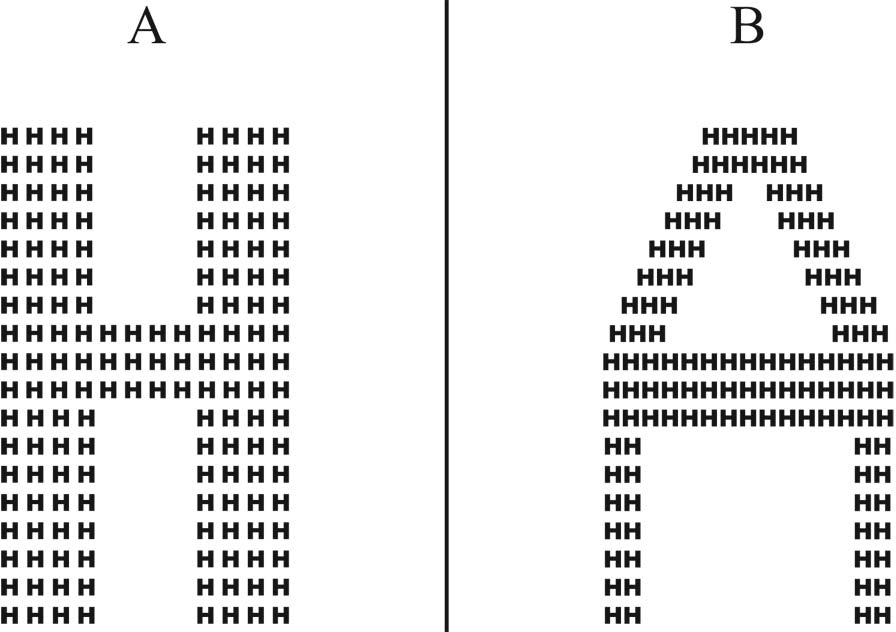
There is empirical evidence, however, that the normal human visual system is biased toward global spatial patterns such as those found in scatter plots. Consider, for instance, that the visual system will often fill in gaps in stimuli to treat them as global patterns like geometric objects (fig. 3; Chen Reference Chen2005, 575). In a classic experiment on global visual processing, Navon (Reference Perini1977) presented subjects with large letters (i.e., a global pattern) made up of smaller ones (i.e., local features; fig. 4). Normal subjects respond faster to letters presented at the global versus the local level. Moreover, when inconsistent letters are presented at the two levels (fig. 4B), subjects are able to selectively ignore the local letters, whereas the global ones involuntarily capture attention (Rauschenberger and Yantis Reference Schneps, Rose and Fisher2001). Finally, neuroimaging studies show that the visual cortices in the right and left hemisphere are more active when subjects process global and local letters, respectively (e.g., Fink et al. Reference Evans, Shedden, Hevenor and Hahn1997; Evans et al. Reference Everatt, Steffert and Smythe2000; Han et al. Reference Han, Weaver, Murray, Kang, Yund and Woods2002). Since this hemispheric differentiation occurs at an early stage of visual processing, the bias that normal humans have toward global features of stimuli seems to depend on basic perceptual mechanisms, rather than mere habit.
Adapted from Chen (Reference Chen2005), 575.

Local and global figures in A are consistent, whereas those in B are inconsistent. Adapted from Navon (Reference Perini1977).

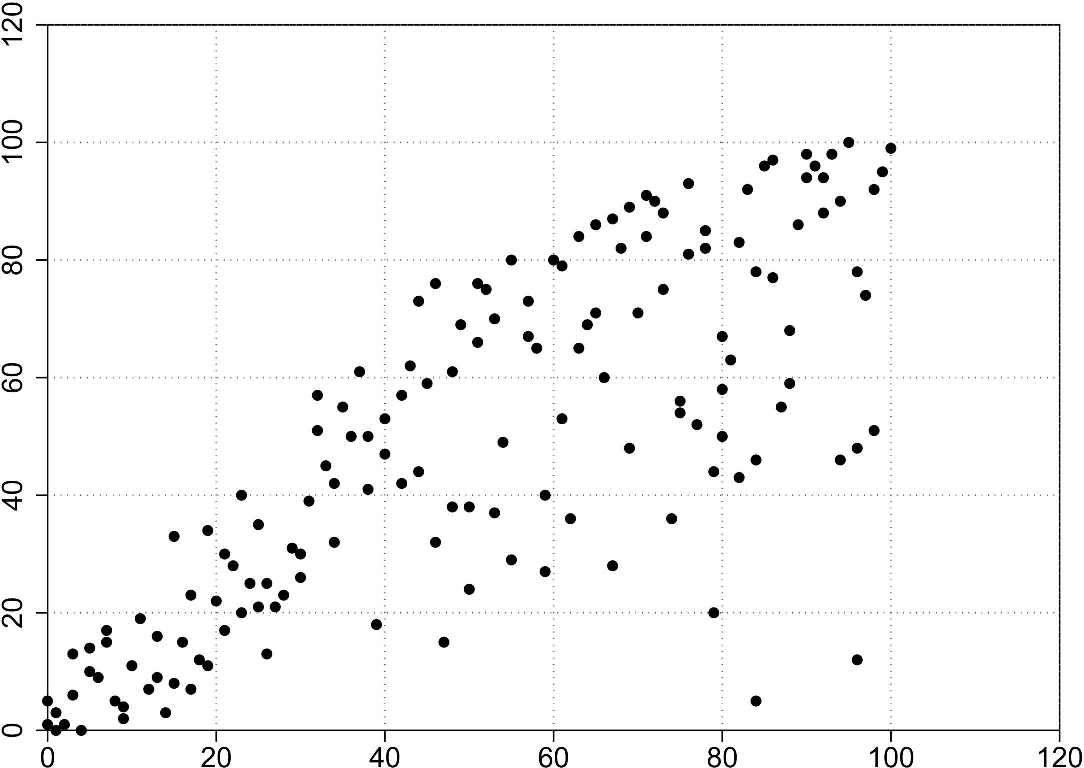
I contend that certain conventions of visual representation play to these basic mechanisms in the human visual system. For example, a trend in a scatter plot, especially as more points are represented, increasingly resembles (or, more accurately, becomes) a “gappy pattern” like those in figure 3 (see fig. 5). Convention is still required for the scientist to interpret these spatial patterns as meaningful relations between data and to recognize that the graph is a representation. Yet these spatial patterns capture attention and are easily processed because of mechanisms in human vision. Thus, the aspects of a data set that a graph conventionally emphasizes, like many conventions, cater to the abilities and limitations of humans who use them. No matter how much expertise one gains with numerical arrays, the formal features of these representations will not allow their audience to draw on the mechanisms of visual pattern detection in order to facilitate understanding.
Figure 5

Another way to see the bias that typical humans have toward pattern detection is to consider atypical cases like autism and dyslexia. In visual tasks (and in their cognition generally), autistics tend to be biased toward, and more effective at processing, local features than neurotypicals (for a review, see Happé and Frith Reference Happé and Frith2006). One experiment had autistic and neurotypical children respond to Navon's embedded letters task (Reference Perini1977), which tests for global versus local processing (see above and fig. 4). When children were told to respond to a letter regardless of whether it appears at the local or the global level, autistics performed better at the local tasks, whereas neurotypicals did the opposite (Plaisted, Swettenham, and Rees Reference Rauschenberger and Yantis1999). The hypothesis that autistics have a bias toward, and aptitude for, local processing can explain other behavioral phenomena that are associated with autism, such as perfect pitch. Moreover, “persistent preoccupation with parts of objects” (American Psychiatric Association 1994; cf. Happé and Frith Reference Happé and Frith2006) is a diagnostic for the disorder.
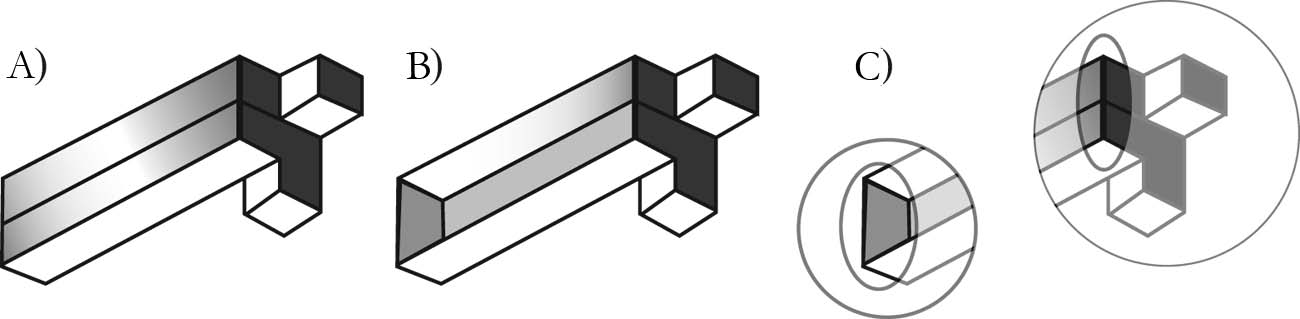
Some forms of dyslexia—which is defined as a reading disability—may arise from an abnormality that has the opposite affect. Compared to the normal population, many dyslexics appear to better process information at the periphery of vision than the center (Schneps, Rose, and Fisher Reference von Karolyi2007). Dyslexics, for instance, tend to perform better than controls on the “impossible figures task,” where subjects must distinguish visual representations of possible from impossible geometric figures (von Karolyi Reference Wilhelmson, Jewett, Shaw, Wicker, Arrott, Bushell, Bajuk, Thingvold and Yost2001). This task requires that one compare features of objects that are too far apart to simultaneously hold in the center of vision, which bisects a 2° visual angle (see fig. 6). Schneps et al. postulate, therefore, that dyslexics can recognize impossible figures quickly because they can compare their global features in the periphery of vision, whereas normal subjects must store such information in working memory and look back and forth (Reference von Karolyi2007, 133–34).
A is a possible geometric figure, whereas B is impossible; C highlights the edges that a subject must compare to determine that B is impossible. Adapted from Schneps et al. (Reference von Karolyi2007).

Consider how the epistemic import of visual representations might differ among populations of neurotypicals, autistics, and dyslexics. Unlike the normal population, autistics may have the local perceptual ability to precisely locate each point on a graph and may have a perceptual bias to do so. Autistics’ local bias could also diminish the extent to which visual representations emphasize global patterns in a data set. In contrast, when compared to the normal population, dyslexics might find that visual representations facilitate the detection of global patterns even more easily and effectively.Footnote 5
If my analysis is correct, one would expect autistics to find numerical representations more epistemically useful and visual representations less useful than would the normal population. The opposite should be true of dyslexics. Interestingly, robust data on career choices in both populations may provide (admittedly post hoc and preliminary) empirical evidence that autistics and dyslexics have these representational biases. Autism (which is heritable) is more prominent in families of physicists and mathematicians (Baron-Cohen et al. Reference Baron-Cohen, Bolton, Wheelwright, Scahill, Short, Mead and Smith1998), fields in which numerical representation is prominent. Admittedly, specific experiments would be necessary to show that a bias in representational style mediates autistics’ career choices. Dyslexia, however, is more closely tied to representational style. Because dyslexia is defined as a reading disability, it involves a deficit in the use of textual representations. Moreover, compared to the population as a whole, dyslexia is significantly more prominent “in visually intensive pursuits, such as science or art” (Schneps et al. Reference von Karolyi2007, 132; cf. Everatt, Steffert, and Smythe Reference Fink, Halligan, Marshall, Frith, Frackowiak and Dolan1999; Wolff and Lundberg Reference Wolff and Lundberg2002).
6. Conclusion
Throughout this article, I aimed to defend and develop a cognitive epistemology of scientific representation. In section 2, I argued that epistemology should consider more than the content a representation has in principle. Epistemologists should also examine how, in practice, representational styles facilitate understanding in a human scientific audience. In order to do so, I suggested that we ask whether a partially idealized interlocutor could understand a representation. This interlocutor would be fluent in the linguistic and scientific dialect in which the representation is presented but also have human cognitive abilities and limitations.
We can also specify the generic set of cognitive abilities and limitations that our partially idealized interlocutor has and suppose that she has features of human cognition that representational styles cater to. One such feature, I believe, is the bias in normal vision toward global pattern detection. My epistemology suggests that variance in these features of cognition would also lead to variance in the epistemic advantages and disadvantages of visual representations. One way that philosophers can theorize about this epistemic possibility is to examine empirical research on subgroups of the population who systematically vary with respect to the relevant cognitive features (e.g., neurotypicals, autistics, and dyslexics). In this respect and others, epistemologists can add empirical psychology to our philosophical toolbox.
When a scientist represents data, she must be concerned with more than just “the particular habits of seeing and representing that are ingrained in the viewer” (Goodman Reference Goodman1968, 14). Scientists must care about the viewer himself, about whether the viewer's cognitive limitations and abilities will make a convention epistemically effective. Considerations about a representation's audience are often engrained in representational convention and, as such, become (not without irony) “virtually automatic habit … so transparent that we are not aware of any effort, of any alternatives” (36).
But alternative representational styles exist, and many times they enhance or detract from the epistemic value of a representation just because of the cognitive resources that humans scientists have to interpret them. I do not believe that cognitive science should replace talk of the formal properties of representations. In this article, I wove the two discussions together. Our epistemology of scientific representation should employ a toolbox that is diverse enough to consider both the representations that scientists use and the scientists who use representations.