


By assuring that treatment is independent of other variables, randomized experiments remove the need to use control variables to obtain unbiased estimates of causal effects. Despite this famous property, auxiliary variables are still important to the design and analysis of randomized experiments. Prognostic covariates – variables that are measured pre-treatment and are predictive of the outcome – can be used to reduce sampling variability in estimates of treatment effects, reducing standard errors without introducing meaningful biasFootnote 1 and thereby increasing statistical power. Blocked randomization achieves similar benefits by incorporating covariates into the randomization procedure (Gerber and Green Reference Gerber and Green2012).
Covariate adjustment also invites misuse. When researchers are free to choose among many possible variables and estimation procedures, they may consciously or unconsciously choose to report covariate-adjusted estimates only when they happen to support their theory (Lin Reference Lin2013). Preregistration can resolve this issue. By specifying exactly what variables and estimator they intend to use, researchers can provide evidence that the estimation procedure was selected because of its anticipated effect on the standard error rather than its actual effect on the point estimate or statistical significance (“p-hacking”).
Some believe that covariate adjustment is only necessary in case of covariate imbalance: when measures of observable characteristics indicate that due to bad luck, one type was disproportionately assigned to treatment or control. In fact, precision gains from covariate adjustment do not depend on the presence or absence of imbalance (Permutt Reference Permutt1990; Wang et al. Reference Wang, Ogburn and Rosenblum2019). At the preregistration stage, then, it only makes sense to prefer the estimator with the lower standard error. Though the unadjusted estimate’s higher threshold for rejecting a null hypothesis may make it feel more conservative, this is an illusion. In hypothesis testing, the Type I error rate is set by the researcher (e.g., p < 0.05). The larger standard error means that the unadjusted estimation procedure yields less accurate estimates on average. The rejection threshold is set higher precisely to account for this greater inaccuracy. A larger standard error makes an estimate less trustworthy, not more conservative.
Although covariate adjustment is always worth considering, it is not always possible or desirable. Prognostic covariates may not be available or may not be feasible to collect. In surveys, placing a pre-treatment measure of the outcome earlier in the same instrument can attenuate treatment effects (Jordan et al. Reference Jordan, Ollerenshaw and Trexler2026). In small samples, the fact that adjusted estimators are consistent and not unbiased is more of a concern.1 And in the case of natural experiments, the researcher may not know what covariates are available until it is too late to credibly pre-register.
Though it is not reasonable to expect experimental researchers to use covariate adjustment in every case, one would hope that as statistical understanding of covariate adjustment has improved (Freedman Reference Freedman2008a; Lin Reference Lin2013; Ye et al. Reference Ye, Shao, Yi and Zhao2023), the research community would increasingly move toward the practice of preregistering a specific covariate-adjusted estimator that is then used to produce the preferred treatment effect estimate(s). Accordingly, we undertook a systematic assessment of covariate adjustment practices in leading political science journals.
Approach
We examined all 478 articles containing randomized experiments in ten political science journals in 2013, 2018, 2023, and 2024. We consider the “big three” U.S.-based journals (American Journal of Political Science (AJPS), American Political Science Review (APSR), and Journal of Politics (JOP)) and seven other well-regarded journals: the British Journal of Political Science (BJPS), Comparative Political Studies (CPS), the European Journal of Political Research (EJPR), International Organization (IO), Political Behavior (PB), Political Psychology (PP), and World Politics (WP). For each article, we examined the article and preregistration and coded:
-
• The presence or absence of a covariate-adjusted estimate in the article or appendix. Covariate-adjusted estimates must control in some way for characteristics of the units that are randomly assigned, e.g., by controlling for a pre-treatment measure of the outcome, demographic characteristics, or unit fixed effects. Blocked random assignment was counted as covariate adjustment unless the blocking variables were not used in the estimation procedure.
-
• The presence or absence of unadjusted estimates in the article or appendix. These are almost always difference in means estimates.
-
• The role that the adjusted and unadjusted estimates play in the analysis and interpretation. Estimates were coded as the preferred or “main” estimate if they were featured more prominently in results summaries and descriptions of the methodology. Estimates were coded as robustness checks if they are described as such or if they otherwise play a subsidiary role. When no distinction could be drawn, the estimates were coded as playing an equal role.
-
• Preregistration practices as they relate to covariate adjustment: was there any preregistration? Did the preregistration mention covariate adjustment? And how specifically did the preregistration describe the estimation procedure and variables or variable selection procedure (does not mention, vaguely, or exactly)? Most vagueness was due to incomplete lists of variables. Unspecified “regression” was assumed to mean OLS and coded as an exact description of the estimation procedure.
We coded only the average treatment effect estimate(s), which typically appear first. For studies that jump straight to heterogeneous effects, we coded that estimation procedure instead, counting controls for any variable other than the moderator as covariate adjustment (similar to Peterson et al. Reference Peterson, Tyler and Prinetti2026). For articles with multiple studies, we coded each study separately before aggregating to the article level. For example, Graham and Singh (Reference Graham and Singh2024) used the difference in means estimator in Study 1 and a covariate-adjusted estimator in Studies 2 and 3. This counts as 0.67 articles that use adjustment and 0.33 that do not.
We excluded four categories of studies. First, studies that are described as experiments but do not actually randomly assign individuals to different treatment conditions. Second, natural experiments, for which preregistration is not usually possible. Third, forced-choice conjoint experiments, in which the outcome variable’s mean is 0.5 for all respondents (because each respondent selects exactly one profile per pair) and hence cannot be correlated with any respondent characteristic. Fourth, list experiments, which can be adjusted but not as straightforwardly.
Results
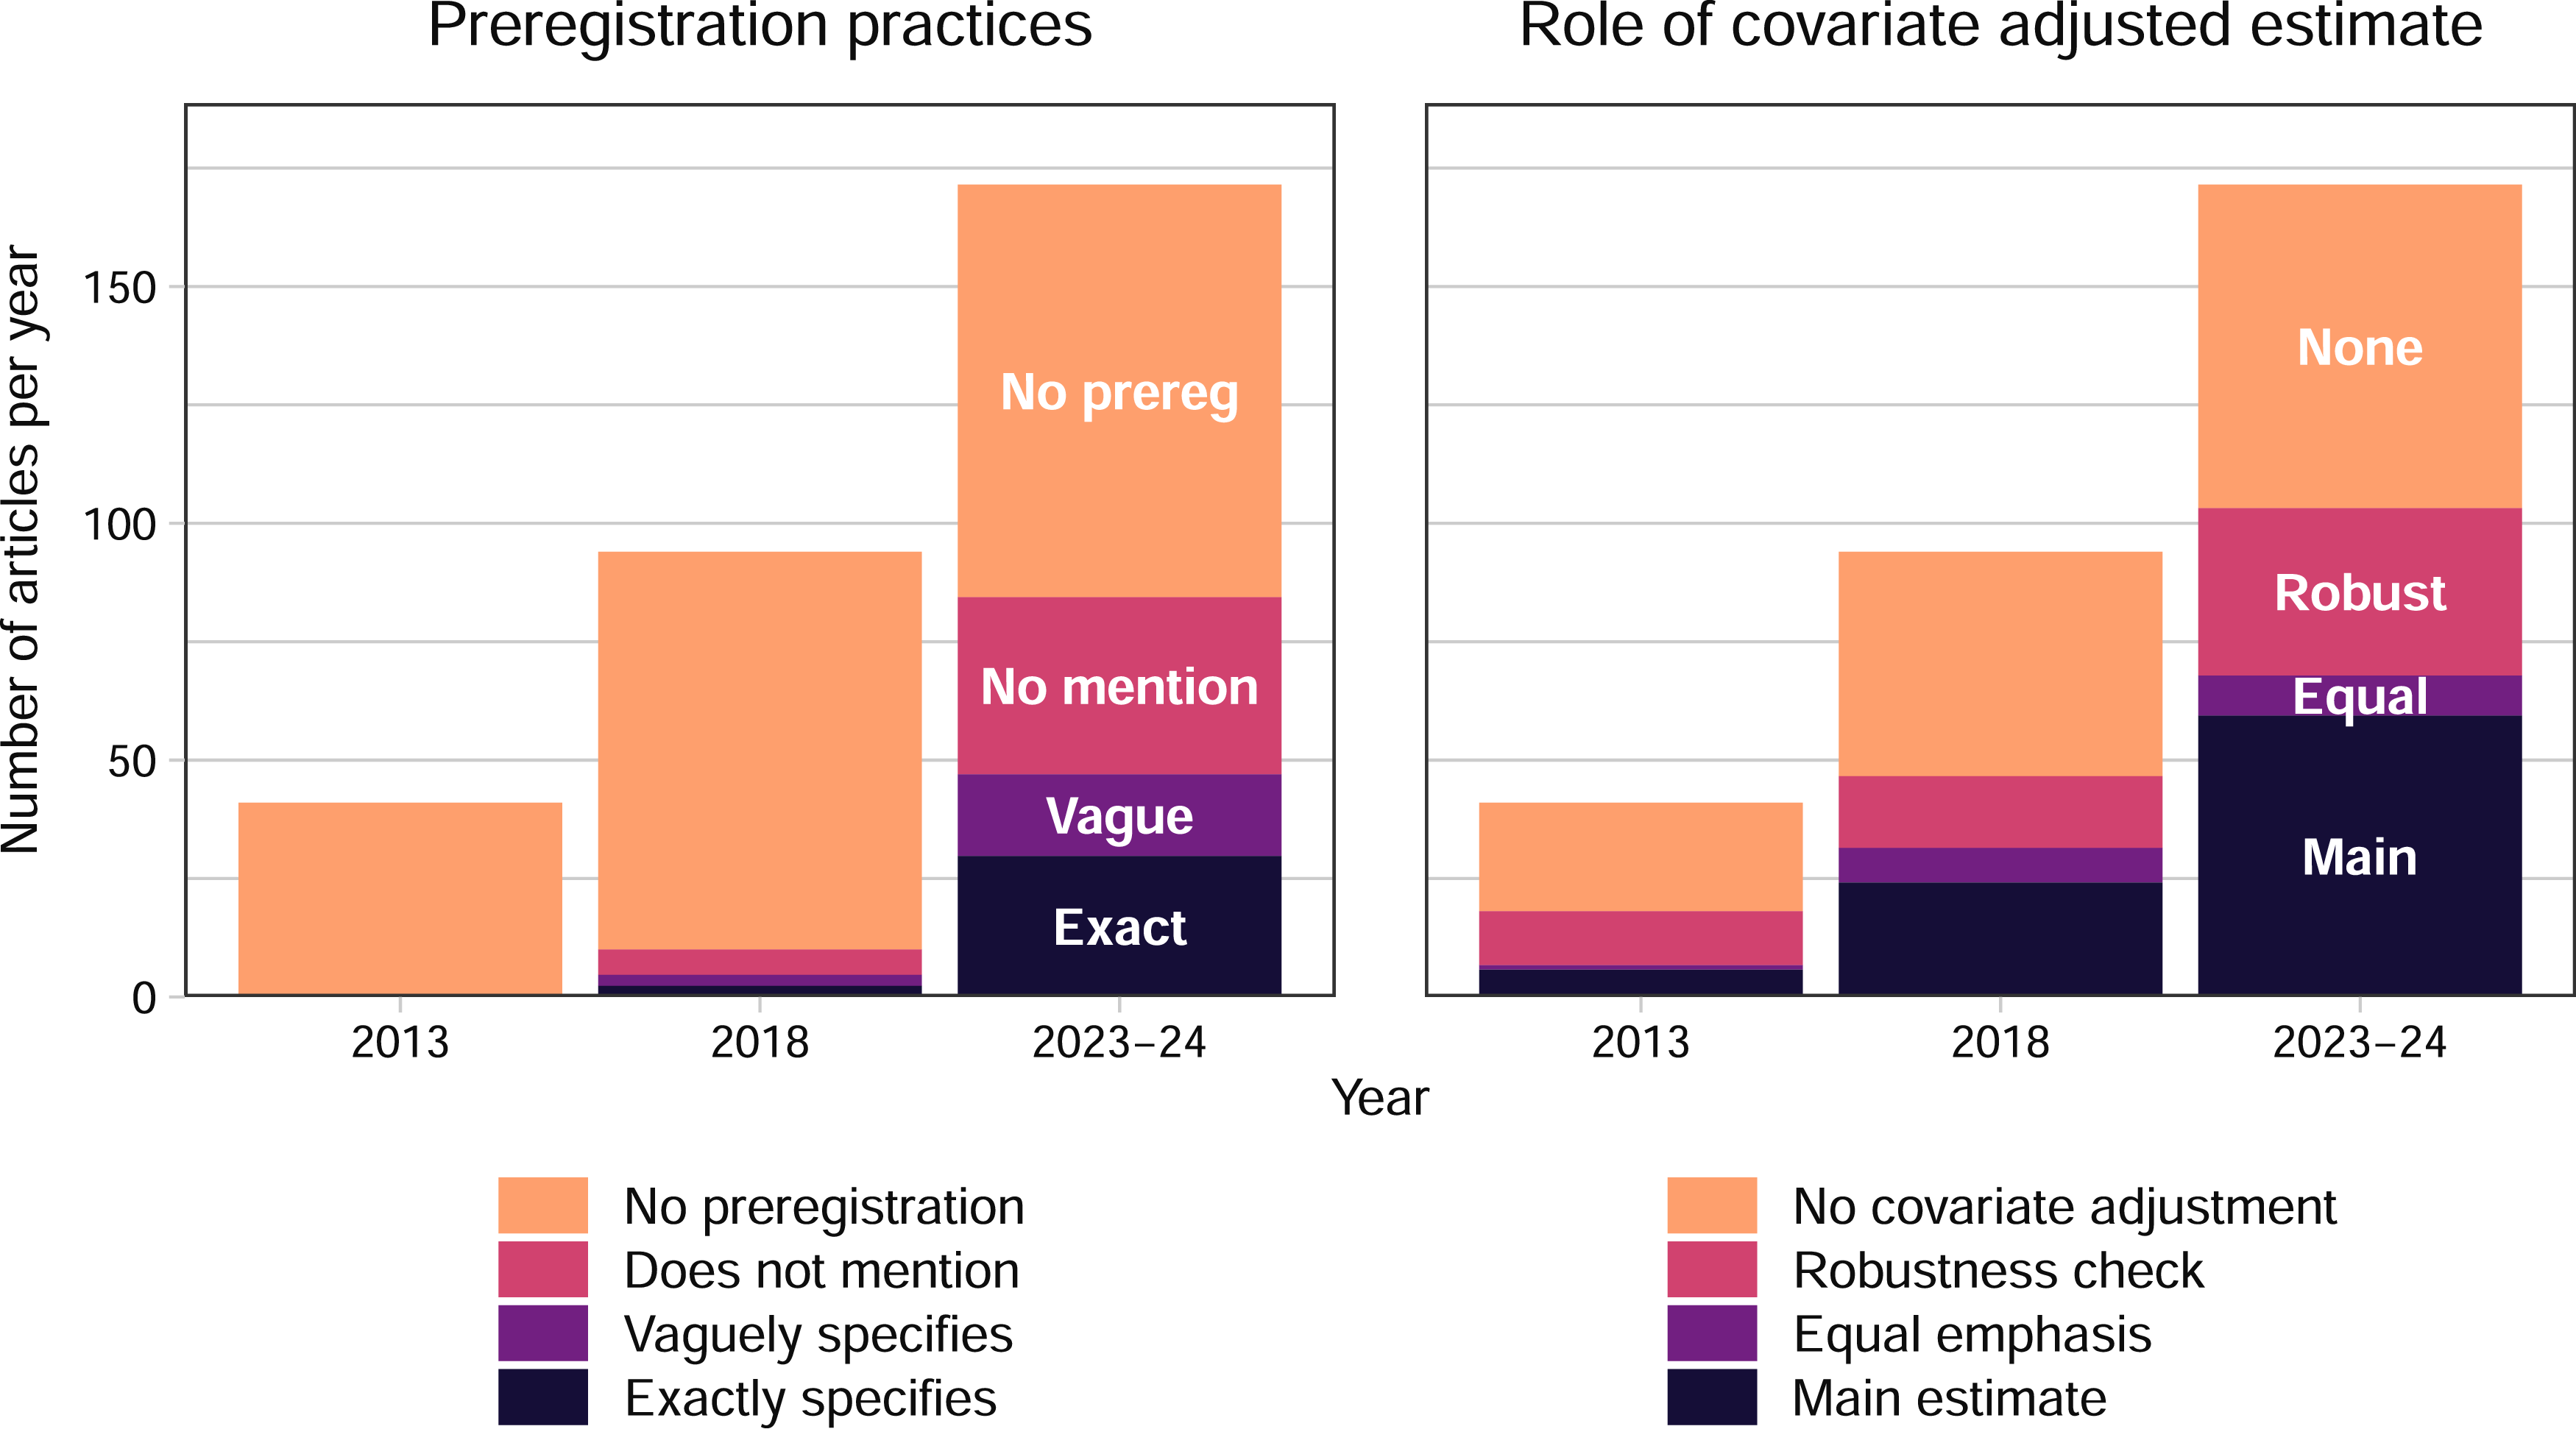
The 2013 to 2024 period saw rapid growth in experimentation in political science (Figure 1, Table SM-1). Among experimental studies, preregistration and covariate adjustment also grew in popularity. In 2013, 41 articles containing experiments were published, constituting 9.6% of the total number of articles in the 10 journals. None were preregistered. About 56% contained no covariate adjustment at all, and 28% used adjustment as a robustness check. Given the lack of preregistration, it is reassuring that just 14% used adjustment as the main estimate. By 2023–24, 343 articles with experiments were published (171.5 per year). Nearly half were pre-registered. About 40% used covariate adjustment for the main estimate, with another 21% using it for a robustness check.
Preregistration and covariate adjustment practices, 2013–24.

Figure 1. Long description
Panel A: A bar graph showing the number of articles per year that follow different preregistration practices from 2013 to 2024. Table SM-1 contains the same information. The horizontal axis represents the years 2013, 2018, and 2023-24. The vertical axis represents the number of articles per year. The bars are stacked and color-coded to represent different preregistration practices: No preregistration (orange), Does not mention (light purple), Vaguely specifies (purple), and Exactly specifies (dark purple). The graph shows an increase in the number of articles over time, with a notable rise in articles with preregistrations that exactly specify covariate adjustment practices by 2023-24. Panel B: A bar graph showing the role of covariate adjusted estimates in articles from 2013 to 2024. The horizontal axis represents the years 2013, 2018, and 2023-24. The vertical axis represents the number of articles per year. The bars are stacked and color-coded to represent different roles: No covariate adjustment (orange), Robustness check (light purple), Equal emphasis (purple), and Main estimate (dark purple). The graph shows an increase in the number of articles over time, with a significant rise in articles that use covariate adjustment for the main estimate by 2023-24.
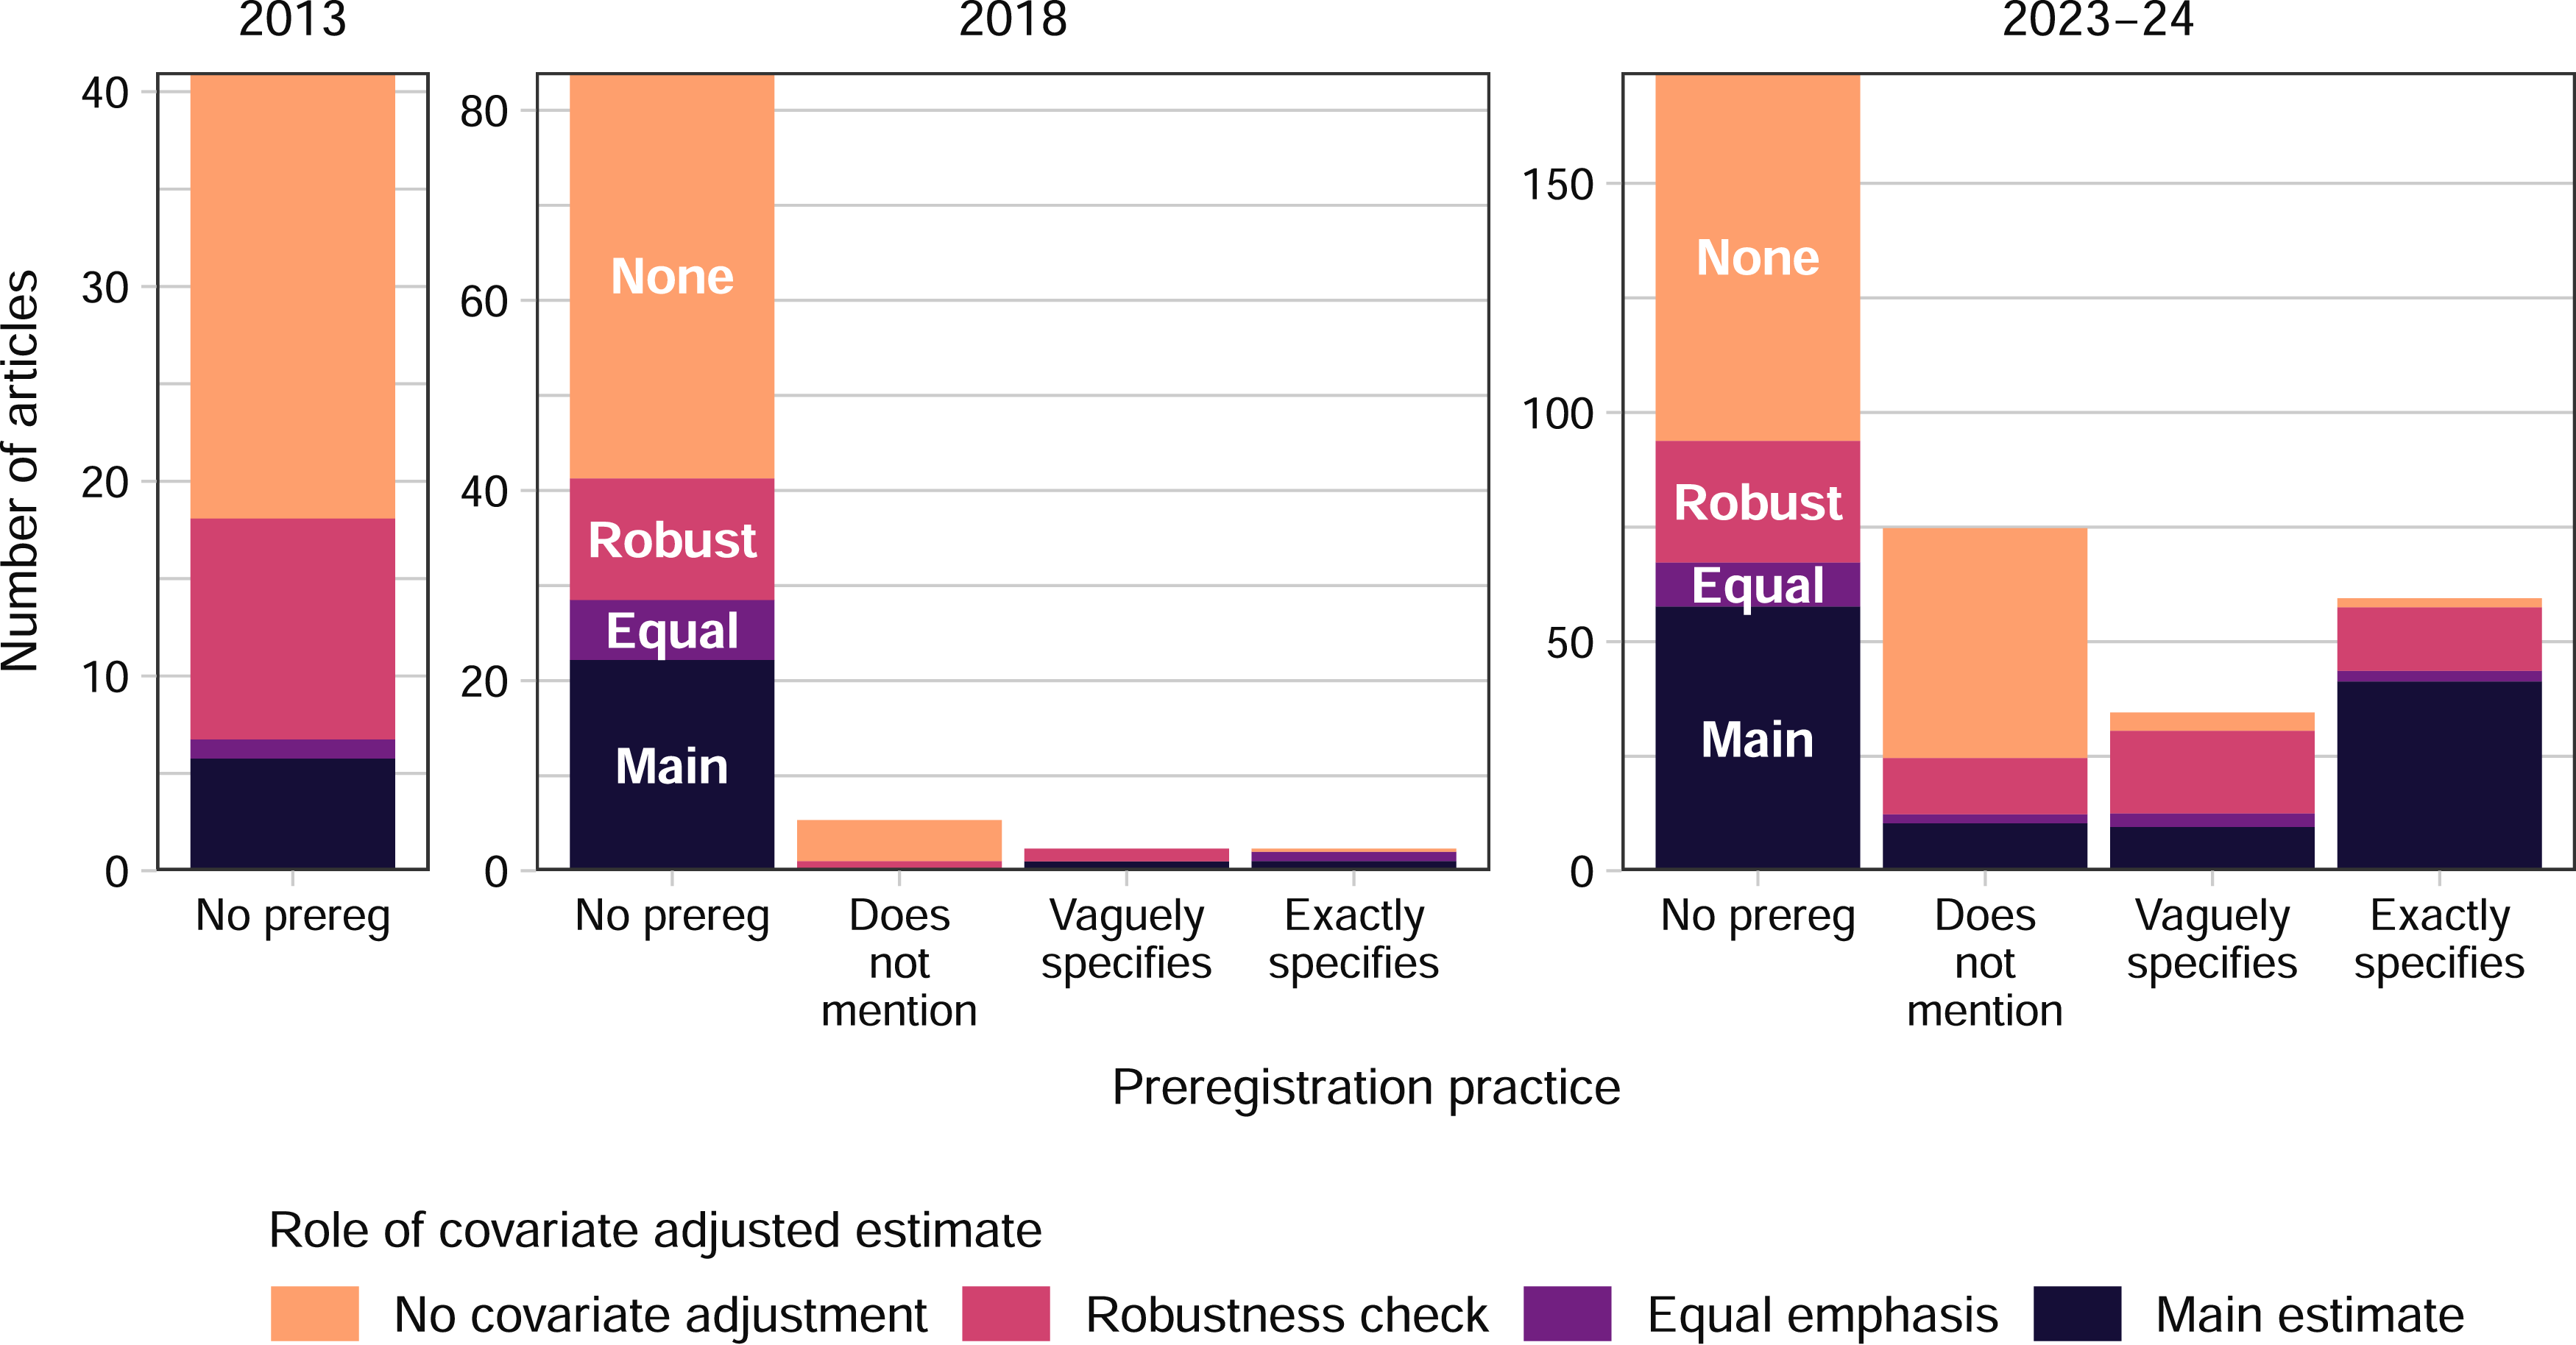
To harness covariate adjustment’s benefits in a credibly principled manner, researchers must preregister the specific variables and estimator they intend to use (see above). Figure 2 displays the intersection of these practices over time, allowing the y-axis range to vary to facilitate comparisons of experimental practice across time. Table SM-2 displays all of the following summary statistics. Encouragingly, preregistration practice is a strong predictor of later adjustment practice. In 2023–24, the large majority of articles that preregister a specific procedure use adjustment for the main estimate or give it equal emphasis (74%), while most studies with preregistrations that do not mention adjustment do not use it at all (67%) or use it only as a robustness check (16%). Discouragingly, more than half of articles that use covariate adjustment for the main estimate either were not preregistered (49%) or had a preregistration that did not mention adjustment (9%; compare the size of the black areas in Figure 2’s right panel or see Table SM-2, column 6). Only 12% of all experimental articles in 2023–24 followed what we consider to be the best practice in our classification scheme: using adjustment for the main estimate after preregistering a specific procedure (Table SM-2, column 7). Though far from ideal, these figures represent substantial improvement relative to 2018, when 92% of articles that used adjustment for the main estimate did not preregister this choice and just 1% of all articles met our best practice criteria (Table SM-2).
Role of covariate-adjusted estimates by preregistration practice, 2013–24.

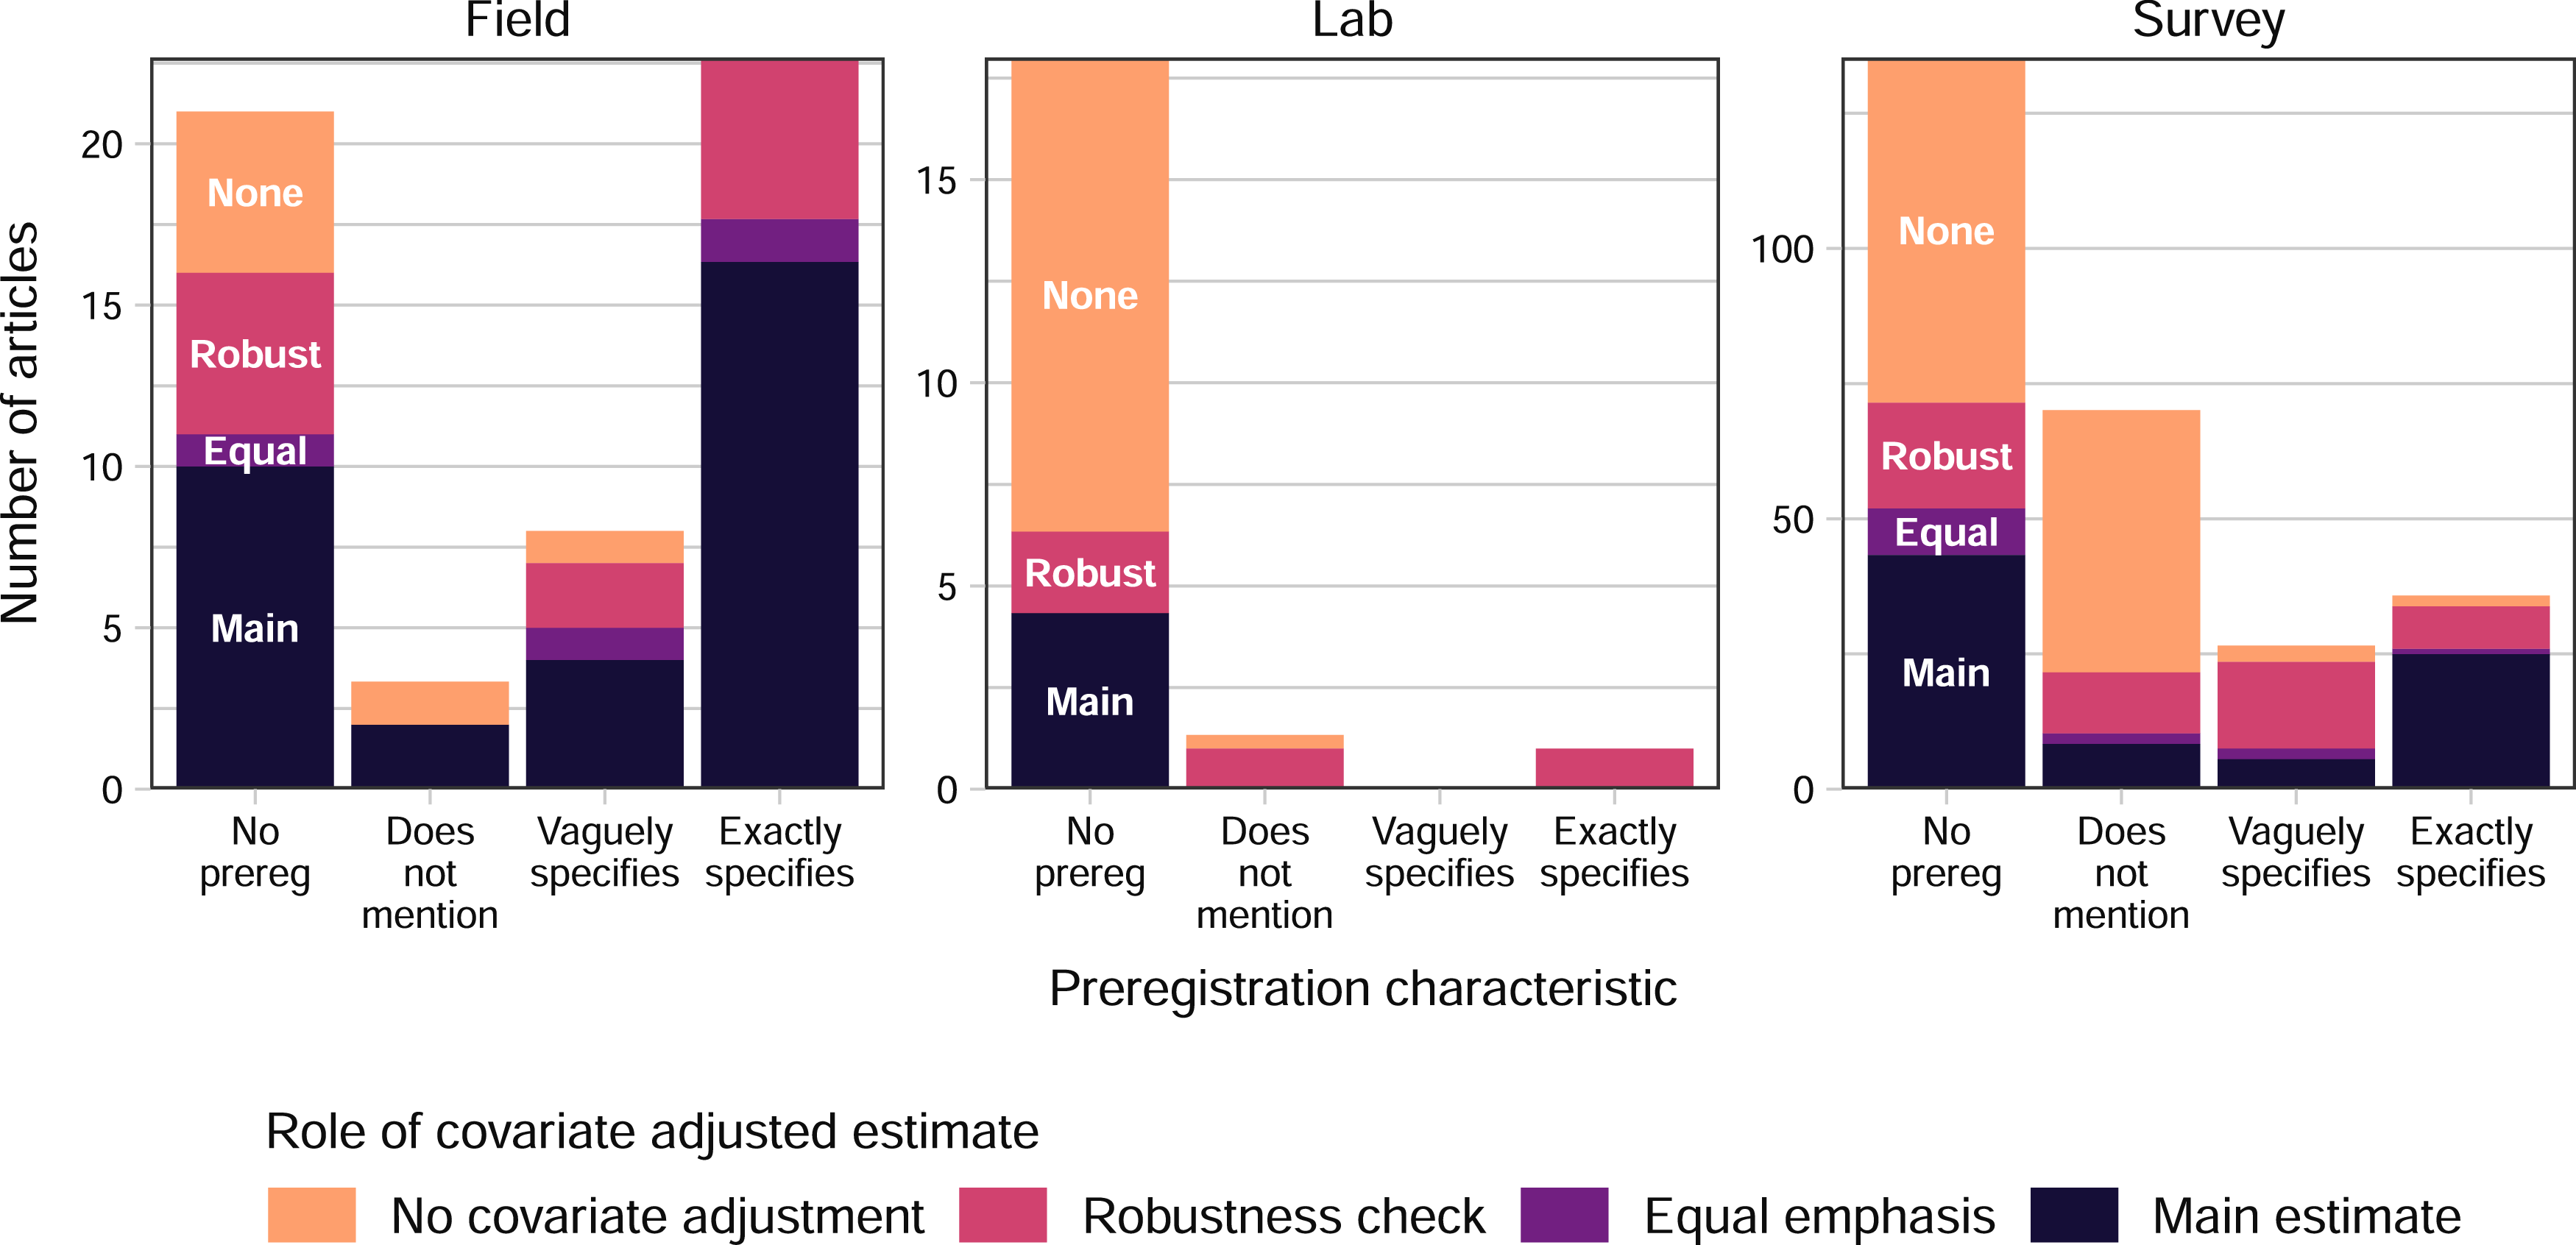
We next split the results by experimental setting (Figure 3), focusing on the 2023–24 period. Field experiments are most likely to be preregistered with an exact adjustment procedure but are also more likely to use adjustment when no preregistration is present. However, some of these incorporated only covariates from a blocked randomization, which are locked in before the results are known. Survey experiments are less likely to be preregistered, but preregistration practices are more predictive of the article’s practices. Meanwhile, lab experiments are rarely preregistered and rarely use covariate adjustment for the main estimate. Our impression is that this often reflects the complex nature of the design and data analysis (e.g., charting the evolution of several behaviors across dozens of trials).
Role and preregistration practice by experimental setting, 2023–24.

Figure 3. Long description
Panel A: A bar graph showing the number of articles in field settings. Table SM-3 contains the same information. The horizontal axis represents preregistration characteristics: No prereg, Does not mention, Vaguely specifies, and Exactly specifies. The vertical axis represents the number of articles. The bars are stacked and color-coded to represent different roles of covariate adjusted estimates: No covariate adjustment (orange), Robustness check (pink), Equal emphasis (purple), and Main estimate (dark blue). Panel B: A bar graph showing the number of articles in lab settings. The horizontal axis represents preregistration characteristics: No prereg, Does not mention, Vaguely specifies, and Exactly specifies. The vertical axis represents the number of articles. The bars are stacked and color-coded to represent different roles of covariate adjusted estimates: No covariate adjustment (orange), Robustness check (pink), Equal emphasis (purple), and Main estimate (dark blue). Panel C: A bar graph showing the number of articles in survey settings. The horizontal axis represents preregistration characteristics: No prereg, Does not mention, Vaguely specifies, and Exactly specifies. The vertical axis represents the number of articles. The bars are stacked and color-coded to represent different roles of covariate adjusted estimates: No covariate adjustment (orange), Robustness check (pink), Equal emphasis (purple), and Main estimate (dark blue).
Finally, we split the results by journal, again focusing on 2023–24 (Figure 4). We combine the behavior journals (PB and PP), comparative journals (CPS and EJPR), and international relations journals (IO and WP) due to the roughly similar distribution of practices within each pair. Among the ten journals, the Journal of Politics was the leader in credible covariate adjustment practices during this period. It is the only journal in which more than half of articles that use covariate adjustment for the main estimate or emphasize it equally also preregistered a specific adjustment procedure (top panel). Even in this case, however, some preregistered articles use adjustment as a robustness check, while others use it for the main estimate without preregistering this intent. Though the ten journals vary in their strengths and weaknesses, all have room for improvement.
Role and preregistration practice by journal, 2023–24.

Conclusion and recommendations
Between 2013 and 2024, political scientists rapidly adopted covariate adjustment as an estimation procedure. Alongside covariate adjustment’s growing popularity, the discipline’s use of it also became more credible, representing a great deal of successful effort to promote best practices. On the flip side, just 12% of the articles published in 2023 and 2024 preregistered a specific procedure and used adjustment for the main estimate. Although this percentage should not be expected to reach 100, there is clearly room for improvement. Based on the intersection of theory and practice, our core recommendation is that when collecting prognostic covariates is feasible, researchers should preregister a specific covariate adjustment procedure and use it as the main estimate regardless of covariate balance.
In political science, the most common form of covariate adjustment is to add covariates X as controls in an OLS regression of the form
 $Y_i = \beta _0 + \beta _1 {\rm Treatment}_i + \sum \beta _k X_{ki} + \epsilon _i$
. Except in two-arm trials with equal probability of assignmentFootnote
2
, this estimator can result in larger asymptotic standard errors when treatment effects are heterogeneous (Freedman Reference Freedman2008b; Lin Reference Lin2013, 312). Lin’s (Reference Lin2013) estimator overcomes this: centering covariates at their means and including a full set of treatment × covariate interactions assures that adjustment does not harm asymptotic efficiency. For forms of regression other than OLS, such as Logit, Lin-style estimators offer greater advantages, outperforming the more common approach even in the special case of a two-armed trial with equal assignment probabilities (Ye et al. Reference Ye, Shao, Yi and Zhao2023, 2375).Footnote
3
These properties make Lin’s estimator a safer default. Yet even the guarantee that Lin-style estimators do not harm asymptotic precision presumes sufficiently large treatment arms relative to a modest, prespecified covariate set. With small treatment arms, many covariates, or high leverage, fully interacted adjustment can be unstable (Lin Reference Lin2013, 301; Ye et al. Reference Ye, Shao, Yi and Zhao2023, 2374).
Selecting a covariate adjustment procedure does take additional effort at the design stage. Fortunately, using the most sophisticated procedure out there is not the most important thing. What is essential is to identify prognostic covariates, pre-register a specific and suitable approach, and stick with it. A specific procedure should identify the covariates, the standard error estimator, and how clustering, blocking, or small sample corrections will be handled. Since using too many covariates can cause harm, researchers should either identify the most prognostic covariates in advance using extant data or pre-specify a selection procedure (e.g., Bloniarz et al. Reference Bloniarz, Liu, Zhang, Sekhon and Yu2016).
Taking full advantage of covariate adjustment’s benefits could require a shift in preregistration culture. Many preregistrations revolve around theoretical predictions and present little or no analysis plan. In our opinion, the analysis plan is the part that adds value. Theory is of course important to design, but trying to be an oracle by registering predicted results creates a perverse incentive to p-hack – the opposite of preregistration’s intent. A specific analysis plan reduces this temptation, allowing researchers to select among estimators in a credibly principled manner. Broader adoption of this approach to covariate adjustment would help political scientists learn more from experiments.
Supplementary material
The supplementary material for this article can be found at https://doi.org/10.1017/XPS.2026.10040.
Data availability
The data, code, and any additional materials required to replicate all analyses in this article are available at the Journal of Experimental Political Science Dataverse within the Harvard Dataverse Network, at https://doi.org/10.7910/DVN/KRLQJW (Graham and Hoang Reference Graham and Hoang2026).
Acknowledgements
Kyle Peyton provided invaluable feedback. Lilla Orr, Shikhar Singh, the anonymous reviewers, and poster session attendees at the annual meeting of the American Association for Public Opinion Research also provided helpful comments. The authors take full responsibility for any errors.
Funding statement
This research was supported by the Liberal Arts Undergraduate Research Award program, Temple University.
Competing interests
The authors declare none.
Ethics statement
The research did not involve human subjects.



 Open access

