Introduction
Quinoa (Chenopodium quinoa Willd.) is an Andean crop with a great world attention (Bazile et al., Reference Bazile, Jacobsen and Verniau2016a, Reference Bazile, Pulvento, Verniau, Al-Nusairi, Ba, Breidy, Hassan, Maarouf, Mambetov, Otambekova, Sephavand, Shams, Souici, Miri and Padulosi2016b) for its extraordinary nutritional properties (Bazile et al., Reference Bazile, Bertero and Nieto2015; González et al., Reference González, Eisa, Hussin, Prado, Murphy and Matanguihan2015) and for its potential as an industrial crop, i.e. quinoa starch can be used to stabilize emulsions (Rayner et al., Reference Rayner, Sjöök, Timgren and Dejmek2012), quinoa flour was proposed as ingredient for meat burger instead of soybean flour to get better and more healthy products (Shokry, Reference Shokry2016), to obtain saponins with potential application in the food, cosmetics, agricultural and pharmaceutical industries (El Hazzam et al., Reference El Hazzam, Hafsa, Sobeh, Mhada, Taourirte, EL Kacimi and Yasri2020), among other uses. This species is also useful as fodder (González et al., Reference González, Martín, Bruno and Prado2016; Asher et al., Reference Asher, Galili, Whitney and Rubinovich2020) or in decontamination processes (Thomas and Lavkulich, Reference Thomas and Lavkulich2015; Shabbir et al., Reference Shabbir, Abbas, Asad, Razzaq, Anwar-ul-Haq and Amjad2021). Due to its outstanding plasticity, quinoa constitutes an alternative crop capable of adapting to the climate change scenarios (Ruiz et al., Reference Ruiz, Biondi, Oses, Acuña-Rodríguez, Antognoni, Martinez-Mosqueira, Coulibaly, Canahua-Murillo, Pinto, Zurita, Bazile, Jacobsen and Molina Montenegro2014; Alandia et al., Reference Alandia, Rodriguez, Jacobsen, Bazile and Condori2020; Andreotti et al., Reference Andreotti, Bazile, Biaggi, Callo-Concha, Jacquet, Jemal, King, Mbosso, Padulosi, Speelman and Van Noordwijk2022). In recent years, this crop has undergone a major expansion. Selected quinoa genotypes were evaluated and successfully cultivated under different environments outside the Andean region with the aim to strengthen food and nutrition security (Bazile et al., Reference Bazile, Jacobsen and Verniau2016a, Reference Bazile, Pulvento, Verniau, Al-Nusairi, Ba, Breidy, Hassan, Maarouf, Mambetov, Otambekova, Sephavand, Shams, Souici, Miri and Padulosi2016b; Alandia et al., Reference Alandia, Rodriguez, Jacobsen, Bazile and Condori2020; Angeli et al., Reference Angeli, Miguel Silva, Crispim Massuela, Khan, Hamar, Khajehei, Graeff-Hönninger and Piatti2020; Asher et al., Reference Asher, Galili, Whitney and Rubinovich2020; Hinojosa et al., Reference Hinojosa, Leguizamo, Carpio, Muñoz, Mestanza, Ochoa, Castillo, Murillo, Villacréz, Monar, Pichazaca and Murphy2021).
Thus, quinoa is unequivocally a multipurpose species. Nowadays farmers interested in achene production are trying to manage quinoa crop in order to obtain a higher achene yield. Hence, several quinoa crop field trials tested different agricultural management practices, such as reduced row spacing and higher plant densities, looking for a yield improvement (Jacobsen and Christiansen, Reference Jacobsen and Christiansen2016; Abdalla et al., Reference Abdalla, Jorge, Abdou, Amidou, Louis and Jacob2020).
Plant density affects plants morphology and productivity. These effects can be explained by water, nutrients (Villalobos et al., Reference Villalobos, Sadras, Fereres, Villalobos and Fereres2016), radiation (Hodgson and Blackman, Reference Hodgson and Blackman1957; Heitholt and Sassenrath, Reference Heitholt, Sassenrath-Cole, Stewart, Oosterhuis, Heitholt and Mauney2010) and CO2 competition (Van Kleunen et al., Reference Van Kleunen, Stephan and Schmid2006) among plants (Lambers et al., Reference Lambers, Chapin and Pons1998). This adaptation implies increases in stem elongation and changes in stem orientation, also changes in number and architecture of the branches to achieve different exposition to solar radiation, among others. Jacobsen (Reference Jacobsen, Bazile, Bertero and Nieto2015) showed that quinoa at low densities has the ability to compensate the empty spaces between plants by changes in its morphology. An increase of the branching system in quinoa under low plant density was also reported by Spehar and da Silva Rocha (Reference Spehar and da Silva Rocha2009) and Abdala et al. (2020). Several authors (Jacobsen et al., Reference Jacobsen, Jørgensen and Stølen1994; Ruiz and Bertero, Reference Ruiz and Bertero2008; Spehar and da Silva Rocha, Reference Spehar and da Silva Rocha2009; Eisa et al., Reference Eisa, El-Samad, Hussin, Ali, Ebrahim, González, Ordano, Erazzú, El-Bordeny and Abdel-Ati2018; Abdalla et al., Reference Abdalla, Jorge, Abdou, Amidou, Louis and Jacob2020; Parwada et al., Reference Parwada, Mandumbu, Tibugari, Badze and Mhungu2020; Cruz Díaz et al., Reference Cruz Díaz, Chaparro, Díaz and Romero Guerrero2021) around the world (Denmark, Argentina, Brazil, Egypt, Burkina Faso, Zimbabwe and Colombia) studied the effect of plant density on quinoa yield. Except for Jacobsen et al. (Reference Jacobsen, Jørgensen and Stølen1994) and Ruiz and Bertero (Reference Ruiz and Bertero2008) who found higher yields increasing plant density; the other researchers found higher yields at lower plant densities. It is worth noting that the researchers above mentioned studied a wide range of plant densities (22 000–600 000 plants per hectare) in different environments.
However, none of the reviewed studies reports on the possible causes that may have generated this drop in yield. Different plant densities and light competition produce changes in leaf anatomy and chloroplast ultrastructure affecting in turn the photosynthetic assimilation rates and productivity (Miltphore et al., Reference Miltphore, Moorby and González Idiarte1982; Feng et al., Reference Feng, Lingyang, Qinlin, Xiaoling, Yuanfang, Muhammad, Yajiao, Junxu, Xiaochun, Taiwen, Weiguo, Jiang, Junbo, Kai and Wenyu2018). Chloroplasts are the main photosynthetic organelle. Decrease in the number of chloroplasts or changes in its structure led to the decrease of photosynthetic pigments, resulting in the decline of net photosynthetic rate and reduced yield (Ren et al., Reference Ren, Liu, Zhang, Dong, Liu and Zhao2017).
Until now, photosynthetic studies in quinoa were limited to gas exchange and its relation with different abiotic stresses (González et al., Reference González, Bruno, Valoy and Prado2011, Reference González, Ponessa, Buedo, Mercado and Prado2014, Reference González, Jacobsen, Buedo, Erazzú, González and Prado2019; Eustis et al., Reference Eustis, Murphy and Barrios-Masias2020; Delatorre-Herrera et al., Reference Delatorre-Herrera, Ruiz and Pinto2021) and very scarce investigations were related to leaf anatomy and chloroplast ultrastructure (González et al., Reference González, Ponessa, Buedo, Mercado and Prado2014; Manaa et al., Reference Manaa, Goussi, Derbali, Cantamessa, Abdelly and Barbato2019).
To understand quinoa yield under different conditions and its extraordinary adaptation to diverse environments, studies relating photosynthesis process with physiology, morphology, leaf structure and ultrastructure are necessary. This kind of investigations are necessary to get a more complete knowledge in relation to quinoa plasticity and to achieve a better understanding of the behaviour of quinoa ecotypes in different environments around the world where this crop is being evaluated as alternative. Thus, the objective of the present research is to analyse under controlled field conditions the effect of different plant densities on quinoa plant morphology, achene yield, leaves anatomy and ultrastructure in terms of chloroplast organization, and how it affects the physiology in relation to photosynthetic assimilation.
Materials and methods
Experimental site
Field trials were carried out in an arid mountain region of Northwestern Argentina (Encalilla, Amaicha del Valle, 22° 31′S, 65° 59′W, 1995 m asl, Tucumán, Argentina). Climatic classification, according to Köppen, is desert type (BWkaw). Daily average air temperatures were 27.3 ± 1.4°C (maximum) and 14.1 ± 1.2°C (minimum) and wind velocity ranged from 10 to 15 km/h, whereas the average of relative humidity (RH, %) was 33.2 ± 4.1% (González et al., Reference González, Bruno, Valoy and Prado2011). The soil is a sandy-clay-loam (organic matter content 0.60%, total nitrogen content of 0.55% and a pH 8.8 and electrical conductivity 2.0 dS/m) with a depth of about 0.5 m (González et al., Reference González, Bruno, Valoy and Prado2011). The soil contains sand (48%), silt (22%) and clay (30%). Na+ is the first exchangeable (615.2 mg/kg) followed by K+ (390.2 mg/kg) and Mg2+ (342.7 mg/kg). Annual rainfall is 200 mm, with more than 70% occurring between September and February.
Plant material
Chenopodium quinoa Willd. CICA-17 variety was used. CICA-17 is a Peruvian variety obtained from Amarilla de Marangani (A. Mújica-Sánchez, personal communication, 2016) and it was grown and adapted for the last 15 years in Encalilla site. According to previous results in our experimental field, CICA-17 showed a life cycle of approximately 150–160 days after sowing, adult plants exhibited an average height between 1.50 and 2.5 m, yellow seeds, high assimilation rates (>30 μmol/m2/s) and yielding of near 2.3 Tn/ha (González et al., Reference González, Bruno, Valoy and Prado2011).
Experimental design
Treatments (two plant densities) were arranged in a randomized complete block design with three replicates. Sowing date was on mid-November for both years, 2018 and 2019. Each plot (10 × 5 m) had five rows (5 m long) with a distance between rows of 0.60 m. Plots were irrigated 24 h before sowing to ensure a good humidity in the soil profile. Hand sowing was performed using a steady flow method. When seedlings had 4–6 leaves, a hand-thinning was carried out to get target plant (pl) densities: 7.2 (±1.0) pl/m (LD: low density, representing 120 240 pl/ha) and 27.9 (±3.0) pl/m (HD: high density, representing 465 930 pl/ha). Target plant densities studied here were selected as intermediate in relation to other published works, higher than the lowest density studied (22 000 pl/ha, Ruiz and Bertero, Reference Ruiz and Bertero2008) and lower than the highest studied with other varieties (600 000 pl/ha, Spehar and da Silva Rocha, Reference Spehar and da Silva Rocha2009).
During both crop cycles (2018/2019 and 2019/2020), plants were irrigated with a drip irrigation system three times a week during the first month and weekly until achene filling stage (800 mm of applied water by crop cycle). The irrigation system was designed in order to ensure no water limitations and twice a week visual observations of plant guttation were done to confirm it. Crops did not show any visible water and/or nutrient limitation during both cycles and were kept free of pests and diseases.
Morphological studies
Plant height (m) and stem diameter (cm) were measured on selected 20 plants in the centre of each plot. Plant height was measured using a tall ruler and stem diameter was determined with a digital Vernier calliper according to Stanschewski et al. (Reference Stanschewski, Rey, Fiene, Craine, Wellman, Melino, Patiranage, Johansen, Schmöckel, Bertero, Oakey, Afzal, Raubach, Miller, Streich, Buchvaldt Amby, Emrani, Warmington, Moussa, Wu, Jacobson, Andreasen, Jung, Murphy, Bazile and Tester2021). Achene yield per plant (g/pl), achene yield (kg/ha) and 1000 achene weight (g) were determined at harvest 160 days after sowing. Specific leaf area (SLA) was calculated as the ratio of leaf area (measured with a leaf area meter LICOR LI-3100C) to leaf dry mass (cm2/g). Leaf dry mass was determined by drying the tissue at 55°C until constant weight was reached. Phosphorous content of the leaves was estimated by the molybdate method (Murphy and Riley, Reference Murphy and Riley1962), whereas the leaf and achene nitrogen content were quantified by the micro-Kjeldahl method with colorimetric ammonium (NH4+) determination (Nkonge and Ballance, Reference Nkonge and Ballance1982). Total protein content was calculated from the nitrogen content using a conversion factor of 6.25.
Anatomical and ultrastructural studies, optic (OM) and transmission electron microscopy (TEM)
Undamaged leaves, without visual effects of pests or diseases, from the fourth node of three individuals of each treatment (LD and HD) sown in the central furrow were selected. Pieces of leaf tissue of approximately 1 mm2 were fixed for 4 h at 4°C in 5% glutaraldehyde (0.1 M phosphate buffer, pH 7.4) for histological and ultrastructural analysis, while the rest of the leaf was fixed in FAA (formalin:ethanol:acetic acid:water; 100:500:50:350, v/v) (Johansen, Reference Johansen1940) at room temperature during 24 h.
Leaf sections of approximately 1 cm2 of the samples fixed in FAA were diaphonized following the Dizeo de Strittmatter (Reference Dizeo de Strittmatter1973) technique, subsequently they were stained with cresyl violet 1% in distilled water and mounted in 50% glycerol for epidermal analyses.
For histological and ultrastructural analysis, the samples fixed in glutaraldehyde were post-fixed in 1% OsO4 (0.1 M phosphate buffer, pH 7.4) for 60 min, dehydrated in a graded ethanol series followed by an ethanol-acetone series and embedded in Spurr's resin (Sigma-Aldrich, St. Louis, MO, USA). Semi-thin sections (1 μm thick) and ultra-thin sections were cut on an ultramicrotome using a diamond knife and mounted on glass slides. Semi-thin sections were stained with 0.5% toluidine blue O (Sigma-Aldrich) in aqueous solution and analysed in a Karl Zeiss Axiostar plus optical microscope. The pictures were taken with a coupled digital camera Axio Cam ERc 5S Zeiss using the AxioVision Rel.4.3 software.
Ultra-thin sections were stained in uranyl acetate followed by lead citrate (EMS, Hatfield, PA, USA), and examined in a TEM LIBRA 120 (Carl Zeiss) transmission electron microscope at the Electron Microscopy Research and Services Center (CISME, CONICET-UNT).
Stomata density (SD) was calculated estimating number of stomata/unit of area and stomata index (SI) was estimated as:

within a unit of area. In cross-sections the number of cells per unit area (mm2) for adaxial palisade (AdPc), spongy mesophyll (SMc) and abaxial palisade (AbPc) layers was determined. The total cross-sectional area of mesophyll tissues without the epidermis (M), the intercellular airspaces area (Ias), the mesophyll area occupied by mesophyll cells (Mce) and by vascular bundle tissues (Vb) considering their parenchyma sheath as part of the structure were measured. The thickness of each tissue (epidermis, adaxial palisade, spongy and abaxial palisade mesophyll) and the total length of the analysed leaf cross section (L) were measured in light microscope images at 200× magnification.
The total length of the mesophyll cell wall exposed to the intercellular air space (lm) and the total length of the chloroplasts touching the plasma membrane appressed to the intercellular air space (lc) were calculated in light and electron microscope images respectively (Xiong et al., Reference Xiong, Huang, Peng and Li2017). Mesophyll surface area exposed to intercellular air spaces per leaf area (Sm) and chloroplast surface area exposed to intercellular airspaces per leaf area (Sc) were calculated from light and electron micrograph respectively as follows:


where F is the curvature correction factor to convert the length in cross-sections to a surface area. F was measured and calculated for each treatment as 1.35 for LD and 1.40 for HD (Thain, Reference Thain1983) with modification suggested by Evans et al. (Reference Evans, Caemmerer, Setchell and Hudson1994). The thickness of the cell wall (Tcw), cytoplasm (Tcyt), chloroplast stroma (Tstr) and the chloroplast area (Ca) were measured from electron micrographs. Chloroplast thickness (Cthi) as a restriction to CO2 penetration was approximated according to Evans et al. (Reference Evans, Caemmerer, Setchell and Hudson1994) as:

Also, the number of chloroplasts (Cnum) per adaxial palisade cell unit was measured. The average value of ten measurements of each quantified parameter per leaf (n = 3 leaf blades per treatment) was informed. For chloroplast parameters, three palisade cells from each repetition and three chloroplasts of the adaxial palisade mesophyll per leaf were evaluated.
The Image J software (National Institute of Health, Bethesda, MD, USA) and AxioVision Rel.4.3 software were used.
Gas exchange
Gas exchange measurements were performed on a sunny day using an open infrared gas analyser (IRGA-6400 XT) equipped with a fluorometer chamber (LI-COR 6400 XT, LI-COR, Lincoln, NE, USA). All measurements were performed on the third uppermost fully expanded leaves located in the main stem at the beginning of flowering stage. The A max (net CO2 assimilation rate under conditions of light and CO2 saturation) estimation was made under constant leaf temperature (usually 25 ± 1°C), photosynthetic photon flux density (PPFD, 1500 μmol/m2/s) and CO2 concentration of 400 μmol CO2/mol air according to Geissler et al. (Reference Geissler, Hussin, El-Far and Koyro2015) and provided by the LI-COR equipment, after a 3–5 min acclimation period.
All measurements were made at a RH of 50–60% and air flow rate of 500 μmol/s. Each measurement was repeated until obtaining at least three stable values in five different plants. All measurements were made from 09:30 to 12:30 am. The carboxylation capacity and maximum carboxylation capacity were expressed as An/Ci and A max/Ci ratios whereas the instantaneous water use efficiency (iWUE) was calculated as A max/g s ratio (Rawson et al., Reference Rawson, Begg and Woodward1977). Light compensation point (LCP), light saturation point (LSP), dark respiration rate (R d) and apparent quantum yield of photosynthetic CO2 assimilation (ØCO2) were calculated from photosynthetic light response curves (An/PPFD curves). The curves were fit according to an exponential function described by Schulte et al. (Reference Schulte, Offer and Hansen2003) using the following equation:

where Y = An, X = PPFD and a, b and c are the calculated parameters. Photosynthetic photon flux densities (PPFD) ranged between 0 and 2500 μmol/m2/s were used.
Pigment contents
Plants used for gas exchange measurements were also used to determine both photosynthetic (chlorophylls and carotenoids) and UV-B absorbing pigments (protective pigments). Chlorophyll and carotenoids were extracted using dimethyl sulfoxide during 12 h in darkness at 45°C, as described by Chappelle et al. (Reference Chappelle, Kim and McMurtrey1992). Chlorophyll a, b and carotenoids contents were calculated from absorbances at 649, 665 and 480 nm according to Wellburn's procedure (Reference Wellburn1994) and expressed as mg/g DW. UV-B absorbing compounds were extracted using acidified methanol:water:HCl, 79:20:1 according to the procedure of Mirecki and Teramura (Reference Mirecki and Teramura1984) determined spectrophotometrically at 305 nm and expressed as Abs305/mg DW.
Statistical analysis
Data were evaluated for homogeneity of variance using Tukey test. The mean values between treatments were compared using the t-test at P ≤ 0.05 level of probability (statistical package SPSS Inc., version 11.0, Chicago, IL, USA).
Results
The following results correspond to averaged data from 2018/2019 and 2019/2020 cropping cycles. It is worth noting that for the first analysis, year was considered as a factor, notwithstanding, no differences between years were found, thus only results for density treatments were analysed. The study site has a desert type climate, the trials were conducted in similar dates between years under irrigation, and no differences in temperature and radiation were registered, explaining the absence of significant differences between years.
Achene yield and morphological parameters
HD treatment showed a decrease of 2863 kg/ha, 4 g/100 g DW, 0.41 g, 0.5 m, 1.3 cm on achene yield, protein content, 1000-achene weight, plant height and stem diameter respectively, when compared to LD. On the contrary SLA was higher in HD compared to LD (Table 1).
Achene yield, morphological parameters, N and P leaf mineral content for low-density (LD) and high-density (HD) planting treatments

Data are the means and standard deviation. Plant height and stem diameter is a mean of 20 different plants. All the others are mean of three plants. SLA, specific leaf area. Different letters indicate significant differences calculated for P ≤ 0.05.
Leaf nitrogen and phosphorus content
Leaf N and P content in quinoa were affected by plant density. A significant decrease was found in HD in relation to LD, with a reduction of 24.1 mmol/m2 for N and 1 mmol/m2 for P (Table 1).
Leaf morphological and anatomical parameters
The general morphological characteristics of the leaves were identical in both treatments. Chenopodium quinoa var CICA-17 showed simple notophyll triangular leaves with long, fine and furrowed petioles. Ovate symmetrical lamina with the wider region at the base. The base was truncate obtuse with rounded obtuse apex and dentate to crenate margin. In superficial view quinoa leaves were amphistomatic as informed by González et al. (Reference González, Ponessa, Buedo, Mercado and Prado2014). Anomocytic stomata types and epidermal bladder cells were observed on both leaf surfaces. Adaxial epidermal cells were isodiametric with slightly curved anticlinal cell walls while abaxial cells presented slightly sinuous anticlinal walls. Stomata densities and index were different (P ≤ 0.05) in both epidermis predominating in the abaxial epidermis (Table 2) and also were affected by plant density treatments, both parameters showed significant differences particularly in the abaxial epidermis, displaying lower densities and indexes in HD compared to LD (Table 2). Total SD (upper epidermis + lower epidermis) decreased from 396 stomata/mm2 under LD to 215 stomata/mm2 in HD. The length of the occlusive cells was slightly mayor at HD treatment probably compensating the minor density observed (Table 2).
Stomata density (SD), stomata index (SI) and stomata dimensions in low-density (LD) and high-density (HD) planting treatments

Data are expressed as mean and standard deviation of ten measurements of each quantified parameter per leaf (n = 3 leaf blades per treatments). Different letters indicate significant differences calculated for P ≤ 0.05.
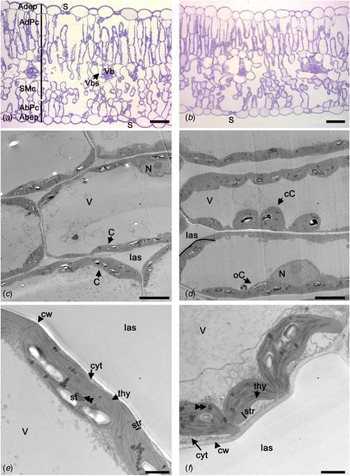
Cross-sections of both assayed treatments showed smooth cuticle and monostratified epidermis with slightly sunken stomata on both epidermal surfaces (Figs 1(a) and (b)). The mesophyll showed heterogeneous isolateral mesophyll with adaxial palisade parenchyma with 2–3 strata, irregular spongy central parenchyma loosely arranged and one abaxial strata of palisade with shorter loosely arranged cells with respect to adaxial palisade. Minor collateral vascular bundles were surrounded by a one-layered parenchyma sheath. Crystaliferous idioblast with calcium oxalate druses were observed without differences among the treatments (Figs 1(a) and (b), Table 3).
Colour online. Chenopodium quinoa Var. CICA. (a, c, e) Low-density sowing (LD) treatment, (b, d, f) high-density sowing (HD) treatment. (a, b) Leaf transection, optic microscopy. (d–f) Cell and chloroplast at TEM. Scales A–B, 50 μm; C–D, 5 μm; E–F, 1 μm. Abbreviations: Abep, abaxial epidermis; AbPc, abaxial palisade cells; Adepc, adaxial epidermis cells; AdP, adaxial palisade; cC, compress chloroplast; C, chloroplast; cw, cell wall; cyt, cytoplasm; double arrow head, plastoglobuli; Ias, intercellular air spaces; N, nucleus; oC, overlap chloroplasts; S, stomata; SMc, spongy mesophyll cells; st, starch; thy, thylakoids; V, vacuole; Vb, vascular bundle; Vbs, vascular bundle parenchyma sheath.

Leaf tissues thickness and area for low-density (LD) and high-density (HD) planting treatments

Data are expressed as mean of ten measurements of each quantified parameter per leaf (n = 3 leaves per treatment) and standard deviation. Different letters indicate significant differences calculated for Tukey P ≤ 0.05. References: AdPc/mm2, adaxial palisade cells mm2; SMc/mm2, spongy mesophyll cells mm2, AbPc/mm2, abaxial palisade cells/mm2.
Both treatments showed similar characteristics regarding the distribution and the number of strata of the mesophyll tissues, but exhibited quantitative differences. The values obtained for tissue thicknesses for LD and HD were very similar, however, the thickness of the leaf blade and the adaxial palisade parenchyma exhibited significantly higher values for LD than for HD (Tables 3 and 4). Similarly, a major leaf section, mesophyll area (M) and mesophyll area occupied by cells (Mce) were observed in LD, only ascribable to a greater development of adaxial palisade cells (Tables 2 and 3). However, this increase was not reflected in the proportion of intercellular spaces (Ias) or in the mesophyll surface area exposed to intercellular air spaces per leaf area (Sm), values that did not show significant differences between treatments (Table 4).
Mesophyll anatomical characteristics associated with resistance to gas diffusion for low-density (LD) and high-density (HD) treatments

Data are expressed as mean and standard deviation. Different letters indicate significant differences calculated for Tukey P ≤ 0.05. References: Lm, length of the mesophyll cell wall exposed to the intercellular air space; Sm, mesophyll surface area exposed to intercellular air spaces per leaf area; M, mesophyll area; Ias, intercellular airspace area; Vb, vascular bundles total area per section; Mce, mesophyll area occupied by parenchyma cells without vascular bundles with their respective parenchyma sheaths.
Ultrastructurally the chloroplasts showed starch grains and plastoglobuli in their stroma; and grana thylakoids showed a well-developed structure. The number and size of starch grains and plastoglobuli were similar in both treatments (Figs 1(c) and (d)). HD treatment showed a higher number of chloroplasts per palisade cell with respect to LD, perhaps as a compensatory mechanism for the decrease observed in the stomata densities and the size of the palisade cells (Table 5). Although the dimensions of the chloroplasts, total length of the chloroplasts touching the plasma membrane appressed to the intercellular air space (lc) and chloroplast surface exposed to intercellular airspaces per leaf area (Sc) did not present significant differences in both treatments, HD treatment showed an increasing trend in chloroplast thickness (Cthi) with higher values of cytoplasm thickness (TCyt), cell wall thickness (Tcw) and chloroplast stroma thickness (Tstr) constituting a barrier of restriction to CO2 penetration (Table 5). It was interesting to observe that in HD some chloroplasts appeared overlap and compress, on this last case resulting in the separation between the plastid membrane and the cell wall (Figs 1(e) and (f)).
Cell wall and chloroplast anatomical characteristics associated with resistance to gas diffusion for low-density (LD) and high-density (HD) planting treatments

Data are expressed as mean and standard deviation. Different letters indicate significant differences calculated for Tukey P ≤ 0.05. References: lc, total length of the chloroplasts touching the plasma membrane appressed to the intercellular air space; Sc, chloroplast surface exposed to intercellular airspaces per leaf area; Cthi, chloroplast thickness as restriction to CO2 penetration; Ca, Chloroplast area; Cnum, chloroplast number per adaxial palisade cell; Tcw, cell wall thickness; TCyt, cytoplasm thickness; Tstr, chloroplast stroma thickness.
Photosynthetic pigment content
In the current study a significant difference (P ≤ 0.05) was found in all photosynthetic (chlorophylls and carotenoids) and protective pigments, with higher contents for LD compared to HD (Table 6).
Leaf photosynthetic pigments content for low-density (LD) and high-density (HD) treatments

Data are expressed as mean and standard deviation. Different letters indicate significant differences calculated for Tukey P ≤ 0.05. References: Carot, carotenoids; Chl., chlorophyll; DW, dry weight.
Maximal photosynthetic assimilation
Under light and CO2 saturating conditions (1500 μmol/m2/s1 and 400 μmol/mol) the maximal photosynthetic rate (A max) decreased about 7.3 μmol/m2/s under HD in relation to LD, while the stomata conductance (g s) showed a decrease of 0.053 mol/m2/s. Carboxylation capacity showed a significant difference (P ≤ 0.01) with an increment of 73 mmol/m2/s at LD respective to HD while iWUE did not showed any difference (Table 7).
Physiological-photosynthetic parameters evaluated for low-density (LD) and high-density (HD) treatments under light and CO2 saturation conditions

Data are expressed as mean and standard deviation. Different letters indicate significant differences calculated for P ≤ 0.05. References: A max, maximal photosynthetic rate; g s, stomata conductance; Ci, intercellular CO2 concentration; E, transpiration rate; A max/Ci, maximum carboxylation capacity; iWUE, water use efficiency.
Effect of different plant densities on CO2 assimilation under different light intensities (An/PPFD curves)
The An/PPFD curves are shown in Fig. 2. The A max values for LD and HD were 36.6 and 28.7 μmol CO2/m2/s respectively (Table 5). The intensities at which light saturation was reached were significantly different between LD and HD. CO2 assimilation saturated at 1265 PAR/μm2/s in LD and at 1012 μmol PAR/m2/s in HD (Table 8). Light compensation point (LCP), apparent quantum yield of photosynthetic CO2 assimilation (ØCO2) and dark respiration rate (R d) did not show significant differences between LD and HD.
Net CO2 assimilation rate (An) as a function of the photosynthetic photon flux density (PPFD). (○,____) Low density; (●, ----) high density. Each point is the mean ± SD of five independent measurements. Vertical bars indicate SD.

Photosynthetic parameters calculated from photosynthetic light response curves (An/PPFD curves) evaluated for low-density (LD) and high-density (HD) treatments

Data are expressed as mean and standard deviation. Different letters indicate significant differences calculated for P ≤ 0.05. References: A max, maximal photosynthetic rate; LSP, light saturation point; LCP, light compensation point; ø CO2, apparent quantum yield of photosynthetic CO2 assimilation; Rd, dark respiration rate.
Discussion
It is well known that plant responses to different stress involve diverse mechanisms at different levels, like molecular, biochemical, physiological processes and different morphological and developmental adjustments (Munns, Reference Munns2002). Quinoa, with a large latitudinal and altitudinal distribution in the Andes mountain, has different ecotypes (from sea level to high mountains) (Tapia, Reference Tapia, Bazile, Bertero and Nieto2015) which implies a great plasticity undoubtedly related to their genetic constitution (Fuentes et al., Reference Fuentes, Bazile, Bhargava and Martinez2012; Jarvis et al., Reference Jarvis, Ho, Lightfoot, Schmöckel, Li, Borm, Ohyanagi, Mineta, Michell, Saber, Kharbatia, Rupper, Sharp, Dally, Boughton, Woo, Gao, Schijlen, Guo, Momin, Negrão, Al-Babili, Gehring, Roessner, Jung, Murphy, Arold, Gojobori, van der Linden, van Loo, Jellen, Maughan and Tester2017).
A complex topic to address for this and many other cultivated species is the effect of plant densities on yield. Generally, most studies are focused on the plant density effect on yield components (i.e. achene number and size), but understanding physiological, morphological and anatomical responses to increased plant density are needed for taking agronomical management decisions and for enhancing resources use efficiencies.
In this experiment, we demonstrated that under the same growing conditions (insolation regime, soil type, watering regime and agronomical management) and without visual effects of water or nutrients stress, the increase of light competition mediated by a higher plant density triggered responses at morphological, anatomical and physiological levels. Although these changes allowed the quinoa crop to cope with the enormous light stress imposed by the high density of plants, a penalty in yield was registered.
Regarding SLA, it is a very sensible parameter to evaluate responses to stress conditions or different treatments (Lambers et al., Reference Lambers, Chapin and Pons1998) and it has a strong relation with leaf thickness, leaf nitrogen content and photosynthetic assimilation (Evans, Reference Evans1989; Garnier et al., Reference Garnier, Cordonnier, Guillerm and Sonié1997; Evans and Poorter, Reference Evans and Poorter2001; Croft et al., Reference Croft, Chen, Luo, Bartlett, Chen and Staebler2017). In our study, the cost in carbon to achieve 1 cm2 of leaf (specific leaf mass = 1/SLA) was 6.42 and 5.27 mg D.W./m2 for LD and HD, respectively. This significant difference shows that under HD quinoa leaves presented a lower carbon investment and it was highly correlated with the leaves thickness. Under HD, the leaves thickness was sensibly less than under LD. The increase of leaves thickness under LD was attributed to the formation of longer palisade cells in the mesophyll and to the development of multiple palisade parenchyma on both sides of the leaf.
In relation to leaf anatomy, there is huge evidence of the effect of sunlight on the tissue's arrangements (Karabourniotis et al., Reference Karabourniotis, Liakopoulos, Bresta and Nikolopoulos2021). In our study, the development of different SLA, stomata densities, indexes and dimensions, the differences observed at the length of the palisade cells and the chloroplast arrangement within the cells were the most evident affected parameters comparing both treatments. According to several researchers (Vogelmann and Martin, Reference Vogelmann and Martin1993; Brodersen et al., Reference Brodersen, Vogelmann, Williams and Gorton2007) these arrangements facilitate light channelling into the leaf. In relation to the total thickness of the leaf, the spongy parenchyma, with irregularly cells, was slightly increased, although not significantly, under HD treatments, probably as an adaptation of the leaves to form a large intercellular air spaces to enhance gas and light absorption due to multiple light scattering (Evans and Vogelmann, Reference Evans and Vogelmann2003). According to Vogelmann (Reference Vogelmann1989) and DeLucía et al. (Reference DeLucía, Nelson, Vogelmann and Smith1996) the spongy mesophyll is an adaptation to enhance leaf absorptance in shade leaves by the increasing of the internal light scattering which improves the probability of absorption for photosynthesis. Therefore, a greater proportion of spongy mesophyll under HD may be a response to the light stress in an attempt to cope with it, trying to maintain its photosynthetic assimilation. However, photosynthetic rate was about 7.3 μmol/m2/s lower in HD compared to LD, showing a lack of adaptation to the HD studied.
Other important elements in the gas exchange process are the stomata densities (SD) and indexes (SI). Stomata play a crucial role in the CO2 capture and transpiration. Our analysis showed that total SD (lower + upper epidermis) was higher in LD compared to HD. Notwithstanding as a compensation strategy, the stomata size was greater in HD. Also, the SD has a deep relationship with plant water status. In fact, according to our data the decrease in SD in plants growing under HD compared to LD, contributed to a decrease of 0.053 mol/m2/s in g s and 1.65 mmol/m2/s in E. This reduction in transpiration and stomata conductance contributed to the lower yield obtained in HD.
In quinoa leaves or cotyledons the presence of calcium or carbonate oxalate is common (Prado et al., Reference Prado, Hilal, Albornoz, Gallardo and Ruiz2017) and usually calcium is accumulated in crystalliferous idioblast. These ergastic components together with silicon have been proposed as elements for improving light scattering within the mesophyll (Bauer et al., Reference Bauer, Elbaum and Weiss2011; He et al., Reference He, Veneklaas, Kuo and Lambers2014). Although we detected the presence of idioblasts, no significant differences were found among treatments. Thus, in this case the presence of crystalliferous idioblasts with carbon oxalate druses did not play a role in light scattering, probably displaying another function like providing protection against photo-inhibition or moderating internal leaf temperature (Horner et al., Reference Horner, Wanke, Oelschlägel and Samain2017). It is worth noting that in the extreme environment where the experiment was carried out, moderating internal leaf temperature is a very important issue due to high temperatures and radiation that are registered during the day (González et al., Reference González, Bruno, Valoy and Prado2011).
Chloroplasts are very important organelles in plants because they are the sites where photosynthesis is performed. Chloroplast morphology can adapt to different environments and light conditions affecting their structures, ultrastructure and function in the photosynthesis process (Franklin and Whitelam, Reference Franklin and Whitelam2004). It is well known that chloroplasts are more susceptible to damage by different abiotic stresses (Molas, Reference Molas2002). Some stresses like saline can destroy the chloroplast organization even in quinoa (Bose et al., Reference Bose, Munns, Shabala, Gilliham, Pogson and Tyerman2017; Manaa et al., Reference Manaa, Goussi, Derbali, Cantamessa, Abdelly and Barbato2019). In relation to light competition effect, our results demonstrated that chloroplast has maintained the structural organization with some little changes that allowed plant to conserve the function. In general, the ultrastructure of the chloroplasts under LD and HD showed a fully developed grana with many layers, starch and some plastoglobuli. The higher number of chloroplasts per palisade cell observed at HD treatment in relation to LD may be interpreted as an attempt to compensate the decrease observed in the size of these cells. HD treatment showed increasing trend in the cell wall, cytoplasm, chloroplast and chloroplast stroma thickness, constituting restriction barriers to CO2 penetration.
In the present study the differences of total chlorophylls, carotenoids and protective pigments under LD and HD may be explained by the different levels of radiation that leaves were exposed and the lesser thickness of the mesophyll observed in HD. Plants under HD treatment reduced its chlorophyll content about 11% compared to LD. This may be an indicator of stress linked to competence by different resources. The Chl.a/Chl.b ratio reflected the higher light exposition of leaves under LD than in HD. In addition, the ratio of chlorophyll a to b in land plants has been used widely as an indicator of response to shade and as an early indicator of senescence.
In the case of carotenoids, these pigments play an important role in light harvesting complexes and in photo-protection of the photosystems (Hendry and Price, Reference Hendry, Price, Hendry and Grime1993). In CICA-17 under HD carotenoids increased about 0.13 mg/gDW as compared to LD, probably as a strategy for light harvesting complex under the shadow caused by other plants and leaves. Similarly, an increase was observed in the total chlorophyll/carotenoids ratio. The differences in solar radiation that leaves from LD and HD received were reflected in the absorbance at 305 nm (protective pigments) where the value under LD was 0.11Abs.305/g DW higher than in HD. As observed in the present work, leaves developed under shade have higher numbers of thylakoid stacks in the chloroplast but lower chlorophyll contents and net photosynthesis rates than leaves developed under normal light conditions (Marchiori et al., Reference Marchiori, Machado and Ribeiro2014).
The gas exchange measurements showed that A max was affected by plant densities where the highest A max was detected in LD treatment. A max in quinoa can vary according to different genotypes and agronomical managements among another parameters (González et al., Reference González, Bruno, Valoy and Prado2011). The A max value obtained under light and CO2 saturation conditions were in the range of those previously informed for CICA-17 growing in the same field where this study was performed. González et al. (Reference González, Bruno, Valoy and Prado2011) reported a value of 31 μmol/m2/s while in our study we found values of 34.3 and 27.0 μmol/m2/s for LD and HD respectively. The A max decrease in our study had a strong relationship with leaves nitrogen and total chlorophyll content. It is known that there exists a strong and positive correlation between leaves nitrogen and photosynthesis considering that nitrogen has an important role in the Calvin cycle enzymes (Evans, Reference Evans1989). Ribulose-1,5-biphosphate carboxylase/oxigenase represents nearly 50% of all the total leaf protein (Lambers et al., Reference Lambers, Chapin and Pons1998).
From the light response curve (An/PPFD) we can establish that LSP was different in LD compared to HD. This fact could be directly related to the different degree of leaves insolation as happens in sun or shades leaves. In relation to the LCP, R d and quantum yield of photosynthetic CO2 assimilation (ØCO2), no significant differences were detected, which is to be expected since these are species-specific variables (Valladares et al., Reference Valladares, Allen and Pearcy1997).
The most evident characters modified by light allocation caused by plant densities were plant height, stem diameter; leaf specific area, thickness, chloroplast ultrastructure; nitrogen, phosphorous and pigments (photosynthetic and protective) content.
Data obtained in this work allow to affirm that although quinoa crop showed morphological and anatomical changes in an attempt to reduce the light competition generated by high-density treatment, these changes did not fully compensate gas exchange, limiting C absorption and therefore limiting uptake of N and P, resulting in a lower yield of HD compared to LD. Considering the ability of quinoa plants to change its morphology and anatomy, further studies with intermediate plant densities are needed in order to determine if it is possible to achieve higher yields than those obtained with the low density studied here.
In order to get a wider knowledge about how light allocation and plant density may affect quinoa production, it is necessary to investigate different quinoa ecotypes at different plant densities under different sunlight conditions to stablish the best density for each ecotype and for each place where quinoa may be an important complementary crop.
Conclusion
Plant density treatment affected quinoa yield by altering photosynthesis physiology, pigments accumulation, plant morphology and leaf anatomy and ultrastructure. Different achene yield under LD and HD was a direct consequence of differences in photosynthetic assimilation and morpho-anatomical modifications caused by light competition induced by plants and leaves shading. This work constitutes a first approximation to understand the phenotypic plasticity of quinoa against different light competition levels caused by contrasting plant densities.
Acknowledgements
To the technicians of the Campo Experimental de Encalilla – INTA – Amaicha del Valle who helped in field crop work.
Author contributions
JAG, MIM, LEE, LMC, SEB and GIP conceived of the presented idea and planned the experiments. SEB, LMC, DAG and LEE carried out and analysed the data of the field experiments. JAG, SEB and DAG carried out the physiological parameters measurements. MIM and GIP carried out the morpho-anatomical evaluations. All authors supervise the project, discussed the results and contributed to the final manuscript.
Financial support
This work was supported by Miguel Lillo Foundation (‘Ecophysiology of selected Chenopodium quinoa varieties and other species of nutritional value in field and lab’) (Project B-0004-1) and National Institute of Agricultural Technology (INTA) under the project ‘Aplicación de tecnología para producción de quínoa para alimentación y generación de un mercado de semillas en la Comunidad Indígena de Amaicha del Valle (Tucumán)’. Consejo Federal de Ciencia y Tecnología (COFECYT). Ministerio de Ciencia, Tecnología e Innovación Productiva (MINCYT). RESOL-2018-680-APN-MCT.
Conflict of interest
None.
Ethical standards
Not applicable.