Introduction
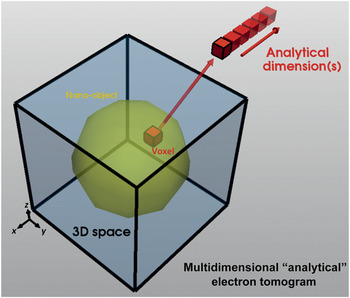
Over the past 15 years or so, electron tomography using the (scanning) transmission electron microscope ((S)TEM) has become a technique used routinely to determine the three-dimensional (3D) nanoscale morphology of a variety of materials.Reference Leary, Midgley and Thomas1–Reference Ersen, Florea, Hirlimann and Pham-Huu4 As described elsewhere in this issue of MRS Bulletin, a tilt series of images are acquired that, if considered as a series of projections, can be “back-projected” to reconstruct the 3D object of interest. STEM high-angle annular dark-field (HAADF) imaging, which has become the de facto standard for electron tomography of strongly scattering crystalline specimens in the physical sciences, provides some compositional contrast through the atomic-number dependence of the high-angle scattered electrons, but often a more direct determination of composition is needed through electron energy-loss spectroscopy (EELS) or energy-dispersive x-ray spectroscopy (EDXS). Combining spectroscopy and tomography has proven to be a valuable method to determine not just 3D composition, but also chemistry (e.g., local valency), electronic properties, and optical properties. More recently, the ability to undertake 3D nanocrystallography has added to the ensemble of 3D nanoscale imaging techniques now available that, together, called analytical electron tomography (AET) (see Figure 1).
Principle of analytical electron tomography, in which each voxel (“volume element”) in 3D space contains additional signal dimensionality. This could be a specific energy from spectroscopy, or the full spectrum, or reciprocal-space information. Upon interrogation, these signals may be used for spatial discrimination of specific elements, phases, or other properties such as plasmonics.

Other advanced techniques available in electron microscopy can be coupled to tomography, electron holography in particular.Reference Wolf, Lubk, Röder and Lichte5 The number of different imaging modes used in electron tomography has seen fivefold growth in the last 15 years. While some of these could also be considered under the umbrella of AET, this review focuses on the aforementioned due to (1) EELS, EDXS, and diffraction being the most widespread techniques in analytical electron microscopy in general; (2) EELS and EDXS being the most widely implemented forms of AET to date; and (3) crystallographic tomography being an area in which we anticipate notable future development.
EFTEM and STEM-EELS tomography
An electron spectrometer, placed either in-column or post-column, enables the electron beam, having traversed through the sample, to be dispersed in energy, forming an energy-loss spectrum. This spectrum can be collected pixel by pixel over a region of interest, a technique known as STEM-EELS spectrum-imaging (described in detail later), or by using energy-filtered TEM (EFTEM), where an energy window may be placed over a characteristic energy-loss feature, and an image is formed using only those electrons that lie within that energy window.
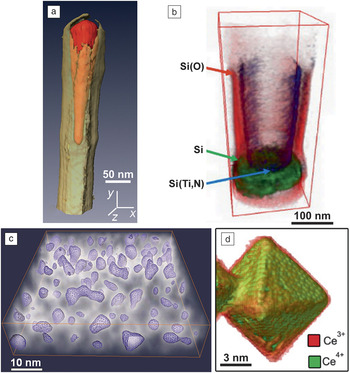
For EFTEM using core-loss ionization edges (whose onset is determined by the characteristic energy required to promote an inner-shell electron of a particular type of atom), the background signal under the edge can be estimated from additional EFTEM images (normally two, recorded before the loss) and then subtracted from the core-loss EFTEM image to yield an elemental map. By acquiring a tilt series of such elemental maps, and using those as input for tomographic reconstruction, a 3D element-sensitive tomogram can be reconstructed. In Figure 2a, for example, a 3D iron elemental map clearly shows an iron-based catalyst nanoparticle at the top of a multiwall carbon nanotube (CNT). Knowing the 3D morphology of each chemical constituent in the iron-filled CNTs is one of the key factors for understanding the growth mechanism and potential applications.Reference Jin-Phillipp, Koch and van Aken6
(a) Energy-filtered transmission electron microscopy (EFTEM) tomography elemental mapping of an iron-filled multiwalled carbon nanotube; red = iron, yellow = carbon. Reprinted with permission from Reference Reference Jin-Phillipp, Koch and van Aken6. © 2011 Elsevier. (b) Scanning transmission electron microscopy-electron energy-loss spectroscopy (STEM-EELS) tomography chemical state mapping of silicon in a W-to-Si contact from a semiconductor device. Reprinted with permission from Reference Reference Jarausch, Thomas, Leonard, Twesten and Booth9. © 2009 Elsevier. (c) EFTEM tomography plasmon mapping, revealing the morphology of nonspherical silicon nanoparticles embedded in silicon oxide. Reprinted with permission from Reference Reference Yurtsever, Weyland and Muller10. © 2006 AIP Publishing. (d) STEM-EELS tomography valence state mapping of a ceria nanoparticle. Reprinted with permission from Reference Reference Goris, Turner, Bals and Van Tendeloo11. © 2014 American Chemical Society.

While EFTEM maps and the associated tilt series are relatively straightforward to acquire (EFTEM-based AET was first demonstrated more than 15 years ago),Reference Möbus and Inkson7,Reference Weyland and Midgley8 the spectral information contained within the EFTEM series is limited—energy windows are often ca. 20 eV in size, and subtle spectroscopic information (e.g., edge fine structure) may be lost. This limited spectral information has led to an increasing adoption of STEM-EELS spectrum imaging, in which the complete energy-loss spectrum is acquired at every pixel. By recording a tilt series of such spectrum images, 3D tomograms may be reconstructed from any energy-loss channel recorded in the spectrum. Using core-loss ionization edges, the elemental signal can be extracted from each spectrum, pixel by pixel, and elemental maps at each tilt can then be used as inputs into tomographic reconstruction. If, instead, every channel in the EELS spectrum is reconstructed tomographically, it is possible to obtain “voxel spectra,” which can be analyzed subsequently.
The fine structure seen at core-loss ionization edges may encode information on the electronic and bonding properties of the sample. Jarausch et al. mapped the bonding states of silicon in a semiconductor device in 3D (shown in Figure 2b) by fitting model ionization edges to experimental spectra; the silicon is identified either in its elemental form or as an oxide or as part of a metal silicide or silicon nitride.Reference Jarausch, Thomas, Leonard, Twesten and Booth9
Electronic information is also encoded in the low-loss region of the EELS spectrum. The bulk, or volume, plasmon energy depends on the local electron density, and plasmon EFTEM images, utilizing narrow energy windows ca. 1–2 eV in width, may be used as input for tomographic reconstructions. Figure 2c shows an early example in which islands of silicon can be distinguished from the silicon oxide matrix by the shift in the plasmon energy.Reference Yurtsever, Weyland and Muller10
In favorable cases, it may be possible to directly map the valency of certain elements. Materials with empty 3d and 4f shells are amenable to this because of a pronounced and intense EELS fine structure that can be used as a fingerprint to determine the valency. The example in Figure 2d shows a ceria nanoparticle in which the particle surface is shown to be predominantly Ce3+ in character and the core Ce4+.Reference Goris, Turner, Bals and Van Tendeloo11
In the EFTEM and STEM-EELS cases previously cited, the energy-loss signal increases with the projected sample thickness and is thus suitable for reconstruction. However, once the sample thickness extends beyond some characteristic inelastic mean free path (typically 100 nm or so),Reference Egerton12 the elemental signal may actually fall, as the influence of plural (multiple inelastic) scattering becomes significant. This creates a problem for reconstruction. Most tomography reconstruction relies still on a back-projection approach in which the image signal used is in some sense a “projection” and is assumed to vary monotonically with some physical quantity (e.g., thickness). For thick specimens, the core-loss signal no longer satisfies the projection requirement. Methods to remove the effects of plural scattering are available, but their implementation in STEM-EELS and EFTEM tomography are limited to date, due to the complex nature of the process and the changes in the projected thickness as a function of tilt. With the introduction of so-called “dual EELS” technology, in which the low-loss and core-loss spectra are acquired “simultaneously,”Reference Scott, Thomas, MacKenzie, McFadzean, Wilbrink, Craven and Nicholson13 this plural scattering correction may become more reliable and used routinely.
EDXS tomography
In many ways, STEM-EDXS provides a much simpler method to form a compositional map. The characteristic EDXS peaks lie on a relatively low background, and there are little of the plural scattering problems that plague EELS of thick specimens. Until recently, the major problem has primarily been the detector geometry. Most conventional EDXS detectors used in STEM subtended solid angles of 0.1–0.3 steradians (sr) and were positioned on one side of the electron microscope column. Thus, if the sample was tilted away from the detector, the signal would fall to zero as the specimen holder casts a “shadow” on the detector. Nevertheless, some early heroic attemptsReference Möbus, Doole and Inkson14,Reference Saghi, Xu, Peng, Inkson and Mobus15 were made to use EDXS detectors with this asymmetric geometry to determine 3D composition from a limited tilt series of EDXS data.
Over the past few years, however, there has been something of a revolution in EDXS detector design. Modern silicon drift detectors, with much higher solid angles of acceptance (ca. 0.9 sr) and with faster processing capabilities (100 k counts s–1) are now widely available for (S)TEM. These can be arranged with multiple detector chips positioned symmetrically about the optic axis, such that there are always chips “facing” the sample no matter the tilt direction. This has led to a renaissance in EDXS tomography.
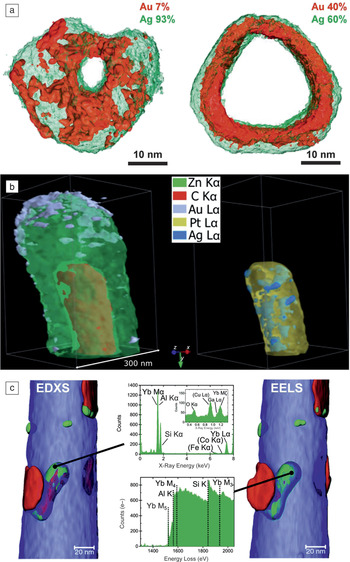
Figure 3a shows a recent example of a nanoring structure composed of Au and Ag.Reference Slater, Macedo, Schroeder, Burke, O’Brien, Camargo and Haigh16 Here, the two elements were mapped with nanometer resolution to determine their distribution from different starting alloys and how the two immiscible materials separated over time. Figure 3b shows another, more complex nanostructure, in which a ZnO shell covers a metal/carbon-rich inner core.Reference Burdet, Saghi, Filippin, Borrás and Midgley17 The complex arrangement of metallic features is revealed by the 3D elemental reconstruction. In this case, quantification of the composition was improved through absorption correction. Absorption of low-energy x-rays is a significant problem in any EDXS analysis and especially so for 3D EDXS, as the structures examined are likely to be thicker than would be the case for a thin-film characterization. A number of methods have been explored in the past, improving upon the standard Cliff–Lorimer “thin-film” ratio approach, including the zeta factor method,Reference Watanabe and Williams18 which accounts for specimen thickness and can provide absolute concentrations. Here, the absorption was corrected in an iterative fashion using tabulated mass-absorption coefficients, applying the correction voxel by voxel until a consistent set of composition values were obtained.
(a) 3D elemental maps of (left) Ag-rich and (right) more Au-rich bimetallic nanorings, showing irregular Au surface segregation compared to uniform Ag surface segregation, respectively; obtained from scanning transmission electron microscopy-energy-dispersive x-ray spectroscopy (STEM-EDXS) tomography. Reprinted with permission from Reference Reference Slater, Macedo, Schroeder, Burke, O’Brien, Camargo and Haigh16. © 2014 American Chemical Society. (b) STEM-EDXS tomography reconstruction revealing 3D elemental distributions in an organic/inorganic core/multishell nanowire.Reference Burdet, Saghi, Filippin, Borrás and Midgley17 (c) 3D elemental maps of ytterbium (green), silicon (red), and aluminum (blue) from an Al-5wt% Si alloy (6100 ppm Yb), obtained from simultaneous (right) electron energy-loss spectroscopy (STEM-EELS) and (left) STEM-EDXS tomography. Local spectra are shown from the Yb-rich precipitates. Reprinted with permission from Reference Reference Haberfehlner, Orthacker, Albu, Li and Kothleitner19. © 2014 Royal Society of Chemistry.

In modern instruments, it is possible to collect the EDXS and EELS signals simultaneously. Figure 3c exemplifies such combined data collected from a needle-shaped sample of an Al-Si alloy (Al-5wt% Si with 50 ppm Na and 6100 ppm Yb), showing the distribution of the metallic constituents.Reference Haberfehlner, Orthacker, Albu, Li and Kothleitner19 The great advantage of simultaneous acquisition is that the EELS signal is especially sensitive to light elements, and the EDXS is sensitive to heavier elements, so the combination can provide a more complete 3D chemical picture.
Crystallographic electron tomography
Electron diffraction may also be regarded as a form of analytical electron microscopy. Through improvements in goniometer design, improvements in microscope control and detectors, and increased computational speed for analysis, this form of analytical microscopy has also had a renaissance in recent years and is now being extended to AET.
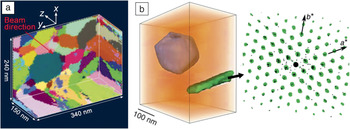
In one variant of “diffraction tomography,” fixed-beam diffraction patterns are recorded as a function of specimen tilt, yielding a greatly increased reciprocal-space data set that can be used for 3D structure solution and crystal analysis.Reference Kolb, Mugnaioli and Gorelik20 Alternatively, by recording a tilt series of crystallographically sensitive images, a full 3D picture of the local crystallography may be obtained. The first example of this using a TEM provided a 3D reconstruction of the grains of a polycrystalline Al specimen, shown in Figure 4a.Reference Liu, Schmidt, Poulsen, Godfrey, Liu, Sharon and Huang21 To achieve the reconstruction, ca. 100 k dark-field images were recorded using a method analogous to one that has been successful in x-ray diffraction contrast tomography, varying sample tilt and the scattering angle for each dark-field image.
(a) 3D grain-orientation map of a polycrystalline aluminum specimen (colors represent different crystal orientations), obtained from a hollow cone dark-field imaging approach to crystallographic tomography. Reprinted with permission from Reference Reference Liu, Schmidt, Poulsen, Godfrey, Liu, Sharon and Huang21. © 2011 AAAS. (b) 3D crystallographic reconstruction of a Ni-based superalloy from scanning precession electron diffraction tomography showing the faceted metal carbide (blue), the η-phase (green), and the surrounding matrix (orange). At each point in real space (left), reciprocal-space information is available, as shown (right) for the lath-like η-phase. The colored overlay of spots is the auto-correlation of the zero-order Laue zone reflections extracted from the 3D reciprocal-space reconstruction, with reciprocal lattice basis vectors marked.Reference Eggeman, Krakow and Midgley22

A somewhat different method involves coupling transmission electron diffraction with scanning. Here, 2D maps of local crystallographic information can be obtained that are akin to those achieved with the widely adopted scanned electron backscatter diffraction technique. Acquisition involves recording a diffraction pattern at every pixel in a 2D scan, yielding a 4D data set, and the approach can be extended to tomography by repeating this process at different tilts.Reference Eggeman, Krakow and Midgley22 Such tilt series data can be extremely information-rich, allowing for versatile 3D crystallographic analysis. The diffraction patterns can be analyzed computationally post facto, and “virtual” dark-field or “component” images may be formed (the latter using multivariate statistical analysis (MSA) methods), which then can be used to reconstruct, in 3D, both real and reciprocal spaces, as illustrated in Figure 4b. Moreover, by interrogating subvolumes to retrieve local 3D crystallography, it is possible to determine, for example, the orientation relationships between grains or phases and across interfaces.
Advanced AET
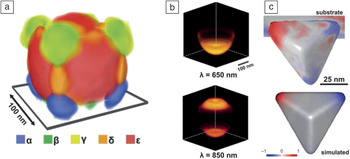
The “multidimensional” nature of AET tends to lead to large data sets; it is typical to record ca. 100 k spectra or diffraction patterns in one data set. As such, there is a need to optimize data analysis and to use data-reduction techniques in order to extract the salient information about the sample. MSA methods lend themselves to such “big data” challenges and have proven to be successful for AET. Figure 5a shows a composite reconstruction of five surface plasmon modes determined by STEM- EELS tomography.Reference Nicoletti, de la Pena, Leary, Holland, Ducati and Midgley23 In order to achieve such a reconstruction, the data were analyzed using nonnegative matrix factorization, a form of MSA, such that each of the ca. 100 k raw spectra could be described using a linear combination of just five surface plasmon spectral components. Reducing the spectral information to a series of key component spectra allows a much more interpretable evaluation of the enormous data sets. Closely related from a materials perspective, but differing in methodology, a complementary AET technique, cathodoluminescence tomography, was recently used to generate 3D surface plasmon maps from Au nanocrescents (see Figure 5b).Reference Atre, Brenny, Coenen, García-Etxarri, Polman and Dionne24
(a) 3D rendering of surface plasmon modes of a silver nanocube, reconstructed using scanning transmission electron microscopy-electron energy-loss spectroscopy (STEM-EELS) tomography.Reference Nicoletti, de la Pena, Leary, Holland, Ducati and Midgley23 (b) Cathodoluminescence spectroscopic tomography maps of a gold-polystyrene nanocresent, revealing spatial and wavelength (λ) dependent efficiency of the cathodoluminescence from material luminescence and radiative decay of plasmonic modes. Reprinted with permission from Reference Reference Atre, Brenny, Coenen, García-Etxarri, Polman and Dionne24. © 2015 Macmillan Publishers. (c) Simulated plasmonic eigenmode (bottom) and corresponding STEM-EELS tomographic surface charge reconstruction (top) of a silver right bipyramid on a MoO3 dielectric substrate.Reference Collins, Ringe, Duchamp, Saghi, Dunin-Borkowski and Midgley25

Although AET data sets are large, they are still incomplete from a tomographic perspective, and the reconstructions will suffer artifacts. The electron dose and acquisition time required for analytical TEM is typically much larger than in standard imaging, which restricts the number of images that can be acquired in an AET tilt series—and hence the angular sampling from a tomographic reconstruction perspective. This has led to AET being primarily used to investigate materials that can withstand large electron doses without damage, but this situation may be improved if advanced reconstruction procedures are employed.Reference Nicoletti, de la Pena, Leary, Holland, Ducati and Midgley23,Reference Collins, Ringe, Duchamp, Saghi, Dunin-Borkowski and Midgley25,Reference Saghi, Benning, Leary, Macias-Montero, Borras and Midgley26
In particular, novel reconstruction algorithms are under development that move away from the simple back-projection approach to ones in which a model reconstruction is refined via a best-fit procedure using both the data and additional constraints based on prior knowledge about the object being reconstructed. The prior knowledge may be physical, for example, imposing physical laws or zero background values, or it may be image-related, such as knowledge of the likely gray-scale “texture.” Such prior knowledge is extremely valuable in improving the fidelity of the tomogram and reducing the number of images required for a successful reconstruction, especially when implemented within the framework of “compressed sensing” methods using sparsity constraints.Reference Leary, Saghi, Midgley and Holland27 It is also possible to incorporate more complex beam-sample interactions into forward model-fitting calculations, an example of which is shown in Figure 5c.Reference Collins, Ringe, Duchamp, Saghi, Dunin-Borkowski and Midgley25 As in the case of Figure 5a, a series of low-loss EELS spectrum images were recorded, and MSA methods were used to determine surface plasmon modes. However, the model-fitting approach, matching simulated and experimental EEL spectra, was necessary for refinement of the underlying charge density of the individual eigenmodes. This type of approach opens the way to determine many other physical properties in 3D that are not simple projections and thus are not directly reconstructable using standard back-projection methods.
Conclusions
AET has led to new insights into the 3D structure, composition, and physicochemical nature of materials. The development of novel AET techniques has gained considerable momentum in recent years. It is now possible to acquire vast “multidimensional” spectrum-imaging and diffraction-imaging data sets that require analysis in an efficient and robust fashion. Machine-learning and related techniques offer powerful ways to achieve this, and coupled with novel tomographic acquisition and reconstruction approaches, provide 3D nanoscale information not available with any other technique.
Acknowledgments
The research leading to these results was possible through funding from the European Union Seventh Framework Program under Grant Agreement 312483-ESTEEM2 (Integrated Infrastructure Initiative–I3), as well as from the European Research Council under the European Union’s Seventh Framework Program (FP/2007–2013)/ERC Grant Agreement 291522–3DIMAGE. R.K.L. acknowledges a junior research fellowship at Clare College.