I. INTRODUCTION
Ferroelectrics materials have been used in the development of many electronic devices such as sensors, actuators, microelectromechanical system (MEMS) and nonvolatile ferroelectric random access memories (NvFRAMs) and energy-harvesting devices.Reference Scott and Paz de Araujo1–Reference Choi, Jeon, Jeong, Sood and Kim3 Pb(Zr1-xTix)O3 have been studied extensively due to their superior properties.Reference Vrejoiu, Rhun, Pintilie, Hesse, Alexe and Gosele4 For these application devices, spontaneous polarization (P s) is one of the key intrinsic properties because it is directly related to the magnitude of ferroelectric and piezoelectric properties. Thus, it is important to probe P s of ferroelectric materials using a noncontact method during production process of MEMS or NvRAMs to check process quality and device reliability.
In tetragonal Pb(Zr, Ti)O3, Ps can be estimated from the tetragonal distortion of the unit cell, (c/a) -1, because [(c/a) -1] is proportional to the square of P s, P s2.Reference Amin, Haun, Badger, McKinstry and Cross5 In addition, the square of A 1(1TO) soft mode frequency, ω 2 [A 1(1TO)], is expected to be almost proportional to Ps2.Reference Kojima, Imaizumi, Hamazaki and Takashige6
The relationship between Ps and ω[A 1(1TO)] is very useful from a practical viewpoint such as checking MEMS characteristics during production because the Ps value can be estimated using simple Raman spectroscopy. However, literature is still lacking in some fundamental experimental data on Pb(Zr, Ti)O3, such as the equation that correlated between Ps and Raman spectra data.
Because, as far as we know, there are no reports on the measurements of both the Ps and Raman spectra (against the above parameters) using same Pb(Zr, Ti)O3 samples having a single polar-axis orientation. In the previous reports, we reported on the equations between Ps2 – [(c/a) -1] and Ps2 –ω 2[A 1(1TO)].Reference Ehara, Utsugi, Nakajima, Yamada, Iijima, Taniguchi, Itho and Funakubo7
In the present study, we characterized polar-axis oriented tetragonal PZT thin films using polarized and unpolarized Raman spectroscopy, as function of Zr/(Zr + Ti) ratio and measurement temperature. The use of polarized and unpolarized Raman spectroscopy aims to get well-isolated phonon modes. We correlated these data with polarization-electric field (P-E) hysteresis loops of same samples to establish an experimental relationship between Raman spectrum and Ps in the same samples, and thus, probe Ps without contact.
II. EXPERIMENTAL
Tetragonal polar axis-oriented Pb(Zr, Ti)O3 thin films with thicknesses range of 1–2 μm were grown on (100)cSrRuO3//(100)LaNiO3//(100)CaF2 substrates by pulsed metal-organic chemical vapor deposition.Reference Fujisawa, Nakaki, Ikariyama, Yamada, Ishikawa, Morioka and Funakubo8 This film thickness range is suitable for the measurement of the Raman spectroscopy analysis because of the good signal/noise ratio. In addition, this is the thickness range for the real MEMS device.
Crystal structure including tetragonal distortion, c/a-1, was characterized using the high-resolution x-ray diffraction (XRD) analysis system equipped with a four-axis diffractometer (Philips X′ Pert-MRD, Almelo, Netherlands). Detailed crystal structure results were already reported elsewhere.Reference Fujisawa, Nakaki, Ikariyama, Yamada, Ishikawa, Morioka and Funakubo8
An Ar+ laser (514.5 nm) was used for the present Raman experiments with a power of 50 mW on sample. The incident laser was focused on the fractured cross-section of the film by an objective lens (N.A. 0.70), where a spot diameter was ∼1 μm. The scattering light was collected by a backscattering geometry and analyzed by a triple spectrometer (Photon deign PDPT 640F, Jobin-Yvon HR 640, Tokyo, Japan) with a subtractive dispersion mode. The spectra were finally observed by a Peltier-cooled charge couple device detector and the detailed Raman measurements were already reported elsewhere.Reference Nakajima, Fujisawa, Nishida, Yamamoto, Osada, Naganuma, Okamura and Funakubo9 The high temperature chamber (TS1500 System, Linkam Scientific Instruments, Guildford, UK) was used to measure temperature dependency of Raman spectrum with 10 °C/min heating rate.
Ferroelectric properties were measured using a ferroelectric tester (Toyo Corp. FCE-1, Tokyo, Japan) after deposition of 100-μm in diameter Pt top electrodes using electron-beam evaporation.
III. RESULTS AND DISCUSSION
A. Raman spectrum analysis
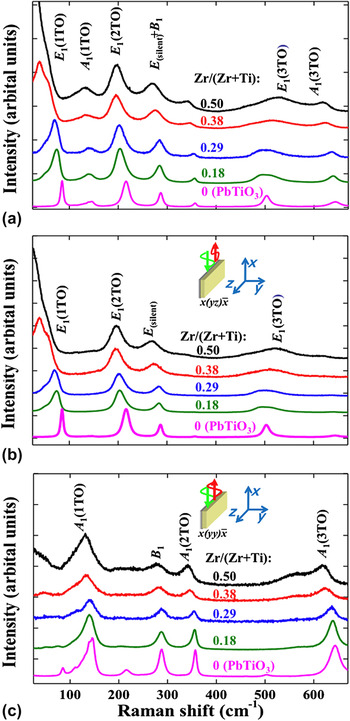
Figure 1 shows Raman spectra measured at room temperature for polar axis - oriented Pb(Zr, Ti)O3 films. Tetragonal Pb(Zr, Ti)O3 is known to belong to 4 mm (C4ν) space group, which yields to (3A 1 + 4E + B 1) phonon modes.Reference Burns and Scott10 In addition, Raman spectra are expected to be formed only by E- mode and (A 1 + B 1) modes in the cross-polarized  and parallel-polarized
 configurations, respectively.
(a) Unpolarized, (b) crossed polarized  and (c) parallel-polarized
 Raman spectrum for perfectly polar axis–oriented PZT films with the Zr/(Zr+ Ti) ratio ranging from 0 (PbTiO3) to 0.50.

Figure 1(a) presents the unpolarized Raman spectra, in which the peaks were assigned based on details given in the literature by Burns et al.Reference Burns and Scott10 for single crystal of PbTiO3. All unpolarized Raman spectra showed the expected peaks originated from (3A 1 + 4E + B 1) modes irrespective of the Zr/(Zr + Ti) ratio. Cross-polarized spectra  presented in Fig. 1(b) showed that E(TO) modes peaks were clearly separated from A 1(TO) and B 1 modes. On the other hand, the parallel-polarized spectra
 presented in Fig. 1(c) showed only A 1(TO) and B 1 mode peaks. As E(TO), A 1(TO) and B 1 phonon modes respective response, to vibrations perpendicularly and in parallel to the polar-axis of tetragonal unit cell, their presence in Raman spectra indicates that films are perfectly polar axis-oriented perpendicularly to substrate surface. This result is consistent with XRD result.Reference Fujisawa, Nakaki, Ikariyama, Yamada, Ishikawa, Morioka and Funakubo8
We noticed that all peaks in Fig. 1 became gradually broad with increasing Zr/(Zr + Ti) ratio. This tendency was well observed especially for E(3TO) mode. Such broadening might be ascribed to the random distribution of Ti and Zr cations in B-site in perovskite structure as pointed by Lee et al.Reference Lee, Jang, Sung and Yi11 It must be also pointed out that peak position of E(1TO) mode was in continuous decrease with Zr/(Zr + Ti) ratio. However, those of the films with x = 0.38 and 0.50 are significantly lower than that of films with x = 0, 0.18 and 0.29. Detailed analysis of this behavior is under investigation.
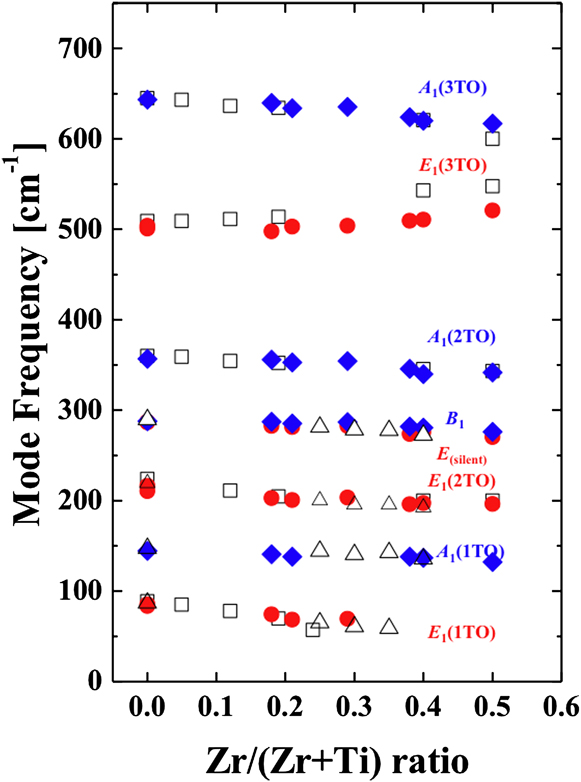
Figure 2 shows the evolution of A 1(TO), B 1 and E(TO) phonon mode frequencies as a function of Zr/(Zr + Ti) ratio measured at room temperature based on results shown on Fig. 1. Clearly separated peaks are obtained by the polarized measurement. It allows us to realize the accurate definition of peak frequency. The frequency of E(TO) modes were defined by the usual damped harmonic oscillator function from crossed-polarization configuration spectrum  shown on Fig. 1(b), while the frequency of A 1(TO) and B1 modes were extracted from parallel-polarization spectrum
 shown in Fig. 1(c). The frequencies of all peaks presented in Fig. 2, decrease monotonically with increasing Zr/(Zr + Ti) ratio, except for E(3TO) mode. Powder data reported by Burns et al.Reference Burns and Scott12 and Ikeuchi et al.Reference Ikeuchi, Kojima and Yamamoto13 with the Zr/(Zr + Ti) ratio ranging from 0 to 0.52 (squares) and 0.25 to 0.40 (triangles), respectively, have also been plotted in Fig. 2 for reference. The present results are in good agreement with reference powder data. This result emphasizes the negligible effect of residual strain on Raman mode frequency.
To phonon mode frequency measured at room temperature as a function of the Zr/(Zr + Ti) ratio estimated from the data shown in Fig. 1. (diamonds): Data obtained from parallel configuration,  . (circles): Data obtained from crossed configuration,
 . (squares): Powder data reported by Burns et al.Reference Burns and Scott12 (triangles): Powder data reported by Ikeuchi et al.Reference Ikeuchi, Kojima and Yamamoto13
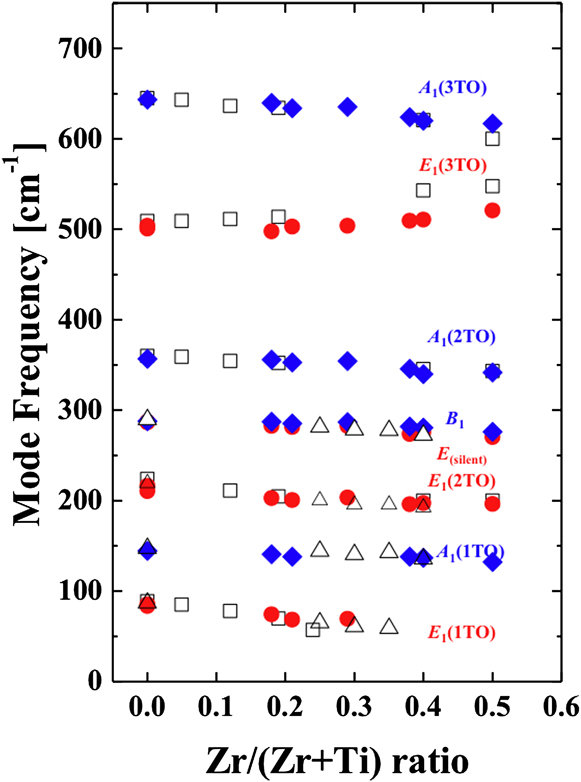
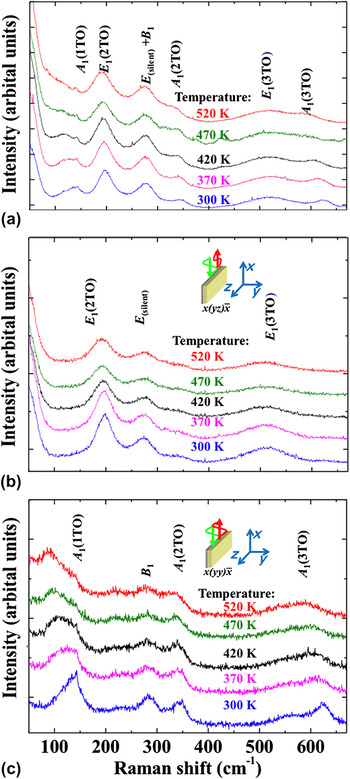
Figure 3 shows the Raman spectra of the Pb(Zr0.4Ti0.6)O3 film measured at different temperatures. A 1(TO), B 1 and E(TO) phonon modes were observed in the unpolarized Raman spectra measured at temperatures ranging from 300 to 520 K as shown in Fig. 3(a). The E(TO) mode has been successfully isolated from A 1(TO) and B 1 modes on  spectrum [Fig. 3(b)], while
 spectrum consists of A 1(TO) and B 1 modes [Fig. 3(c)]. These peaks are broadening with increasing temperature due to the vicinity of approximating to cubic-to-tetragonal phase transition temperature, which is similar to the reported ones for PZT.Reference Cho, Jang and Kim14
(a) Unpolarized, (b) crossed polarized  and (c) parallel-polarized
 Raman spectrum for the Pb(Zr0.4Ti0.6)O3 film with different measurement temperatures.

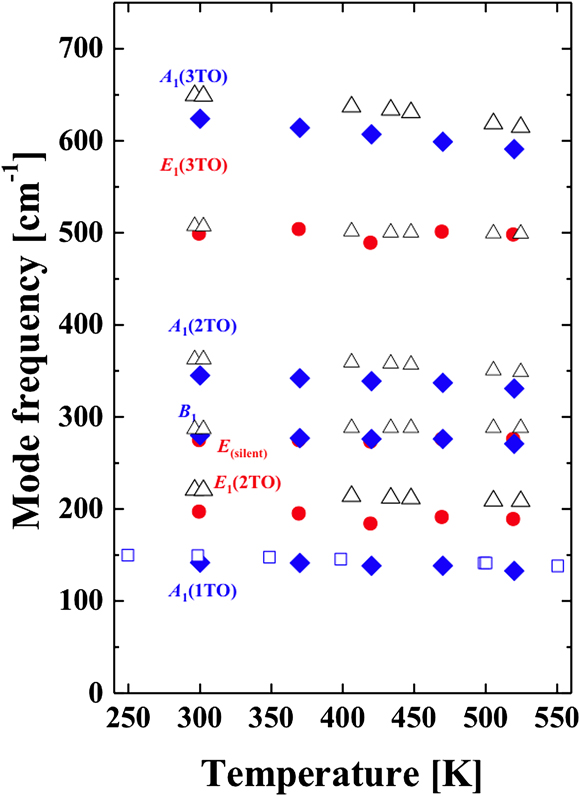
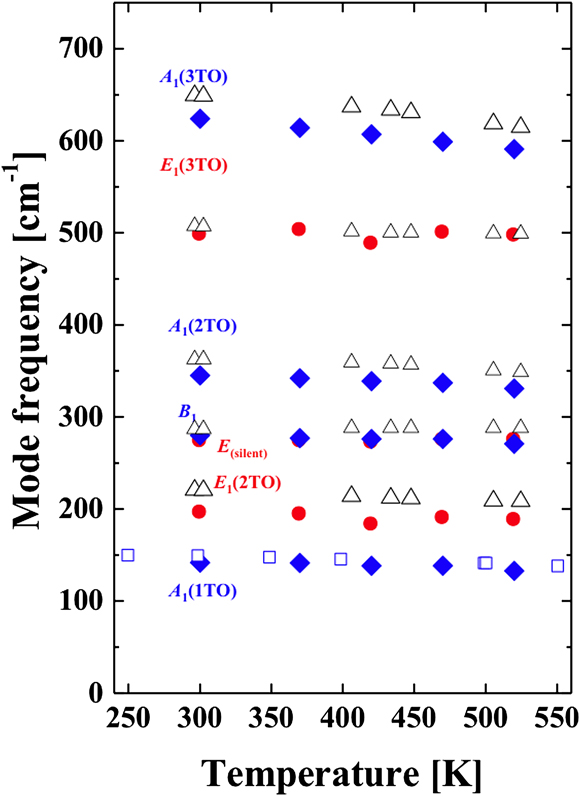
Figure 4 shows temperature dependency of the frequencies of A 1(TO), B 1 and E(TO) modes determined by the usual damped harmonic oscillator function from the data shown in Fig. 3. PbTiO3 single-crystal data reported by Burns et al.Reference Burns and Scott10 and Cho et al.Reference Cho, Jang and Kim14 are also plotted as squares and triangles, respectively. Systematic change in frequency with temperature was observed for all peaks, and it has the same trend with reported data for PbTiO3 single-crystal.Reference Burns and Scott10, Reference Cho, Jang and Kim14 It must be noted that the frequency of Raman modes for each peak position is lower than that for PbTiO3. Indeed, we noticed that Raman peaks shift to lower frequency with increasing Zr/(Zr + Ti) ratio as presented on Fig. 2.
To phonon mode frequency as a function of measurement temperature for Pb(Zr0.4Ti0.6)O3 film estimated from data shown in Fig. 3. (diamonds): Data obtained from parallel polarization,  , Raman spectrum. (circles): Data obtained from crossed polarization,
 , Raman spectrum. (squares): The frequency of A 1(1TO) for single-crystal PbTiO3 reported by Cho et al.Reference Cho, Jang and Kim14 (triangles): Single-crystal PbTiO3 data reported by Burns et al.Reference Burns and Scott10
B. Ferroelectric property and its correlation with Raman spectrum data
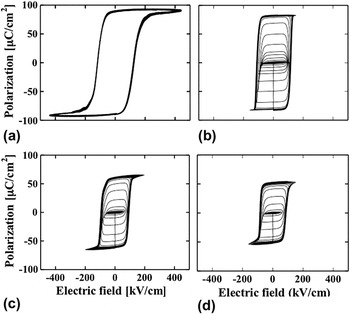
Figure 5 show the room-temperature P-E hysteresis loops measured at 1 kHz (PbTiO3 film was measured at 100 kHz due to the relatively large leakage current) and the saturation characteristic of remanent polarization, P r, for the same films shown in Figs. 1 and 2. Hysteresis loops with good squareness were observed for all films. Considering that all films are polar axis-oriented perpendicularly to substrate surface, the saturation polarization can be assimilated to the Ps; therefore, the decrease of the saturation polarization with increasing Zr/(Zr + Ti) ratio can reasonably be ascribed to the decrease of the tetragonal distortion of PZT unit cell, c/a-1, as has been pointed out based on thermodynamic theory.Reference Amin, Haun, Badger, McKinstry and Cross5
Room temperature P–E hysteresis loops for PZT films with the Zr/(Zr + Ti) ratio of (a) 0, (b) 0.29, (c) 0.38, and (d) 0.50.

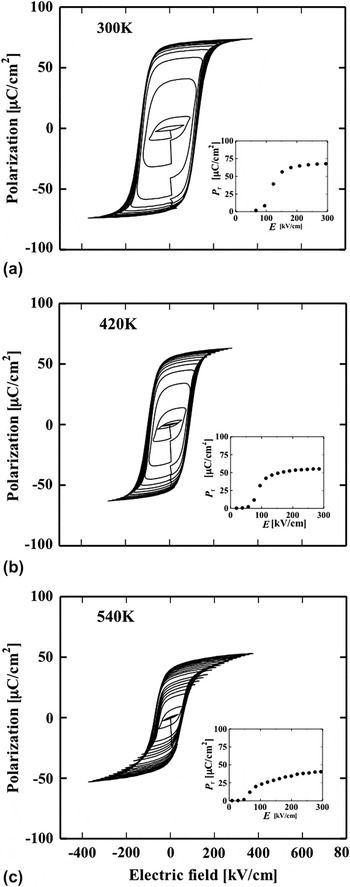
Figure 6 presents temperature dependency of the P–E hysteresis loops of Pb(Zr0.4Ti0.6)O3 film characterized on Figs. 3 and 4. Saturation characteristics of Pr are also shown as inset graphics in Fig. 6. Properly saturated hysteresis loops were observed regardless of the measurement temperature.
P–E hysteresis loops and the saturation properties of the remanent polarization (Pr) measured at (a) 300 K, (b) 420 K and (c) 540 K for Pb(Zr0.4Ti0.6)O3 film.

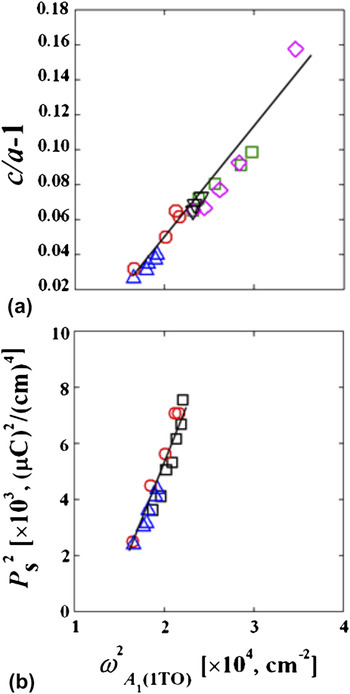
At this stage, we tried to get a correspondence between Ps and tetragonal distortion [(c/a)-1] and information extracted from Raman spectroscopy, especially soft mode frequency [A 1(1TO)]. Figures 7(a) and 7(b) respectively show [(c/a) −1] and the Ps 2 as a function of ω 2[A 1(1TO)] for the data presented in Figs. 1–6. Reported data for PbTiO3 crystals are also plotted in Fig. 7(b)Reference Cho, Jang and Kim14, Reference Mabud and Glazer15 We also added in Fig. 7(a) based on reported data from Chen et al.Reference Chen, Hu, Sun, Sun and Xing16 for PbTiO3-BiMeO3 [Me: Fe, (Zn1/2Ti1/2) and (Zn3/4W1/4)] having tetragonal symmetry. We could observe that these are in perfect agreement with values reported in literature, and can estimate maximum P s value of 100 μC/cm2 for PbTiO3-BiFeO3 solid solution system. This also suggests that these materials show displacement magnitudes of B cation in BO6 octahedra that are comparable to Pb(Zr, Ti)O3 cases.Reference Jang, Oak, Lee, Jeong and Scott17 Hence, it enables us to estimate Ps value of these materials using the relationships between Ps and ω[A 1(1TO)] as presented in Fig.7(b).
(a) [(c/a)-1] and (b) P s2 as a function of ω 2[A 1(1TO)] obtained from Pb(Zr,Ti)O3 films with various Zr/(Zr + Ti) ratio and from Pb(Zr0.4Ti0.6)O3 by changing measurement temperature. The reported data for (1-x)PbTiO3-xBiMeO3 compounds [Me = Fe (diamonds), Zn1/2Ti1/2 (squares), Zn3/4W1/4 (inverse triangles)] are shown in (a). The square symbols in (b) are the reported values from the reported Ps and ω[A1(1TO)] for PbTiO3 single crystal.Reference Mabud and Glazer15, Reference Jang, Oak, Lee, Jeong and Scott17

These data shows that ω [A 1(1TO)] is a useful factor to estimate tetragonal distortion as well as Ps. Thus, if we consider that residual strain can be estimated from Ps, it appears that Raman spectroscopy characterization becomes a powerful way of noncontact measurement to estimate lead zirconate titanate (PZT) films’ performances. In real devices application, Pb(Zr, Ti)O3 films were deposited on Si substrates and (100) orientation was incorporated together with (001) orientation in the films. We have already reported estimation of the (001) volume fraction, estimation of the (001) orientation using intensity of the A 1(1TO) mode.Reference Nakajima, Nakaki, Ehara, Yamada, Nishida, Yamamoto, Osada and Funakubo18 Therefore, estimation of the Ps can be available taking account the volume fraction of (001) even in case of films with the combined orientation of (001) and (100) prepared on Si substrates. Based on these results, Raman spectroscopy analysis is very useful for process check and device reliability for MEMS devices using piezoelectric materials.
IV. CONCLUSIONS
The E(TO) modes were successfully isolated using cross-polarization configurations, while A 1(TO) and B 1 modes were activated using parallel configurations using the same polar axis-oriented epitaxial PZT films with small residual strain. Raman scattering and ferroelectric properties were investigated using the same samples. The square of A 1(TO) mode frequency increases linearly with the square of the observed Ps within the examined range of Zr/(Zr + Ti) ratios and temperatures.
ACKNOWLEDGMENTS
This research is partially granted by the Japan Society for the Promotion of Science (JSPS) through the ?Funding Program for World-Leading Innovative R&D on Science and Technology (FIRST Program),? initiated by the Council for Science and Technology Policy (CSTP) and Ministry of Education, Culture, Sports, Science and Technology of Japan.