I. INTRODUCTION
The microstructure resulting from severe plastic deformation (SPD) is the critical element that manifests a suite of mechanical and functional properties of the final product in an array of conventional and emerging manufacturing processes, including surface generation by SPD in machining, friction stir processing, equal channel angular pressing, etc.Reference Mishra, Kad, Gregori and Meyers1,Reference Valiev and Langdon2 Traditionally, SPD focusses on imposing high strains, typically under conditions involving low strain rates and moderate temperature rises to create an ultrafine grained (UFG) or a nanostructured material characterized by high strength.Reference Mishra, Kad, Gregori and Meyers1,Reference Kawasaki, Ahn and Langdon3–Reference Shankar, Rao, Lee, Chandrasekar, King and Compton5 However, high strain deformation often involves recrystallization (RX) phenomena that are particularly active in the presence of elevated temperatures.Reference Amouyal, Divinski, Klinger and Rabkin6,Reference Molodova, Gottstein, Winning and Hellmig7 Such recrystallization can become a central determinant of final microstructure, which directly influences the mechanical properties, resulting formability, while simultaneously affecting other physical properties (such as electrical resistivity).Reference Gottstein8,Reference Cahn and Haasen9 Recrystallization phenomena occurring during deformation are termed dynamic recrystallization (DRX) and are characterized by mechanisms that either involve outright grain boundary migration or evolutionary transformations of subgrain boundaries to high-angle grain boundaries (HAGBs).Reference Humphreys and Hatherly10–Reference Montheillet and Le Coze12 Understanding the interplay of DRX with strain-induced microstructure refinement is critical for achieving microstructure control in SPD processes, especially those involving the superposition of large strains, strain rates, and temperatures.Reference Andrade, Meyers, Vecchio and Chokshi13
Microstructural response is relatively well understood under the imposition of low strain rate (<102/s) and moderate levels of strain (<<1). Standard protocols have also been established for gauging the constitutive response in subsets of dynamic deformation regimes. These include the Hopkinson bar test (high strain rate >103/s, low strain <1) and the hot torsion test (typically, moderate strain rate <102/s, high strain >10).Reference Nicholas14–Reference McQueen and Bergerson17 In the regimes, characterized by these established protocols, there have been several efforts aimed at understanding the trajectories of microstructure refinement, and the onset of the DRX phenomena across the strains, strain rates, and temperatures.Reference Nicholas14,Reference McQueen18–Reference Meyers, Subhash, Kad and Prasad25 However, there is a lack of understanding of the dynamic microstructure transformations in the process regimes excluded by these protocols, especially in the high strain (>1) and high strain-rate (>102/s) states. Anecdotally, it has been recognized, over a small swathe of this regime, typically involving a strain of ∼2 and a strain rate of about 103/s, that the coupled thermomechanical state leads to rampant DRX phenomena that directly impact the achievement of refined microstructures.Reference Andrade, Meyers, Vecchio and Chokshi13,Reference Chokshi and Meyers26 Bridging a knowledge gap in this thermomechanical processing regime is particularly useful in manufacturing research, given its prevalence in surface generation by the ubiquitous metal cutting and machining processes and in emerging friction stir welding/processing technologies.
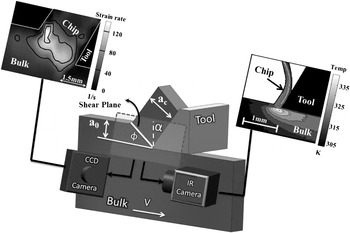
For example, the surface that is left behind from machining-based processes such as milling, turning, drilling, etc. are inherited from a shear deformation field that is characterized by precisely such thermomechanical conditions. The functional and mechanical properties of the resulting surfaces that encompass a vast majority of engineering components would then be directly impacted by the microstructural transformations characterizing these conditions; DRX phenomena being preeminent among them. Motivated by this, we resolve the mechanism of DRX in the shear deformation regime of strains >1 and strain rates >102/s and their coupled temperature rises.Reference Shekhar, Cai, Basu, Abolghasem and Shankar27 To understand the microstructural consequences, it is necessary to choose a deformation configuration that allows for the measurable imposition of these deformation conditions while simultaneously producing deformed samples that can be characterized using electron microscopy. We utilize large strain machining (LSM) in the plane strain state that enables examination of strains ranging from 1 to 10, strain rates in the range of 10–103/s, and temperatures from near ambient to ∼470 K in a simple shear configuration (Fig. 1). This machining geometry can provide us with uniformly deformed regions while allowing for in situ measurements of thermomechanical conditions. Since the deformation zone is not enclosed in a die, it allows for direct characterization of the mechanics of deformation using high speed visible light imaging and infrared (IR) thermography to then allow an accurate elucidation of the microstructural transformations as a function of the thermomechanics of plasticity.
Schematic of LSM in a plane strain configuration that is used as a test of microstructure response under severe deformation. Configurations for performing DIC and IR thermography from the side of the deformation are illustrated. These measurements are performed close to center of the deformed “chip”, where uniform simple shear deformation is observed.

Characteristics such as distribution and fraction of recrystallized/deformed grains and the possible texture transformation are critical in the study of microstructure evolution involving DRX. Several methods can be utilized to determine the fraction of recrystallization. Traditionally, optical microscopy (OM) was utilized as the most direct approach to discriminate between recrystallized and deformed microstructure,Reference Akbari, Sellars and Whiteman28,Reference Baxter, Dulv, Orsetti Rossi, Sellars, Whiteman, Shercliff, Ashby, Hansen, Liu, Jensen and Ralph29 providing the added advantage of directly investigating a large area for an increased sample size. However, OM will not suffice in the case of heavily deformed samples presenting challenges in differentiation between recrystallized and deformed fractions. Microhardness measurements are used in Ref. Reference Haessner and Hofmann30 and the expected decrease during the early stages of recrystallization offers a marker for identifying the onset of these phenomena. X-ray diffraction analysis has also been used to study the recrystallization process in Copper.Reference Gerber, Tarasiuk, Chauveau and Bacroix31
For refined microstructures, electron backscatter diffraction (EBSD) in the scanning electron microscope (SEM) has been shown to provide accurate information for discriminating between recrystallized and deformed grains.Reference Mitsche, Poelt and Sommitsch32–Reference Humphreys35 EBSD analysis facilitates the study of both the individual grains and their crystallographic relationship with neighboring grains.Reference Mitsche, Poelt and Sommitsch32 Furthermore, grain orientation spread (GOS) through EBSD analysisReference McNelley, Zhilyaev, Swaminathan, Su, Sarath Menon, Schwartz, Kumar, Adams and Field36–Reference Lim38 can help estimate recrystallization fraction utilizing intragranular orientation variations. Deformed grains are characterized by high GOS values due to higher geometric necessary dislocation (GND) content in them; recrystallized grains on the other hand have low GOS values as they are relatively free of internal dislocations. The GOS approach was found to be effective for AlReference Alvi, El-Dasher, Rollett, Jin, Beaudoin, Bieler and Radhakrishnan39–Reference Alvi, Cheong, Weiland and Rollett42 and NiReference Mitsche, Poelt and Sommitsch32,Reference Tarasiuk, Gerber and Bacroix33,Reference Mitsche, Poelt, Sommitsch and Walter43,Reference Mitsche, Sommitsch, Pölt and Kleber44 in providing a rigorous framework to quantify recrystallization characteristics. In the present paper, we adapt this technique to characterize the progression of dynamic recrystallization phenomena across the thermomechanical conditions of interest. A suitable GOS cutoff threshold is obtained to distinguish recrystallized and nonrecrystallized grains. The GOS is then utilized to gauge the extent of microstructure transformation during DRX. Using this analysis, we identify geometric dynamic recrystallization (GDRX), which is a subset of DRX phenomena, as the primary vehicle for the microstructure evolution under the range of deformation conditions considered here.
Moreover, in a recent paper,Reference Abolghasem, Basu, Shekhar, Cai and Shankar45 we had shown that the evolution of the subgrain size under such conditions is captured from two parameters—the strain and the parameter “R” that is a function of the strain rate, temperature, and material constants. In this prior work, we have focused on parameterization of subgrain size to capture its evolution. The idea behind this elucidation is to offer a microstructure variable that can lead to delineation of other microstructural characteristics. For example, the subgrain size is often found to covary with the dislocation density in consonance with expectations of similitude or the mechanical strength can be modeled as superposition of contributions from grain size, subgrain size, and dislocation density.Reference Kuhlmann-Wilsdorf46–Reference Nes48 Furthermore, the onset of GDRX is closely tied-in with the evolution of the subgrain size,Reference Humphreys and Hatherly10 and here, we will utilize our earlier model for subgrain size to evolve a model for identifying the criterion for the dynamic recrystallization mechanism.
II. EXPERIMENTAL METHODS
In this study, deformation of oxygen-free high conductivity (OFHC) Cu is examined over strains ranging from 1 to 10, strain rates ranging from 10 to 103/s, and their coupled temperature rise ranging from ambient to ∼470 K to identify the mechanisms of DRX and its interplay with the evolution of the UFG microstructure. Note that these conditions are chosen to fill the continuum between traditional Hopkinson bar tests (low strain, high strain-rate state) and hot torsion tests (high strain, moderate strain-rate state). First, microcrystalline OFHC Cu was annealed at 973 K for 2 h and deformed using LSM in a simple shear SPD configuration as shown in Fig. 1. We have utilized this configuration to study the consequences of simple shear in plane strain state because it offers a convenient framework that also allows for the in situ measurement of the thermomechanics of deformation, using high-speed light and IR imaging, so that the subsequent observations of the microstructural consequences can be reliably mapped to the SPD conditions. LSM imposes severe shear using a wedge-shaped high-speed steel cutting edge characterized by the rake angle (α) that advances against a 3-mm workpiece in width, and when a 0 in Fig. 1 is much smaller than the width in the third dimension, the deformation is predominantly one of plane strains. Note that no coolant or oil is used while cutting. Cu in these experiments, in addition to being a useful prototype for face-centered cubic (FCC) materials, also offers the advantage of undergoing uniform simple shear in this configuration to create “continuous chips” of significant cross-sections that can still be reliably characterized. Further details of this experimental configuration can be found in Ref. Reference Abolghasem, Basu, Shekhar, Cai and Shankar45. Furthermore, based on the realization that the microstructure on machined surfaces is closely related to the chip microstructure, both derived from the primary deformation zone, this elucidation is expected to offer an approach to understand the surface microstructure inherited by the freshly generated surface.Reference Abolghasem, Basu, Shekhar, Cai and Shankar45
Various deformation conditions listed in Table I corresponding to different LSM conditions (three rake angles α = 0, 20, and 30°) and various deformation speeds, V [viz. Low (L) = 50 mm/s; Med (M) = 550 mm/s, and High (H) = 1250 mm/s] resulted in nine conditions corresponding to a wide range of strain, strain rates, and temperatures (Table I). The samples are denoted as 0L, 0M, 0H, etc., where the numbers represent the rake angle and the alphabets L, M, H refer to the deformation speeds. These conditions resulted in effective strains in the range of 1–10 calculated by
 $$\varepsilon = {\gamma \over {\sqrt 3 }} = {{\cos \alpha } \over {\left( {\sqrt 3 \sin \phi \cos \left( {\phi - \alpha } \right)} \right)}}\quad {\rm{,}}$$
where ε is the effective strain, γ is the shear strain, φ the shear plane angle, and α the rake angle (Fig. 1). The shear plane angle is given by tanφ = (a 0/a c cos(α)/(1 − a 0/a c sinα) in terms of the ratio of the undeformed material (a 0) to that of the deformed chip (a c) as shown in Fig. 1. In all the experiments, a 0, defined as undeformed chip thickness or in other words the depth of cut, was chosen to be ∼0.17 mm and the resulting a c values were measured for the various conditions to estimate the strain value using equations above as listed in Table I.
Deformation conditions [effective strain (ε), effective strain rate ( ${{\dot \varepsilon }}$), measured temperature using IR camera (
 ${T_{\exp }}$), calculated temperature at deformation zone using moving heat source model (
 ${T_{{\rm{calc}}}}$) for the various machining parameters (rake angle (α) and cutting speed (V)]. Hardness values of the deformed chip material resulting from the various thermomechanical conditions are also shown (kgf/mm2) and the hardness value for bulk Cu is 46 kgf/mm2. Critical strains (εcr) for the onset of GDRX as functions of both lnZ [Eq. (4)] and the parameter R [Eq. (6)] are listed.Reference Abolghasem, Basu, Shekhar, Cai and Shankar45

The strain-rate values ( $\dot \varepsilon$) in the deformation zone are known to scale asReference Oxley and Hasting49:
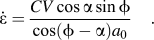 $$\dot \varepsilon = {{CV\cos \alpha \sin \phi } \over {\left {\cos \left( {\phi - \alpha } \right){a_0}} \right}}\quad {\rm{.}}$$
Here, the constant “C” which is also known as the Oxley parameter is a material parameter that relates the average strain-rate prevalent near the shear plane of LSM to the cutting velocity (V), rake angle (α), shear angle (Φ), and undeformed chip thickness (a 0) using Eq. (2). The parameter “C” was calculated empirically for OFHC Cu, performing a procedure called digital image correlation (DIC) using a PCO1200HS camera system. The procedure involves empirical measurement of the strain-rate prevalent near the shear plane while machining OFHC Cu with a known set of parameters, V, α, Φ, and a 0. This is done by spraying the side of the LSM workpiece lightly with black spray paint and then illuminating it brightly with a light source. This produces a concentrated speckle pattern on the side when observed through the high-speed camera. Thereafter, LSM is performed with the aforementioned set parameters V, α, Φ, and a 0 and the resulting movement of the speckle pattern during chip formation is recorded in situ. Using image correlation algorithms, this movement is quantified for a region of interest close to the shear plane and is thereafter differentiated spatially and temporally to produce a strain-rate field. Eventually, this spatial average of the strain rate is calculated near the shear plane (Fig. 1) and is related to parameters V, α, Φ, and a 0 using Eq. (2) to back calculate “C”. Subsequently, Eq. (2) is again used for any other LSM condition set to find the average strain-rate prevalent near the shear plane of that set. This calculation resulted in the average value of 2.77 for parameter “C” for copper (V in mm/s and a 0 in mm). This determination resulted in strain-rate accuracies better than 5% in calibration experiments.Reference Lee, Hwang, Shankar, Chandrasekar and Compton50 The strain-rate values for various sample conditions are listed in Table I and a typical DIC image is illustrated in Fig. 1.
To complement the measurements of the strain and strain-rate, the temperature in the deformation zone is measured using a calibrated IR camera in a configuration that mirrors the visible high-speed imaging for the aforementioned DIC analysis. IR thermography is utilized to measure temperature in the severe shear deformation zone where thermocouples or other contact-based measurement techniques cannot be utilized. To calibrate the camera, radiation count values versus temperature plot was obtained using a plate that was painted black and then electrically heated with coils while the temperature was simultaneously measured using thermocouples over temperatures ranging from 298 to 500 K. This provided the calibration curve that was used to convert the IR image into the temperature field data. It should be noted that the camera was focused on the middle of the deformation zone, where DIC confirmed the imposition of uniform shear, ahead of the tool tip.Reference Lee, Hwang, Shankar, Chandrasekar and Compton50 Typical IR thermography of the deformation zone is shown in Fig. 1 on the top right, and the measured values (T exp) for the various SPD conditions are listed in Table I. It is notable that our current thermography capabilities are limited to relatively low strain-rate conditions because of the low frame rate of the IR camera and its low spatial resolution where each pixel on the camera corresponds to ∼20 × 20 µm on the sample while the deformation zone itself is tens of micrometers in width.
Following the characterization of the thermomechanics, we performed a characterization of the microstructure resulting from SPD (Fig. 2). To perform such analysis, we focused on the microstructure near the center of the chip away from the tool–chip interface where DIC and IR experiments confirmed uniform deformation conditions (Fig. 1). Samples were prepared for orientation imaging microscopy (OIM) using EBSD in a Phillips XL-30 SEM (FEI Company, Hillsboro, OR). For this, the samples were metallographically polished using SiC and diamond pastes and finally prepared for microscopy using extended polishing with a 0.05 µm alumina solution. TSL OIM software was utilized for data acquisition and analysis of the EBSD micrographs to extract information about grain characteristics, such as grain size and subgrain size, which were calculated from the number weighted average of the respective areas to then determine the equivalent circle diameter. Additionally, the length of regular HAGBs defined as grains for which the interfaces are misoriented by >15° and low angle grain boundaries (LAGB) defined as grains for which the interfaces are misoriented by 2–15° were used in determining the fraction of LAGB/HAGB for various sample conditions. Microstructure details, such as fractions of the HAGBs, were measured and averaged for different scans of various conditions as listed in Table II. In Table I, hardness values along with the error bars are also shown for various sample conditions. To obtain hardness values, hardness tests were conducted on all chips using a Shimadzu microhardness tester (HMV-2; Canby, OR). A load of 50 g was utilized to make the indentation close to the center of the chips (far from the edges) where the uniform simple-shear deformation is observed. The indentation is created for a minimum of 10 measurements and the average and standard deviation (<6%) were obtained accordingly.
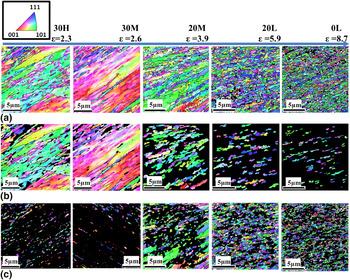
Microstructure evolution as a function of deformation conditions. IPF maps of (a) the scan area (series a), (b) filtered portions of the microstructure illustrating the deformed microstructure composed of nondynamically recrystallized regions (series b), and (c) filtered images illustrating the dynamically recrystallized regions (series c) as a function of strain for a range of samples. Scale bars are 5 µm in length. The filtering methodology that uses the GOS is described in the results and discussion section.


III. RESULTS AND DISCUSSION
LSM was used to impose a spectrum of strains (1–10), strain rates (10–103/s), and deformation temperatures ranging from ambient to ∼470 K in Cu (Table I) to understand their effect on the microstructure and in particular, to quantify the onset and progression of dynamic recrystallization. It is known that the formation of recrystallized regions during deformation strongly depends on the coupled temperature rise generated in the primary deformation zone.Reference Andrade, Meyers, Vecchio and Chokshi13,Reference Raybould and Sheppard51–Reference Cerreta, Frank, Gray, Trujillo, Korzekwa and Dougherty54 Therefore, it is important to accurately measure the temperature in the deformation which was accomplished through in situ IR thermography. However, since the frame rate of an IR camera is usually limited, it was not possible to empirically measure the temperature for all different deformation speeds that were utilized to examine a range of strain rate conditions. Hence, we calculated the temperatures in the primary deformation zone analytically and validated them against empirically measured values (T exp) for the conditions where IR thermography was possible. The temperatures were calculated (T calc) using Oxley’s extended modelReference Adibi-Sedeh, Madhavan and Bahr55,Reference Shekhar, Cai, Basu, Abolghasem and Shankar56 and listed in Table I across the spectrum of the strains and strain rates considered here. The details of the temperature calculations can be found in Ref. Reference Shekhar, Cai, Basu, Abolghasem and Shankar56. It is clear from Table I that the calculated values are in reasonable agreement with the IR measurement. Following the in situ characterization of the thermomechanical conditions involving SPD by LSM in Cu, the next step is to investigate the progression of DRX phenomena using quantitative electron microscopy across the deformation conditions.
A. Microstructure evolution as a function of thermomechanics of deformation
Usually, increasing levels of strain are found to lead to refined dislocation-free domains that are encompassed by high misorientation angle boundaries that characterize the dynamically recrystallized portions of the microstructure. Understanding the overall mechanical behavior of the materials and the subsequent thermal stability of the UFG microstructure is strongly related to the extent and fraction of dynamic recrystallization phenomena during SPD.
When copper is subjected to large plastic strains (1–10), high levels of strain rates (10–103/s), and the coupled temperature (ambient to 470 K) by LSM, a refined microstructure with subgrain sizes of the order of 0.23–0.43 µm is produced.Reference Abolghasem, Basu, Shekhar, Cai and Shankar45,Reference Shekhar, Cai, Basu, Abolghasem and Shankar56 It is reasonable to expect that under these conditions, such refinement occurs in conjunction with dynamic recrystallization, whose progression is a function of the deformation strain, strain rate, and temperature. The progressive refinement of the microstructure with increasing strain is illustrated in the first row of Fig. 2, where highly refined sub micrometer-scale structures are depicted as a function of strain. The top row images, Fig. 2(a), are the inverse pole figures (IPF) maps of the scan area that are selected from the multiple scans obtained by EBSD analysis to represent the microstructure for the various LSM conditions (Table I). The second row, Fig. 2(b), depicts the deformed fraction of the microstructure and the third row, Fig. 2(c), the recrystallized fraction as a function of strain demarcated on top of the image. The acquisition of these filtered images and the delineation of the progression of recrystallization fraction is discussed subsequently. Looking at the first row images in Fig. 2, left to right, we see with higher levels of strain to the right, microstructure becomes finer, as expected. The 0L condition (ε = 8.7) that entails highest levels of strain at the smallest strain rate, and moderate temperature rise (Table I) is characterized by the finest microstructure. Note that for all these ranges of strain levels, the hardness values as listed in Table I, appear saturated at ∼155 kgf/mm2. This is quite typical of materials that have been subjected to large strains where hardness measurements become rather insensitive indicators of the refined microstructures resulting from severe deformation.Reference Valiev and Langdon2
Traditionally, the effects of strain rate and temperature on the materialReference Zener and Hollomon57 and microstructure responseReference Zhao, Tao, Guo, Lu and Lu58 couple through the Zener–Hollomon parameter (Z). Using our in situ measurements of the deformation zone ahead of the tooltip, the average strain rates ( ${{\dot \varepsilon }}$) and temperatures (T) correspond to the Zener–Hollomon parameter calculated as
 $Z = \dot \varepsilon \exp \left( {Q_{{\rm{SD}}} /RT} \right)$. In this equation, R is the gas constant and Q SD is the activation energy taken to be that for self-diffusion in Cu, which is ∼195 kJ/mol.Reference Ma and Tjong59 The lnZ values for various conditions are calculated and listed in Table I. We note parenthetically that this encapsulation of strain rate and temperature into one parameter offers a convenient route for projecting microstructures across a range of deformation conditions using a rate-strain-microstructure map with the x-axis as the strain and the y-axis as lnZ onto which quantitative microstructural attributes can be mapped.Reference Shekhar, Cai, Basu, Abolghasem and Shankar56
Realizing that such earlier mean-field approaches did not include dynamic recrystallization phenomena, we focus our efforts here to quantify this as a function of the deformation conditions. Quantifying the characteristics of deformed microstructures is particularly viable using EBSD-based OIM since it provides crystallographic information about the grain structure from which various characteristics can be extracted. These include the measurement of the grain size, subgrain size, the distribution and fraction of the recrystallized grains in specimens, and a characterization of the crystallographic textures. Also, it can help distinguish neighborhood relationship between the grains and subgrains, which can provide information about the relationships that indicate the onset of microstructural transformations.Reference McNelley, Zhilyaev, Swaminathan, Su, Sarath Menon, Schwartz, Kumar, Adams and Field36,Reference Randle and Engler60
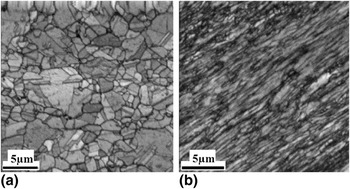
Data from EBSD analysis can be used in a variety of ways to distinguish quantitatively, the differences between portions of the microstructure that have undergone recrystallization versus those that are merely severely deformed. For example, severely deformed grains and subgrains that have not been affected by dynamic recrystallization contain a high density of dislocations, including a substantial GND Reference Gao and Huang61 content. Microstructural domains characterized by these features demonstrate high local crystallographic misorientation/distortion and low image quality (IQ) in EBSD. On the other hand, recrystallized regions are characterized by lower dislocation content and concomitantly lower local misorientation and higher value of IQ. Approaches for exploiting such differences between deformed and recrystallized grains include IQ, grain average misorientation (GAM), and GOS methodologies. Although the IQ and GAM approaches seem to suggest useful information in this investigation, they are often too insensitive to distinguish recrystallized grains.Reference Mitsche, Poelt and Sommitsch32,Reference Poelt, Sommitsch, Mitsche and Walter34 The GOS method has been shown to work successfully in previous studies,Reference Mitsche, Poelt and Sommitsch32,Reference Tarasiuk, Gerber and Bacroix33,Reference Alvi, El-Dasher, Rollett, Jin, Beaudoin, Bieler and Radhakrishnan39–Reference Mitsche, Sommitsch, Pölt and Kleber44 which is our preferred methodology here. Often, utilizing these approaches requires the establishment of the baseline for recrystallization (usually a sample characterized by rampant grain growth) against which inhomogeneous microstructures comprised mixtures of deformed and recrystallized regions can be characterized. Here, we identify the 0H sample (Table I) that underwent SPD at a deformation temperature of 485 K as the baseline. We found that this sample had a low hardness and a very coarse microstructure, likely resulting from rampant dynamic recrystallization.Reference Humphreys and Hatherly10 It is also apparent from the IQ map in Fig. 3(a) that the 0H sample is characterized by significantly lower defect content and a coarser microstructure than a typical deformed microstructure like that in 30M sample, Fig. 3(b). It is notable that the deformed microstructure in 30M sample has led to the lower quality IQ image in Fig. 3(b) where the haziness of the image is likely due to larger defect densities.
(a) IQ microstructure map of 0H showing coarser, predominantly defect-free grains, (b) microstructure of the 30M sample showing a defect-ridden low IQ microstructure.

B. Grain orientation spread
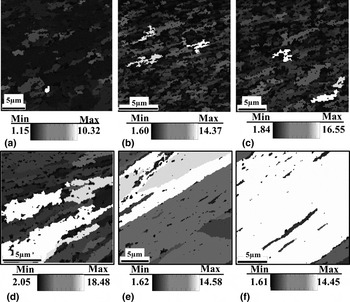
GOS has been used to discriminate the deformed and recrystallized grains by providing information on the distribution of misorientations within the grains.Reference Tarasiuk, Gerber and Bacroix33,Reference Mitsche, Poelt, Sommitsch and Walter43,Reference Wright62 GOS is defined as the average misorientation among all the points within the grain with its value based on the orientation (g) for N = number of pixels, for which g is measured from EBSD:  ${\rm{GOS}} = {\textstyle{1 \over {N - 1}}}{\textstyle\,{1 \over N}}\sum\nolimits_{i = 1}^N {\sum\nolimits_{j = 1}^N {\Delta {g_{ij}}\,\left( {{g_i},{g_i}} \right)} } ,\;i \ne j$.Reference Lim38 It is known that the higher the level of deformation, the higher would be the misorientation within a grain resulting from the stored dislocation content. Onset of recrystallization can lead to the decline of these values resulting from the introduction of relatively defect-free grains among the deformed matrix. The threshold of the GOS value that distinguishes the local microstructural state (deformed or recrystallized) needs to be identified, which can then be used on the EBSD scans to partition the respective regions for the materials created under a range of thermomechanical conditions. As a qualitative starting point, we studied the variation of the GOS valueReference Lim38 in the microstructures of the samples. Figure 4 shows the GOS map for different sample conditions where the colors represent the GOS values of the various regions of the microstructure. It is immediately apparent that significant portions of the various microstructures resulting from severe strains show a low value of GOS that are interspersed by regions that show a high GOS value. Among the various microstructures, Fig. 4(a) illustrates the microstructure for the 0H sample that was created from severe strains, but also a high temperature rise (Table I), which is characterized by predominantly low values of GOS. Figure 3(a) and results of OM and electron microscopy showed that this sample has undergone rampant dynamic recrystallization to result in a fully coarsened micro-scale grain structure.Reference Shekhar, Cai, Basu, Abolghasem and Shankar27,Reference Shekhar, Cai, Basu, Abolghasem and Shankar56 In contrast to this sample, the 30M sample [Fig. 4(f)] shows predominantly high values of GOS that indicates a highly defected microstructure that is likely unaffected by DRX phenomena.
GOS maps with grains shaded associated with GOS values. (a) 0H, (b) 0L, (c) 20L, (d) 20M, (e) 30H, and (f) 30M.

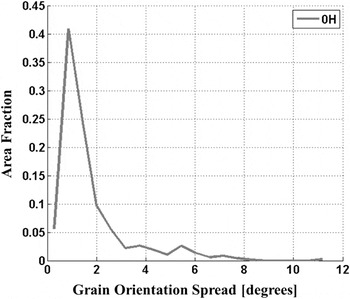
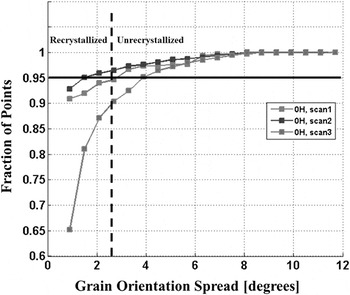
For establishing a baseline, we use the microstructure in the 0H sample as one representing the fully dynamically recrystallized condition, and for this condition, we calculated the GOS distribution in Fig. 5. In this figure, a strong peak is discernible corresponding to the dominant orientation spread of a small GOS value. On this plot, the tail of the peak seems to be initiated roughly in the range 2–3°, which is essentially the cutoff value for the distribution that characterizes the 0H sample. Figure 6 illustrates the cumulative distribution of the GOS for independent scans of three 0H samples. Setting a threshold of 95% as the threshold of transformation (see Refs. Reference Gerber, Tarasiuk, Chauveau and Bacroix31, Reference Alvi63, Reference Jazaeri and Humphreys64) for this sample, it shows an average GOS threshold value (dashed line) of 2.6° that distinguishes the dynamically recrystallized portions of the microstructure from those that are not. This number is also quite consistent with that observed qualitatively in Fig. 5. This GOS threshold is then used as a criterion to filter the microstructure scans to delineate the images of recrystallized and deformed grains which are depicted in Fig. 2 second and third rows. In the second row, Fig. 2(b), the IPF images depict the deformed grains for which the original scans are filtered to entail GOS values >2.6°. Similarly, the third row images, Fig. 2(c), show the recrystallized grains as a function of strain value comprising the GOS value <2.6°.
GOS distribution of the 0H sample.

Variation of cumulative distributions of GOS for independent replicates of the 0H sample.

C. Quantifying progression of dynamic recrystallization (DRX)
A first step to measure the fraction of the dynamically recrystallized portions of the microstructure (f rec) is by evaluating the area fraction of microstructure from EBSD having the GOS value <2.6°. The average value of the dynamically recrystallized fractions and the standard deviations were calculated for various scans/sample replicates across the different thermomechanical conditions and are listed in Table II. The 0H sample, as expected, has the highest value, whereas the 30M sample has the lowest fraction. A plot of recrystallization fraction versus strain is shown in Fig. 7 under various conditions indicating a predominantly monotonic relation between the two parameters except for the 0H sample, which was an outlier in this analysis. The insets in Fig. 7 [insets (a), (b), (c)] show the evolution of grain boundaries as deformation progresses. This dependence is also evident from the IPF images in Fig. 2(c) which are filtered to delineate the recrystallized portions of the microstructure using the aforementioned GOS-based approaches. Analogous to Fig. 7, we also sought to explore the role of strain rate and temperature in determining the progression of dynamic recrystallization by plotting the recrystallization fraction as a function of lnZ parameter. However, a very weak correlation seemed to exist between these two parameters at least in the range of empirically achievable LSM conditions examined here. Hence, we moved forward to examine the recrystallization fraction behavior versus another analogous parameter “R”Reference Abolghasem, Basu, Shekhar, Cai and Shankar45—a function of lnZ and material constants—in the present work.
Recrystallized fraction increasing with effective strain (ε) for the various LSM samples listed in Table I. The schematic insets show the mechanism of progression of geometric dynamic recrystallization (GDRX). (a) As deformation evolves, the increasing strain leads to progressive thinning of the grains which is accompanied by the serration of the original HAGB (thick white lines), (b) eventually these serrations meet and (c) result in a microstructure composed of refined grains encompassed by HAGB.

Traditional discontinuous dynamic recrystallization (DDRX) is understood to proceed via the formation of new grains (often nucleated at grain boundaries), whose boundaries migrate to consume the driving force that is aided by the stored dislocation densities made available by the deformation. The growth ceases when the driving force declines or by the nucleation of mitigating grain boundaries.Reference Humphreys and Hatherly10 We notice from an observation of the microstructures across the swathe of thermomechanical conditions considered here that predominantly, the grain structures for most of the conditions are ultrafine grained, while those for 0H sample is a clear outlier characterized by a coarse microstructure. It is likely that the high temperature involved during its formation led to rampant DDRX, which is feasible, given the mobility that is allowable under these temperature conditions. It has also been recognized that dynamic recrystallization can occur via a more continuous evolution of HAGBs in a microstructure in ways other than the nucleation and growth of grains at preexisting boundaries.Reference Humphreys and Hatherly10 Such processes generally are often identified as continuous dynamic recrystallization (CDRX). It should be noted that dynamic recrystallization need not necessarily be exclusively DDRX or CDRX, but a composite manifestation of both depending on the deformation conditions. Nonetheless, CDRX is more typical in materials with low mobility of grain boundaries and high stacking fault energy (SFE), while DDRX is more common in low to moderate SFE. However, CDRX does depend on the purity of the metals in addition to the deformation conditions and SFE.Reference Montheillet and Le Coze12 It is known that the presence of the solute atoms and second phase particles which reduce the mobility of both dislocations and HAGBs lead to a preponderance of CDRX. Here, we should point out that OFHC Cu used in machining is not ultrapure and it is not unreasonable to expect CDRX. Also, a continuum of microstructures is discernible across the various ultrafine structures in Fig. 2, excepting the 0H condition and there does not appear to be recognizable discontinuous evolution associated with “nucleation” and “growth” characterizing DDRX.Reference Humphreys and Hatherly10
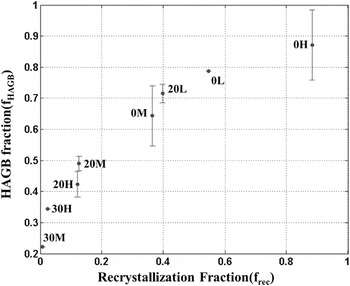
To further understand the evolution of DRX, we measured the length fraction of HAGBs for the microstructures using the OIM data for samples resulting from the various conditions. This fraction (f HAGB) is calculated and averaged for different scans in each sample condition and is summarized in Table II. When we plot the HAGB fraction (f HAGB) as a function of the recrystallized fraction (f rec) in Fig. 8, we note a monotonic increase. This indicates that as the recrystallization fraction increases, the resulting regions are likely to be predominantly surrounded by HAGB. This apparently smooth trend across the various thermomechanical conditions further implicates an underlying mechanism that involves a more continuous microstructure transformation akin to that identified with CDRX.Reference Humphreys and Hatherly10 Note that although the microstructural transformation for 0H appears to be smooth and in line with other thermomechanical conditions in Fig. 8, it has an associated spike/jump in Fig. 7, which illustrates f rec versus strain. Specifically, it is shown (Fig. 7) that the 0H microstructure has the highest value of recrystallization fraction in spite of having a mediocre strain level when compared with other thermomechanical conditions. This aspect of 0H sample coincides with our earlier hypothesis of it being a result of rampant DDRX under the high temperature deformation conditions. Taken together, it appears that a majority of the samples appear to undergo a continuous transformation and accumulation of recrystallized regions as a function of the deformation, until high temperature is introduced (0H sample), where DDRX appears predominant. This conclusion is somewhat analogous to that in a related study of recrystallization of copper deformed to moderate strain (γ ≈ 3−4) at high strain rate (104/s), which partly coincide with the conditions examined here.Reference Andrade, Meyers, Vecchio and Chokshi13
Correlation between the recrystallized fraction and the HAGB fraction for different sample conditions as listed in Table I.

D. Geometric dynamic recrystallization advances (onset of GDRX)
An important attribute distinguishing CDRX and DDRX is the difference in the evolution of the textures following their progression. DDRX is characterized by a strong deformation texture transformation, while in CDRX, the texture change is gradual in general and is often retained.Reference Engler and Huh65,Reference Jazaeri and Humphreys66 Detailed texture analysis of the samples from LSM is ongoing to provide further validation to the ideas introduced here.Reference Humphreys and Hatherly10,Reference Ahlborn, Hornbogen and Koster67 Two overarching classes of CDRX have been considered.Reference Humphreys and Hatherly10 One is as geometric dynamic recrystallization (GDRX) and the other process involves formation of new grains with high angle boundaries by gradual rotation of subgrains with little accompanying boundary migration—i.e., rotational recrystallization that has been recognized in geological minerals and in metals, such as magnesium and aluminum alloys.Reference Humphreys and Hatherly10
GDRX occurs during deformation involving elevated temperatures and typically proceeds in a manner as shown in the insets (a), (b), and (c) in Fig. 7.Reference Humphreys and Hatherly10 During deformation, the original grains usually become increasingly thin and flattened [Fig. 7, inset (a)]. The progressive flattening/pancaking or the original grain boundaries leads to a decreased thickness with increasing strain values. However, with interplay of dynamic recovery involving losses of dislocation densities, the boundary tensions of the intermediary subgrain walls that coax local grain boundary migration can lead to a simultaneous serration of these grain boundaries.Reference Humphreys and Hatherly10 Note that as the deformation progresses, the original HAGBs that are now serrated and depicted by thick lines in Fig. 7, inset (b), become closer. However, the subgrain sizes shown by thinner gray lines that evolve in response to the thermomechanical conditions remain characteristically constant in size.Reference Humphreys and Hatherly10 Eventually, the serrated HAGB’s impinge on each other and lead to the creation of a microstructure composed increasingly of high angle boundaries [Fig. 7, inset (c)]. In effect, the grains will pinch into new smaller grains as depicted in Fig. 7. Another characteristic of this mechanism is that because the wave length of the serrations are comparable with the intervening subgrain structure, the DRX grains composed of HAGB, resulting from “pinching-off” of the original grain, are essentially of a size that is comparable with the subgrain size.Reference Humphreys and Hatherly10
This mechanism of GDRX will be dependent on the initial grain size (δ0) in addition to the deformation parameters. It has been argued as the necessary condition for the GDRXReference Humphreys and Hatherly10 that the grain impingement occurs when the subgrain size (δ) is equal to the width of the grain. Therefore, the critical strain (εcr) for the process is in this form:
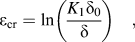 $${\varepsilon _{\rm{cr}}} = \ln \left( {{{{K_1}{\delta _0}} \over \delta }} \right)\quad ,$$
where K 1 is a constant. It has been argued in Ref. Reference Humphreys and Hatherly10, using the relationship between the flow stress, the Zener–Hollomon parameter (Z), subgrain size and Eq. (3) that the critical strain for onset of GDRX is:
 $${\varepsilon _{\rm{cr}}} = \ln \left( {{z^{{1 \over m}}}{\delta _0}} \right) + {K_3}\quad {\rm{,}}$$
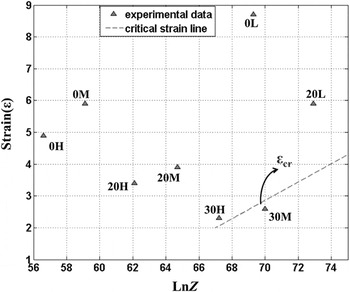
where m and K 3 are constants. Noting the linearity of the relationship between the critical strain and lnZ, it is useful to investigate the overlap of this criterion with the empirical data in this study by examining the results as a function of the strain (ε) at which they were created and the lnZ value corresponding to that in the deformation zone (Table I). Unfortunately, the constants for Cu in the deformation regime characterized by LSM are unavailable. Therefore, we sought to utilize our empirical data to identify these constants that characterize the existing GDRX modeling framework. Figure 9 illustrates the thermomechanical conditions corresponding to the various experimental parameters on a space with the x-axis as lnZ and the effective strain (ε) as the y-axis. Table II reveals that among the various samples, the 30M and 30H samples are characterized by the lowest fractions of recrystallization (f rec) values determined using OIM. The neighboring 20M and 20L samples are characterized by substantially greater f rec values. Therefore, we take the 30M and 30H samples to form the critical threshold for GDRX and use the thermomechanical conditions associated with these samples in Eq. (4) to back calculate the parameter m to be 3.47 and K 3 as −7.4. The line corresponding to this critical threshold, i.e., Eq. (4), is then plotted in Fig. 9. Also, note that to enable this analysis, the original grain size (δ0) needs to be determined. Here, we measured the initial grain size using Heyn intercept methodReference Abrams68 applied to images obtained from OM of machined copper samples being polished and then etched from which the value is obtained as 50 µm. Thus, Eq. (4) can be written as εcr = ln(Z 1/3.47 0.00005) − 7.4 and accordingly the critical strains for sample conditions are listed in Table I.
Critical strain [Eq. (4)] for the onset of GDRX shown on ε-lnZ space with the experimental conditions overlaid.Reference Shekhar, Cai, Basu, Abolghasem and Shankar56

The fidelity of the framework for identifying the threshold for GDRX can be improved using models for subgrain sizes resulting from LSM-relevant deformation conditions. One such a model is proposed in our earlier studyReference Abolghasem, Basu, Shekhar, Cai and Shankar45 which encapsulated the variation of subgrain sizes (δ) as a function of the effective strain (ε) and the parameter called “R” defined asReference Abolghasem, Basu, Shekhar, Cai and Shankar45:
 $$R = \left( {{{G{b^3}} \over {kT}} + {\rm{\eta }}} \right)\left( {{1 \over {{\rm{ln}}{C_1} + {\rm{ln}}Z}}} \right)\quad {\rm{,}}$$
where b is the Burgers vector (0.256 nm for Cu),Reference Nes48G is the shear modulus = 47 GPa,Reference Nes48 η = 190.43 is a correction factor, and lnC 1 = 14.77 (see Ref. Reference Abolghasem, Basu, Shekhar, Cai and Shankar45 for more details). The R values for the various conditions are shown in Table I. For Cu, across the LSM-relevant conditions, it was shown that the subgrain size varies as δ = 0.25 − 0.030ε + 0.058R + 0.0003εR.Reference Abolghasem, Basu, Shekhar, Cai and Shankar45 The knowledge of this functional variation offers a direct route for defining the criterion for onset of GDRX using Eq. (3):
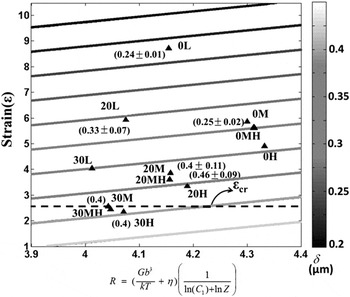
 $${{\rm{\varepsilon }}_{{\rm{cr}}}} = {\rm{ln}}\left( {{{K_{\rm{1}}^\prime {{\rm{\delta }}_0}} \over {0.25 - 0.030{{\rm{\varepsilon }}_{{\rm{cr}}}} + 0.058R + 0.0003{{\rm{\varepsilon }}_{{\rm{cr}}}}R}}} \right)\quad ,$$
where  $K_{\rm{1}}^\prime$ is considered as a constant here to avoid confusion from Eq. (3). Equation (6) of course is an implicit equation, and by assuming that the 30M sample is the condition that is the threshold for the onset of GDRX, we obtain
 $K_{\rm{1}}^\prime = 0.11$. Then, the critical strains for the onset of GDRX were calculated for various deformation strain rates and temperatures using the corresponding R values (Table I). Note that Eq. (6) required fitting for only
 $K_{\rm{1}}^\prime$, unlike the adaptation of existing GDRX model from Ref. Reference Humphreys and Hatherly10. In our approach, R can be thought to become a more empirically validated analogue of lnZ (the merits of both parameters are discussed in detail in Refs. Reference Abolghasem, Basu, Shekhar, Cai and Shankar45 and Reference Shekhar, Cai, Basu, Abolghasem and Shankar56). Also comparing the variation of R values to lnZ, we notice that the parameter R shows a very weak sensitivity to changes in thermomechanical conditions in the GDRX context as well while lnZ values varies more strongly across the conditions considered here.
The critical strains using R values from Table I are used to delineate the line on a ε-R space in Fig. 10 onto which the experimental data of subgrain sizes from our recent investigationReference Abolghasem, Basu, Shekhar, Cai and Shankar45 are also overlaid. Comparing Figs. 9 and 10, we notice that both criteria appear fairly consistent in terms of determining the criterion for GDRX among the examined sample conditions. The second derivation is based on our subgrain size model, while that in Fig. 9, is obtained from a more traditional approach to examining hot deformation. We also sought to encapsulate the variation of the recrystallization fraction (Table II) in relation to the threshold for GDRX on the ε-R space, which essentially captures the extent of progression of the formation of the low GOS, HAGB-dominated defect-free structures among the deformed matrix. We find that Eq. (7) with coefficient of determination of R 2 = 0.913 offers a good approximation of the variation of the recrystallization fraction across the range of thermomechanical conditions here:
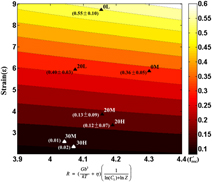
 $$f_{{\rm{rec}}}^\prime = 0.05\,\,{R^{1.498}}\left( {\exp \left( {0.095\,\,{\rm{\varepsilon }}} \right) - 1} \right\quad {\rm{.}}$$
Critical strain for onset of GDRX evaluated using Eq. (6) shown on strain (ε)-R space with the experimental data overlaid.Reference Abolghasem, Basu, Shekhar, Cai and Shankar45 Average subgrain sizes along with their standard deviation for the experimental conditions are marked beside the data points.

The recrystallization fraction calculated using this equation  $\left( {f_{{\rm{rec}}}^\prime } \right)$ is listed in Table II which except for low strain conditions (specially 30M and 30H) has a close correspondence with the empirically measured values (note that we have excluded the 0H sample in this approximation because of our expectation that it is a product of DDRX under the substantially elevated deformation temperatures associated with its formation). The contour map corresponding to Eq. (7) is illustrated in Fig. 11, and the experimental measurements are overlaid along with the standard deviation in parenthesis. This equation provides an empirical fit, whose choice is driven by the consideration that at a constant temperature, we expect the fraction to increase with strain and equate to zero when there is no deformation
 $\left( {{{\left. {f_{{\rm{rec}}}^\prime } \right|}_{{\rm{\varepsilon }} = 0}} = 0} \right)$. Complementing this is the interactive effects of temperature and the strain rate that are coupled via the parameter R, where R usually increases with increasing temperature for the range of deformation conditions here. We expect the recrystallization fraction to increase as the temperature increases, which is captured via a power-law fit in Eq. (7).
Contour map of the recrystallization fraction ( $f_{{\rm{rec}}}^\prime$) as a function of effective strain (ε) and R. Values of average recrystallization fraction and its standard deviation from experimental conditions are marked on the plot, and at each experimental point, the mean measured f rec + standard deviation and f rec—standard deviation are shown.

IV. CONCLUSIONS
LSM was utilized as a test of microstructure response in Cu under deformation conditions characterized by severe shear strains (1–10), strain rates (10–103/s), and thermomechanically coupled temperatures ranging from ambient to ∼470 K. Since the deformation zone in LSM is not occluded, an in situ characterization of the deformation field was performed using high-speed DIC and IR thermography. The resulting “chip” material that was created under the characterized severe shear conditions was examined via OIM using EBSD in a SEM. An examination of the GOS revealed a continuum of microstructures across the deformation conditions examined here, with the exception of a sample that involved a deformation temperature of ∼485 K. This outlier sample was characterized by rampant recrystallization, a fully coarsened microscale grain structure and a low hardness value that indicated a completion of discontinuous dynamic recrystallization, and a complete loss of ultrafine grains. Nonetheless, this sample provides a threshold of the GOS that characterizes a nearly dislocation-free recrystallized structure, which was then used to segregate the microstructure scans and to calculate the fraction of recrystallized grains in the other deformation conditions. As expected, we find a correlation between the area fraction of the recrystallized portions of the microstructure and the deformation strains for all samples created at temperatures <485 K. Furthermore, for these samples a correlation is found between the fraction of recrystallization and the fraction of high angle boundaries. Noting the gradual evolution of microstructures across these samples, we hypothesize the role of geometric dynamic recrystallization (GDRX) as a mechanism that determines the formation of the recrystallized fractions. At 485 K, however, the sufficient mobility likely allowed for the discontinuous dynamic recrystallization via the migration of the grain boundaries. We propose a model for the onset of GDRX using a model for subgrain sizes for these deformation conditions that are shown to be in reasonable agreement with earlier models for GDRX that utilizes a Zener–Hollomon parameter-based approach. By mapping the onset and progression of dynamic recrystallization on a map space parameterized as a function of the thermomechanics of severe shear, this approach may help design and control microstructures resulting from shear-based metal cutting and surface generation processes that are the mainstay of the manufacture of metallic components, including in milling, drilling, turning, shaping, etc.
ACKNOWLEDGMENTS
Support from the National Science Foundation (Grant Nos. 0927410 and 0856626) is gratefully acknowledged. The authors are also grateful to the anonymous reviewers, whose thorough reviews helped improve the paper and the analysis.