





Introduction
Learning from social feedback is a vital cognitive process enabling individuals to adjust their behavior based on social cues, such as praise and criticism (Bauer, Reference Bauer1967). This mechanism is crucial for navigating complex social environments, maintaining relationships, and shaping one’s self-concept (Boyd, Richerson, & Henrich, Reference Boyd, Richerson and Henrich2011; Button, Browning, Munafò, & Lewis, Reference Button, Browning, Munafò and Lewis2012; Elder, Davis, & Hughes, Reference Elder, Davis and Hughes2022; FeldmanHall & Chang, Reference FeldmanHall, Chang, Morris, Bornstein and Shenhav2018; Kendal & Watson, Reference Kendal, Watson, Tehrani, Kendal and Kendal2023; Olsson, Knapska, & Lindström, Reference Olsson, Knapska and Lindström2020; Peters et al., Reference Peters, Helming, Bruchmann, Wiegandt, Straube and Schindler2024; Schröder et al., Reference Schröder, Czekalla, Mayer, Zhang, Stolz, Korn, Diekelmann, Luebber, Paulus, Müller-Pinzler and Krach2025). In the form of social evaluative feedback, individuals update beliefs about the self and others (Behrens, Hunt, Woolrich, & Rushworth, Reference Behrens, Hunt, Woolrich and Rushworth2008; Diaconescu et al., Reference Diaconescu, Mathys, Weber, Daunizeau, Kasper, Lomakina, Fehr and Stephan2014) from external judgments or feedback which can differ in valence and expectancy (Peters et al., Reference Peters, Helming, Bruchmann, Wiegandt, Straube and Schindler2024). Social learning can be formally investigated using the framework of reinforcement learning (RL) (Sutton & Barto, Reference Sutton and Barto2018; Zhang & Gläscher, Reference Zhang and Gläscher2020), a form of error-based learning driven by differences between actual and expected outcomes (i.e. prediction error). Application of the RL framework has revealed distinct biases in social feedback learning in several psychiatric disorders.
Yet, in the context of social feedback learning, existing research has primarily taken a categorical approach often focusing on a single disorder or trait. For example, individuals with social anxiety (Beltzer, Adams, Beling, & Teachman, Reference Beltzer, Adams, Beling and Teachman2019; Beltzer, Daniel, Daros, & Teachman, Reference Beltzer, Daniel, Daros and Teachman2023; Button et al., Reference Button, Browning, Munafò and Lewis2012; Hopkins, Dolan, Button, & Moutoussis, Reference Hopkins, Dolan, Button and Moutoussis2021; Koban et al., Reference Koban, Schneider, Ashar, Andrews-Hanna, Landy, Moscovitch, Wager and Arch2017, Reference Koban, Andrews-Hanna, Ives, Wager and Arch2023; Müller-Pinzler et al., Reference Müller-Pinzler, Czekalla, Mayer, Stolz, Gazzola, Keysers, Paulus and Krach2019; Zabag, Gilboa-Schechtman, & Levy-Gigi, Reference Zabag, Gilboa-Schechtman and Levy-Gigi2022; Zabag et al., Reference Zabag, Rinck, Becker, Gilboa-Schechtman and Levy-Gigi2024) and borderline personality disorder (BPD) (Gregorová, Eldar, Deserno, & Reiter, Reference Gregorová, Eldar, Deserno and Reiter2024; Korn, La Rosée, Heekeren, & Roepke, Reference Korn, La Rosée, Heekeren and Roepke2016) are biased toward learning more strongly from negative social feedback, whilst depressed individuals conversely do not update their beliefs more strongly following positive compared to negative social feedback (Hobbs et al., Reference Hobbs, Vozarova, Sabharwal, Shah and Button2022; Hoffmann, Hobbs, Moutoussis, & Button, Reference Hoffmann, Hobbs, Moutoussis and Button2024). Narcissistic traits bias perceptions toward evaluators that provide negative feedback about them (Kernis & Sun, Reference Kernis and Sun1994; Smalley & Stake, Reference Smalley and Stake1996), and individuals with Autism Spectrum Disorder (ASD) demonstrate lowered learning rates and accuracy when learning about others (Cahalan et al., Reference Cahalan, Perla, Block, Loughlin, Korn and Rosenblau2026; Schuetze et al., Reference Schuetze, Rohr, Dewey, McCrimmon and Bray2017). Additionally, the social dimension of apathy has recently been highlighted (Zhao et al., Reference Zhao, Ye, Tang, Attaallah, Toniolo, Saleh, Rouse, Garrard, Broulidakis, Thompson, Manohar, Irani, Ang, Lockwood, Apps, Hu, Wang, Rowe, Le Heron and Husain2026), yet whether social learning is attenuated among apathetic individuals remains underexplored.
Compared to categorical assessments, a transdiagnostic approach to psychopathology (Gillan et al., Reference Gillan, Kosinski, Whelan, Phelps and Daw2016; Insel et al., Reference Insel, Cuthbert, Garvey, Heinssen, Pine, Quinn, Sanislow and Wang2010; Robbins et al., Reference Robbins, Gillan, Smith, Wit and Ersche2012; Tanaka, Reference Tanaka2024) focuses on dimensional traits that cut across multiple disorders. Latent psychological and cognitive constructs or factors of mental health can be extracted that more accurately map onto candidate cognitive processes (Gillan & Seow, Reference Gillan and Seow2020). This approach can further be combined with the theory-driven computational modeling of behavior (Sohail & Zhang, Reference Sohail and Zhang2024; Zhang, Reference Zhang2023) to infer the construct-specific computational processes that characterize a given factor (Wise, Robinson, & Gillan, Reference Wise, Robinson and Gillan2023). Combining transdiagnostic assessments of psychopathology with computational models have identified the specific cognitive processes underlying altered behavior in mental health disorders, including model-based planning (Gillan et al., Reference Gillan, Kosinski, Whelan, Phelps and Daw2016), metacognition (Rouault, Seow, Gillan, & Fleming, Reference Rouault, Seow, Gillan and Fleming2018), reward processing (Suzuki, Yamashita, & Katahira, Reference Suzuki, Yamashita and Katahira2021), and uncertainty (Norbury, Robbins, & Seymour, Reference Norbury, Robbins and Seymour2018). However, a transdiagnostic account of how these traits may differentially influence learning from social feedback is currently not known.
To bridge these research gaps, we used the Social Evaluation Learning Task (SELT) (Button et al., Reference Button, Browning, Munafò and Lewis2012, Reference Button, Kounali, Stapinski, Rapee, Lewis and Munafò2015), a well-established paradigm to test participants’ learning through valenced social feedback. We adopted a transdiagnostic approach in a non-clinical sample, assessing relevant domains of psychopathology known to affect social behavior, including autism, social anxiety, depression, apathy, narcissism, and Borderline Personality Disorder (BPD). We anticipated transdiagnostic factors reflecting social engagement and mood to be extracted from our questionnaire battery (Gillan et al., Reference Gillan, Kosinski, Whelan, Phelps and Daw2016; Oka, Sasaki, & Kobayashi, Reference Oka, Sasaki and Kobayashi2025; Schafer & Schiller, Reference Schafer and Schiller2025). We also hypothesized these factors to differentially moderate social learning effects. Specifically, we expected for social engagement to negatively correlate with a negative learning bias, and for a depressive-mood factor to positively correlate with reduced learning from positive feedback (Button et al., Reference Button, Browning, Munafò and Lewis2012; Hoffmann et al., Reference Hoffmann, Hobbs, Moutoussis and Button2024; Hopkins et al., Reference Hopkins, Dolan, Button and Moutoussis2021). This study ultimately provides a nuanced understanding of how overlapping psychiatric traits relate to the ability to learn from social feedback.
Methods
Participants
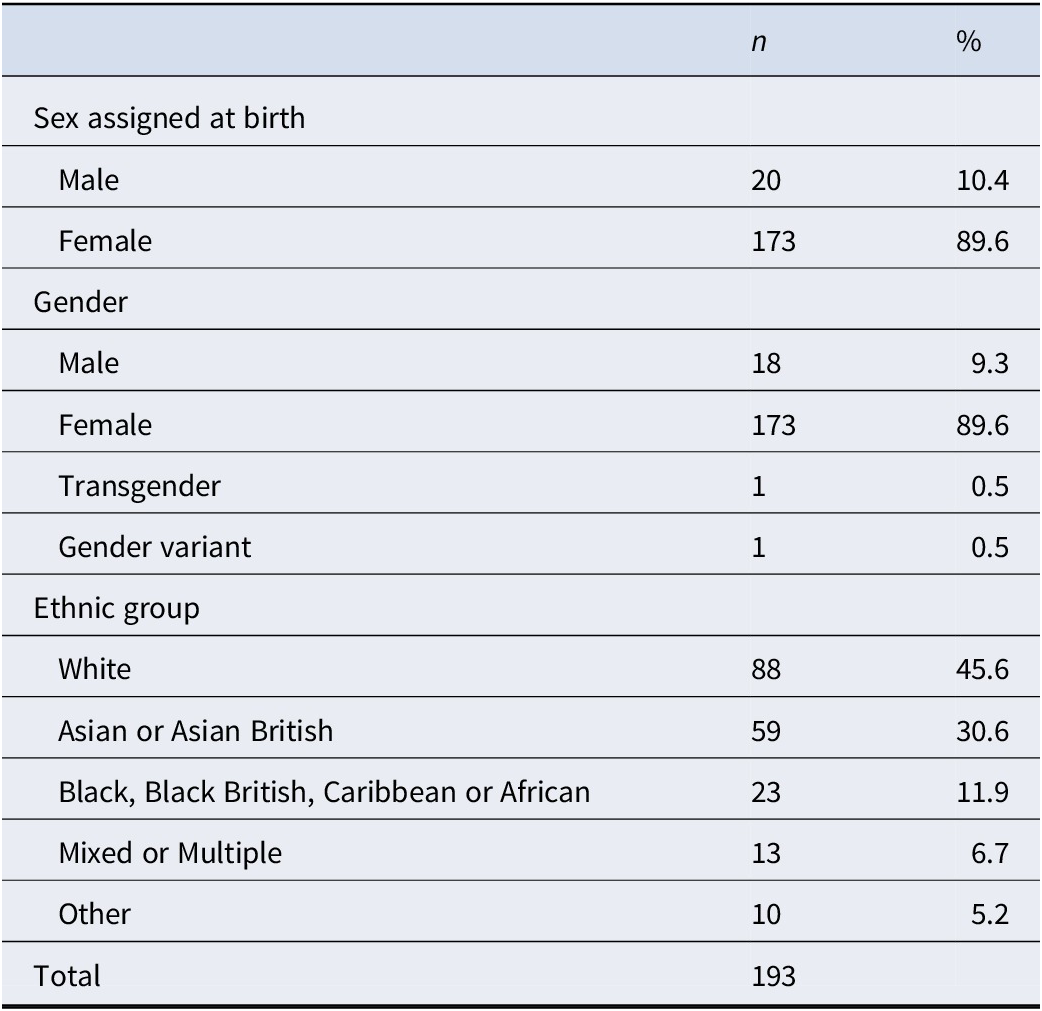
A priori sample size estimation using G*Power 3 software (Faul, Erdfelder, Lang, & Buchner, Reference Faul, Erdfelder, Lang and Buchner2007) suggested a sample of 191 would be needed to detect a small effect size (f = 0.20) with 80% power and α = .05 for a repeated-measures ANOVA. Participants were eligible for the study if they were 18-to-25 years old, proficient in English, and had no history of brain trauma, cognitive impairment, neurological conditions, or psychological disorders. Participants were recruited using the University of Birmingham Research Participation Scheme (Sona Systems®) and flyers on campus and were tested online using the online experiment platform Gorilla (http://www.gorilla.sc) (Anwyl-Irvine et al., Reference Anwyl-Irvine, Massonnié, Flitton, Kirkham and Evershed2020). Participants received one credit point for completing the study. Data collection comprised 198 participants, which after excluding five participants who failed attention checks, resulted in a final sample (Table 1) of 193 participants (female = 173; age = 19.4 ± 2.0). All participants provided informed consent prior to participation, and the study was approved by the University of Birmingham Research Ethics Committee (ERN_20-1897AP15).
Participant demographics for the study

Table 1. Long description
The table consists of three columns: Category, n (count), and percentage.
Sex assigned at birth:
* Male: 20 (10.4 percent)
* Female: 173 (89.6 percent)
Gender:
* Male: 18 (9.3 percent)
* Female: 173 (89.6 percent)
* Transgender: 1 (0.5 percent)
* Gender variant: 1 (0.5 percent)
Ethnic group:
* White: 88 (45.6 percent)
* Asian or Asian British: 59 (30.6 percent)
* Black, Black British, Caribbean or African: 23 (11.9 percent)
* Mixed or Multiple: 13 (6.7 percent)
* Other: 10 (5.2 percent)
The total number of participants is 193.
Note: Demographic characteristics of the study participants, including group sizes (n) and percentages (%) for sex assigned at birth, gender identity, and ethnic group.
Measures
Social evaluation learning task
Participants completed the adapted SELT (Button et al., Reference Button, Browning, Munafò and Lewis2012, Reference Button, Kounali, Stapinski, Rapee, Lewis and Munafò2015). Here, we included three self-referential blocks, each with a computer profile (i.e. persona) that participants had to learn either liked, disliked, or was neutral toward the participants (Figure 1a). Each persona followed a unique feedback contingency for the word pair: the positive word was the correct choice 80% of the time for the ‘Like’ persona, 20% for the ‘Dislike’ persona, and 50% for the ‘Neutral’ persona, whereas the negative word was the correct choice 20% of the time for the ‘Like’ persona, 80% for the ‘Dislike’ persona, and 50% for the ‘Neutral’ persona. The feedback contingencies were not communicated to the participants; instead, the participants needed to work these out using trial and error. In each trial, participants were presented with the sentence ‘I think you are…’ and a positive/negative word pair randomly selected from a list of 64 pairs (e.g. selfish vs. generous). Participants firstly made a choice between the words, with no enforced time limit, followed by feedback on correctness (500 ms) before a fixation cross (400 ms). Each block consisted of 32 trials, with the order of the three blocks randomized and counterbalanced across participants. The placement of the two words on the screen was counterbalanced across trials to avoid motor habituation. At the end of each block, participants were asked to rate how much the persona liked them on a scale from 0 (‘Dislike’) to 100 (‘Like’).
The Social Evaluation Learning Task and behavioral results. (a) Participants were instructed to learn about the computer persona’s perspective of themselves, which differs in the probability of positive/negative words being the correct choice. Feedback on correctness was provided after each trial. At the end of each block, participants were asked to provide a single rating on how much the persona disliked them using a Likert scale from 0 (Dislike) to 100 (Like). Feedback valence demonstrated a significant effect upon all conditions with choice accuracy (b), and final ratings (c), and between Neutral and Dislike conditions for decision time (d). ** p < 0.01, *** p < 0.001, n.s. = not significant.

Figure 1. Long description
Panel a shows a task flowchart with five sequential screens. 1. Introduction: A persona named Alex introduces themselves. 2. Choice: The participant chooses between two words, such as Selfish or Generous, with no time limit. 3. Feedback: A green checkmark appears for 500 m s. 4. Fixation: A crosshair appears for 400 m s. A curved arrow labeled x 32 indicates this loop repeats. 5. Rating: A Likert scale from Dislike to Like with no time limit.
Panels b, c, and d are bar graphs with individual data points and distribution clouds for Like (blue), Dislike (red), and Neutral (green) conditions.
Panel b, Accuracy (percentage): The y-axis ranges from 0 to 100. Like is highest at approximately 80 percent, Dislike is slightly lower at 75 percent, and Neutral is lowest at 50 percent. Significant differences (three asterisks) are shown between all pairs.
Panel c, Rating: The y-axis ranges from 0 to 100. Like is highest (approximately 68), Neutral is middle (approximately 40), and Dislike is lowest (approximately 20). Significant differences (three asterisks) are shown between all pairs.
Panel d, Decision Time (m s): The y-axis ranges from 0 to 3000. Like and Dislike are similar at approximately 1600 m s, while Neutral is slightly higher at 1700 m s. A significant difference (two asterisks) exists only between Dislike and Neutral; others are marked n. s. for not significant.
Questionnaires
Immediately following the behavioral task, participants completed six self-report questionnaires selected a priori to assess their transdiagnostic relationship with social feedback learning, namely the Autism Spectrum Quotient (AQ-10) (Allison, Auyeung, & Baron-Cohen, Reference Allison, Auyeung and Baron-Cohen2012), Social Phobia Inventory (SPIN) (Connor et al., Reference Connor, Davidson, Churchill, Sherwood, Weisler and Foa2000), Beck Depression Inventory (BDI-II) (Beck, Steer, Ball, & Ranieri, Reference Beck, Steer, Ball and Ranieri1996), Apathy Motivation Index (AMI) (Ang et al., Reference Ang, Lockwood, Apps, Muhammed and Husain2017), Narcissistic Admiration and Rivalry Questionnaire (NARQ) (Back et al., Reference Back, Küfner, Dufner, Gerlach, Rauthmann and Denissen2013), and BPD checklist (First et al., Reference First, Gibbon, Spitzer, Williams and Benjamin1997).
Data analysis approach
Behavioral measures
Behavioral data after quality check and cleaning were used to test our hypotheses (4.25% of all trials were excluded; Supplementary Table S1). Three dependent variables were selected as indicators of task behavior: choice accuracy, decision time (DT), and end-of-block persona rating. Choice accuracy was defined as selecting the word whose valence was associated with the feedback contingency; positive words for the ‘Like’ condition, negative words for the ‘Dislike’ condition. For the neutral condition, there was no correct response. We coded the ‘Like’ option as correct response (‘Dislike’ would reveal same results) to enable joint analysis of all conditions. Raw untransformed DT were used for repeated-measures ANOVA, as subject-level mean DTs were normally distributed across all conditions (Shapiro–Wilk tests: W > 0.985; skewness = 0.09–0.24). For trial-level mixed-effects models, we used log-transformed DT values.
Computational modeling framework
The RL framework was applied to quantify the computational processes underlying task behavior. Considering that participants may learn differently from positive versus negative social feedback (Zhang et al., Reference Zhang, Lengersdorff, Mikus, Gläscher and Lamm2020), we tested an RL model (against the simple Rescorla-Wagner model, Rescorla & Wagner, Reference Rescorla and Wagner1972) with two distinct learning rates (α + and α −) for positive and negative prediction errors (PEs) – the difference between the received outcome (O, coded as −1 and 1) and the value (V, initialized at zero) for each trial (t):

As participants preferentially chose the positive option in their initial choice across blocks (see Supplementary Information and Supplementary Figure S3), we additionally introduced variants of both models with a subject-level scalar parameter representing an initial-value difference to capture this bias.
For all models, a softmax choice function was employed to compute the action probability given action values, where the probability of choosing the positive word over the negative word (coding: positive = 1, word = 2) was defined as:

where the inverse temperature (β > 0) regulates the stochasticity of how value computation influences choice.
The model space ultimately consisted of four models: single learning rate with no initial-value bias, dual learning rate with no initial-value bias, single learning rate with initial-value bias, and dual learning rate with initial-value bias. For the initial-value bias models, the softmax β was not enforced on the first trial of each block for identifiability reasons. Model estimation was conducted under the hierarchical Bayesian framework (Sohail & Zhang, Reference Sohail and Zhang2025a) using the {rstan} (Carpenter et al., Reference Carpenter, Gelman, Hoffman, Lee, Goodrich, Betancourt and Riddell2017), and {hBayesDM} (Ahn, Haines, & Zhang, Reference Ahn, Haines and Zhang2017) R packages. Four Markov Chain Monte Carlo (MCMC) chains with a minimum of 1000 post-warmup iterations per chain were used. R-hat values for all parameters were below 1.02, indicating excellent model convergence (Gelman & Rubin, Reference Gelman and Rubin1992). Model comparison was conducted by computing the leave-one-out information criterion (LOOIC) using the {loo} package (Vehtari, Gelman, & Gabry, Reference Vehtari, Gelman and Gabry2017), which balanced model fit and complexity. Lower LOOIC scores signified superior model performance, and the model with the lowest LOOIC was chosen for further analyses.
Transdiagnostic analyses
An exploratory factor analysis was conducted to identify transdiagnostic factors across the six psychiatric questionnaires used. To account for mixed item types (binary and ordinal), polychoric correlations were computed using the {polycor} package. Factor analysis was performed using the ‘fa’ function from the {psych} package in R with maximum likelihood estimation and oblique (oblimin) rotation (Costello & Osborne, Reference Costello and Osborne2005). Eighty of the eighty-two items (two removed due to zero-variance) across the six questionnaires were included. A Cattell-Nelson-Gorsuch test was used through the {nFactors} package to determine the optimal number of factors. Factor loadings ≥0.3 were deemed interpretable. Factor scores were calculated using regression scoring weights and standardized for subsequent analyses.
To uncover transdiagnostic influences on behavioral and computational outcomes, we fit Bayesian mixed-effects regressions with transdiagnostic factor scores, task condition, and their interactions as predictors; a logistic (Bernoulli) model for choice accuracy, and Gaussian models for log-transformed DTs and end-of-block rating. These analyses implemented the three-way model structure:

with random intercepts and by-participant random slopes of condition. Each computational parameter was modelled by task condition and factor scores:

with random intercepts for each participant, for the positive learning rate (α +), negative learning rate (α −), their difference (α + − α −), and inverse temperature (τ). The shared-scalar initial-value bias (initV), being a single value per subject, was modelled at the subject level with no random-effects term:

All Bayesian regression models were fit with the {brms} package v2.23.1 (Bürkner, Reference Bürkner2017) in R v4.4.1. We reported the 89% credible interval for posterior inferences (Kreis, Zhang, Moritz, & Pfuhl, Reference Kreis, Zhang, Moritz and Pfuhl2022; Kreis et al., Reference Kreis, Zhang, Mittner, Syla, Lamm and Pfuhl2023; see Supplementary Information for details).
Results
Results Social feedback valence drives behavioral performance
To test whether feedback valence affected learning accuracy, we examined choice accuracy across the three persona conditions. One-way repeated measures ANOVA revealed a significant main effect of condition on choice accuracy (F
(2, 384) = 208.41, p < .001,
$ {\eta}_p^2 $
 = 0.52). Post-hoc comparisons with Tukey corrections showed that the accuracy was the highest in the ‘Like’ condition (M = 80.6 ± 14.7%), followed by those from the ‘Dislike’ (M = 75.9 ± 15.6%) and ‘Neutral’ (M = 51.6 ± 18.1%) conditions (Figure 1b; Like versus Neutral: t
(192) = 17.259, p < 0.001, Dislike versus Neutral: t
(192) = 14.597, p < 0.001, Like versus Dislike: t
(192) = 3.982, p < 0.001).
Next, we examined whether participants learned each persona’s evaluation toward themselves at the end of the block. After applying a one-way repeated measures ANOVA on end-of-block ratings revealed a significant effect of condition on ratings (F
(1.85, 354.82) = 331.93, p < .001,
$ {\eta}_p^2 $
 = 0.634; Greenhouse–Geisser corrected, ε = 0.924, due to a sphericity violation, W = 0.918, p < .001). Post-hoc Tukey-corrected pairwise comparisons demonstrated significant differences between all conditions (all p < .001) (Figure 1c).
Finally, we examined whether feedback valence influenced DTs across persona conditions. A one-way repeated measures ANOVA showed a significant effect of condition on DT (F (2,384) = 4.18, p = 0.016), with post-hoc Tukey-corrected comparisons showing that participants responded significantly faster in the ‘Dislike’ (M = 1604 ± 476 ms) condition compared to ‘Neutral’ (M = 1698 ± 529 ms) (p = 0.009), while other pairwise comparisons were not significant (‘Like’ condition: M = 1667 ± 466 ms, Figure 1d).
Distinct learning rates for positive and negative feedback underlie social evaluative learning
To determine whether participants exhibited asymmetric learning from positive versus negative feedback, we compared the four computational models crossing the learning-rate structure with the initial-value bias. Model comparison revealed that the dual-learning-rate model with the shared initial-value bias provided the best overall fit, outperforming the next-best model (ΔLOOIC = 18.4; Supplementary Table S2), confirming that participants processed positive and negative social feedback differently. Parameters from the winning model showed good-to-excellent recovery, and posterior predictive checks broadly captured the key patterns in our behavioral data (see Supplementary Figures S1 and S2).
Next, we tested whether learning rates varied as a function of feedback valence and persona condition. A learning-rate valence (positive vs negative) by condition (Like, Dislike, and Neutral) repeated-measures ANOVA (Greenhouse–Geisser corrected) revealed a significant main effect of learning-rate valence (F (1,192) = 465.51, p < 0.001) and condition (F (1.27, 243.94) = 52.27, p < 0.001) and a significant interaction (F (1.27, 243.82) = 111.26, p < 0.001), indicating that the relationship between feedback valence and learning varied across conditions (Figure 2a). Post-hoc pairwise comparisons using Tukey’s adjustment showed that the positive learning rate was significantly higher in both the ‘Like’ and ‘Dislike’ conditions than in ‘Neutral’ (both p < 0.001), but did not differ between ‘Like’ and ‘Dislike’ (t (192) = 1.83, p = 0.162). For negative learning rates, the ‘Like’ condition showed significantly lower learning rates than both ‘Neutral’ (t (192) = 5.40, p < 0.001) and ‘Dislike’ (t (192) = 5.26, p < 0.001), which did not significantly differ from each other (t (192) = 1.82, p = 0.166).
Parameter estimates from the winning model and associations with behavior. (a) Individual posterior parameter estimates for the positive and negative learning rates and the inverse temperature (τ) from the winning model. Black points indicate group means with error bars representing standard error of the mean. (b) Positive learning rate significantly correlated with choice accuracy in the Like condition. (c) Positive learning bias (α + − α −) significantly correlated with choice accuracy in the Like condition. (d) Correlations between mean Vpositive and subject ratings for each feedback condition. Each point represents a single participant. Shaded regions represent 95% confidence intervals. *** p < 0.001, n.s. = not significant.

Figure 2. Long description
The figure consists of four main sections.
Panel a contains three dot plots showing parameter estimates on the y-axis against feedback conditions Like, Dislike, and Neutral on the x-axis. The first plot for Positive Learning Rate alpha super plus shows higher values for Like and Dislike compared to Neutral. The second plot for Negative Learning Rate alpha super minus shows higher values for Dislike and Neutral compared to Like. The third plot for Inverse Temperature tau shows higher values for Like and Dislike compared to Neutral. Black dots with error bars indicate group means and S E M.
Panel b is a scatter plot showing a positive linear correlation between Positive Learning Rate alpha super plus on the x-axis and Choice Accuracy on the y-axis.
Panel c is a scatter plot showing a positive linear correlation between Positive Learning Bias alpha super plus minus alpha super minus on the x-axis and Choice Accuracy on the y-axis.
Panel d contains three scatter plots showing the relationship between Mean V super positive on the x-axis and Rating on the y-axis. The Like condition shows a strong positive linear trend. The Dislike condition shows a flat, non-significant trend. The Neutral condition shows a moderate positive linear trend. All scatter plots include a regression line with a shaded 95 percent confidence interval.
We similarly examined whether choice stochasticity, indexed by the inverse temperature (τ), varied across conditions. A one-way repeated-measures ANOVA (Greenhouse–Geisser corrected) revealed a significant effect of condition on τ (F
(1.25, 240.82) = 115.50, p < 0.001,
$ {\eta}_p^2 $
 = 0.11) (Figure 2a). Tukey-corrected post-hoc comparisons showed that τ was significantly higher in both the ‘Like’ (M = 2.14) and ‘Dislike’ (M = 2.20) conditions than in ‘Neutral’ (M = 1.62; Like vs Neutral: t
(192) = 25.90, p < 0.001; Dislike versus Neutral: t
(192) = 11.93, p < 0.001), indicating more deterministic choice under valenced feedback, but did not differ between ‘Like’ and ‘Dislike’ (t
(192) = 1.10, p = 0.513).
To examine whether individual differences in learning rates predicted behavioral performance, we ran Kendall’s rank (τ) correlations between computational parameters and choice accuracy across conditions. Both the positive learning rate (α +; Kendall’s τ = 0.262, p < 0.001) and the difference between the positive and negative learning rates – the positive learning bias – (α + − α −; Kendall’s τ = 0.195, p < 0.001) were positively associated with accuracy in the ‘Like’ condition after Bonferroni correction (Figure 2b,c). However, no significant relationship was observed for the negative learning rate (τ = −0.055, p = 0.264).
As a follow-up analysis, we computed the mean trial-averaged learned value of the positive-word from the winning model (Vpositive) and correlated it with participants’ end-of-block ratings to bridge computational learning signals with acquired social evaluations. Kendall’s τ correlations between mean Vpositive and ratings were significant in the Neutral (τ = 0.161, z = 3.29, p = .001, r = 0.251) and Like (τ = 0.235, z = 4.78, p < .001, r = 0.360) conditions, but not in the Dislike condition (τ = 0.064, z = 1.30, p = .194, r = 0.10) (Figure 2d). All these results highlight a direct link between the capacity to learn from social feedback and its recognition in social contexts reflected in task performance.
Transdiagnostic factors are differentially associated with learning parameters and task behavior
Our EFA analysis revealed that a three-factor solution best accounted for the questionnaire data (25.8% of variances explained), identifying transdiagnostic dimensions of psychopathology that may relate to social feedback learning. Based on the strongest individual item loadings (Figure 3), factors were labelled accordingly as ‘Social Avoidance’, with higher scores reflecting reduced social motivation and increased avoidance, ‘Emotional Insensitivity’, where higher scores indicate high apathy and difficulties evaluating and empathizing with others, and ‘Depressive Self-Identity’, where higher scores correspond to low mood, low self-esteem, and negative self-identity.
Factor scores (loadings > 0.3) for the three-factor solution. Factors were labelled ‘Social Avoidance’ featuring items measuring social phobia and motivation, ‘Emotional Insensitivity’ consisting of items reflecting apathy and autistic traits, and ‘Depressive Self-Identity’ primarily loading items assessing depression and personality disorder. No significant loadings (>0.3) were observed for the Narcissistic Admiration and Rivalry Questionnaire (NARQ).

Figure 3. Long description
The figure consists of three vertical panels. The y-axis is shared across all panels and is labeled Items, listing specific questionnaire codes. The x-axis is shared and labeled Factor Loading, ranging from 0.2 to 0.8 with a dashed vertical threshold line at 0.3.
Panel 1, Social Avoidance, shows items primarily from the S P I N (Social Phobia) scale in green, with loadings ranging from approximately 0.75 (S P I N 13) down to 0.3 (A Q 5). It also includes several A M I (Apathy) items.
Panel 2, Emotional Insensitivity, displays a mix of A M I (Apathy) items in light green and A Q (Autism) items in pink. Loadings range from approximately 0.65 (A M I 13) down to 0.3 (A Q 10).
Panel 3, Depressive Self-Identity, is dominated by B D I (Depression) items in purple at the top, with loadings from 0.75 (B D I 7) down to 0.5. Below these are B P D (Borderline Personality) items in yellow, with loadings decreasing from 0.5 (B P D 7) to 0.3 (B P D 1).
A legend at the bottom identifies the color-coded questionnaires: A M I (Apathy) in light green, A Q (Autism) in pink, B D I (Depression) in purple, B P D (Borderline Personality) in yellow, and S P I N (Social Phobia) in teal.
To examine whether transdiagnostic factors predicted computational mechanisms underlying social feedback learning, we fit Bayesian mixed-effects models with computational parameters from the winning model as dependent variables (Figure 4a–c). Condition effects on learning parameters were robust, with the Like condition credibly increasing positive learning rates (posterior mean = 0.075, 89% CrI [0.070, 0.081]) and decreasing negative learning rates (mean = −0.036, 89% CrI [−0.047, −0.026]), while the Dislike condition credibly increased both positive learning rates (mean = 0.067, 89% CrI [0.062, 0.073]) and positive learning bias (mean = 0.060, 89% CrI [0.048, 0.073]). Additionally, the ‘Social Avoidance’ factor credibly predicted negative learning rates (mean = 0.023, 89% CrI [0.007, 0.040]) and learning rate difference (mean = −0.022, 89% CrI [−0.040, −0.005]) in opposite directions. Specifically, individuals with higher scores on this ‘Social Avoidance’ factor learned more from negative social feedback, reflecting a negative learning bias. No two-way interactions between condition and transdiagnostic factors were credible, nor did any other transdiagnostic factors show a credible association with computational learning parameters (all 89% credible intervals spanned zero), suggesting that the negative learning bias observed is specific to traits related to social avoidance and low social motivation.
Main effect coefficients for Bayesian regressions predicting computational parameters from the winning model. (a) Predictors of the positive learning rate (α +) (b) Predictors of the negative learning rate (α −). (c) Predictors of the positive learning bias (α + − α −). Yellow = credible positive effects (89% credible interval, CrI, excludes zero), Blue = credible negative effects (89% CrI excludes zero), and grey = non-credible effects (89% CrI includes zero). Error bars = 89% CrI.

Figure 4. Long description
The figure consists of three panels, a, b, and c, sharing a common y-axis of five predictors: Like, Dislike, Social Avoidance, Emotional Insensitivity, and Depressive Self-Identity. The x-axis represents the Posterior mean with 89 percent C r I.
Panel a, Positive Learning Rate (alpha super plus):
* Like and Dislike show credible positive effects in yellow, clustered between 0.06 and 0.08.
* Social Avoidance, Emotional Insensitivity, and Depressive Self-Identity show non-credible effects in grey, centered near zero.
Panel b, Negative Learning Rate (alpha super minus):
* Like shows a credible negative effect in blue, centered near negative 0.035.
* Social Avoidance shows a credible positive effect in yellow, centered near 0.025.
* Dislike, Emotional Insensitivity, and Depressive Self-Identity show non-credible effects in grey, with error bars crossing the zero line.
Panel c, Positive Learning Bias (alpha super plus minus alpha super minus):
* Like and Dislike show credible positive effects in yellow, located between 0.05 and 0.12.
* Social Avoidance shows a credible negative effect in blue, centered near negative 0.025.
* Emotional Insensitivity and Depressive Self-Identity show non-credible effects in grey, centered near zero.
We next sought to understand whether the three transdiagnostic factors moderated the effect of feedback valence on behavioral performance. To do so, we fit a series of three-way mixed-effects regression models with transdiagnostic factors, learning rate parameters (α + and α −), and valence conditions as predictors for task performance. This revealed credible main effects toward choice accuracy (Figure 5a) for both ‘Like’ (posterior mean = 1.407, 89% CrI [1.227, 1.584]) and ‘Dislike’ conditions (mean = 1.097, 89% CrI [0.927, 1.270]), consistent with our repeated measures ANOVA analysis. We also observed a credible positive main effect of the positive learning rate (α +; mean = 1.688, 89% CrI [0.021, 3.315]), alongside credible two-way interactions between the ‘Like’ (mean = −0.333, 89% CrI [−0.513, −0.152]) and ‘Dislike’ (mean = −0.222, 89% CrI [−0.390, −0.050]) conditions and ‘Emotional Insensitivity’, indicating that higher scores on this factor attenuated the benefits in accuracy typically observed in value-congruent learning contexts. In addition, the negative learning rate (α −) showed credible positive interactions with both the ‘Dislike’ condition (mean = 1.138, 89% CrI [0.181, 2.102]) and ‘Social Avoidance’ (mean = 0.832, 89% CrI [0.094, 1.587]), such that faster learning from negative feedback was associated with higher accuracy in the Dislike condition and among individuals higher in Social Avoidance. No three-way interactions were credible (all 89% credible intervals spanned zero).
Coefficients from Bayesian three-way models predicting choice accuracy and decision time. (a) Posterior mean coefficients for choice accuracy showing condition main effects and interactions. (b) Posterior mean coefficients for decision time showing condition main effects and interactions. Yellow = credible positive effects (89% credible interval, CrI, excludes zero), Blue = credible negative effects (89% CrI excludes zero), and grey = non-credible effects (89% CrI includes zero). Error bars = 89% CrI.

Figure 5. Long description
The figure consists of two vertically stacked forest plots, labeled a and b. Both plots use a dashed vertical line at zero to indicate the threshold for effect credibility.
Panel a, titled Choice accuracy, has an x-axis ranging from negative 1 to 3. From top to bottom, the variables are:
* Like: Yellow dot at approximately 1.4 with a narrow error bar.
* Dislike: Yellow dot at approximately 1.1 with a narrow error bar.
* alpha super plus: Yellow dot at approximately 1.7 with a very wide error bar extending from 0 to over 3.
* alpha super minus: Grey dot at approximately negative 0.2 with an error bar crossing zero.
* Social Avoidance: Grey dot near zero.
* Emotional Insensitivity: Grey dot slightly above zero.
* Like times Emotional Insensitivity: Blue dot at approximately negative 0.3.
* Dislike times Emotional Insensitivity: Blue dot at approximately negative 0.2.
* Dislike times alpha super minus: Yellow dot at approximately 1.1.
* Social Avoidance times alpha super minus: Yellow dot at approximately 0.8.
Panel b, titled Decision time, has an x-axis ranging from negative 0.5 to 0.5. From top to bottom, the variables are:
* Like: Grey dot near zero.
* Dislike: Blue dot at approximately negative 0.1.
* Social Avoidance: Grey dot near zero.
* alpha super minus: Yellow dot at approximately 0.5.
* Social Avoidance times alpha super minus: Blue dot at approximately negative 0.35 with a wide error bar.
* Like times Social Avoidance times alpha super minus: Yellow dot at approximately 0.45.
In both panels, yellow indicates credible positive effects, blue indicates credible negative effects, and grey indicates non-credible effects where the 89 percent C r I includes zero.
Finally, we investigated whether transdiagnostic factors and learning rate parameters similarly influenced DT (Figure 5b). The ‘Dislike’ condition showed a credible main effect (posterior mean = −0.086, 89% CrI [−0.156, −0.016]) indicating faster decisions overall. The negative learning rate parameter also showed a credible main effect (mean = 0.543, 89% CrI [0.246, 0.844]), two-way interaction with ‘Social Avoidance’ (mean = −0.359, 89% CrI [−0.702, −0.021]), and three-way interaction with the ‘Like’ condition and Social Avoidance (mean = 0.478, 89% CrI [0.148, 0.810]), suggesting that individuals with higher Social Avoidance scores and higher negative learning rates exhibited slower DTs specifically in the ‘Like’ condition.
Discussion
The current study investigated how behavioral traits affect individuals’ learning from social feedback utilizing a transdiagnostic approach and RL. Model comparison revealed that a simple RL model with an initial value difference and separate learning rates for positive and negative feedback best quantifies the data, indicating asymmetric learning processes. Learning rates were found to vary by task condition, with the positive learning rate higher in both valenced (‘Like’ and ‘Dislike’) conditions than in the ‘Neutral’ condition. Individual differences in positive learning rates and positive learning bias were also both associated with higher choice accuracy in the ‘Like’ condition. This suggests that individuals who learn more strongly from positive feedback make more accurate evaluative judgments in socially positive contexts.
Our factor analysis extracted three robust transdiagnostic dimensions: ‘Social Avoidance’, ‘Emotional Insensitivity’, and ‘Depressive Self-Identity’. These dimensions partly overlap with previous studies extracting transdiagnostic factors of psychopathology from general population samples (Gillan et al., Reference Gillan, Kosinski, Whelan, Phelps and Daw2016; Hoven et al., Reference Hoven, Luigjes, Denys, Rouault and van Holst2023; Oka, Sasaki, & Kobayashi, Reference Oka, Sasaki and Kobayashi2025). A previous study also previously labeled a ‘Social Avoidance’ factor strongly loaded items from measures of social anxiety, autism, and apathy (Schafer & Schiller, Reference Schafer and Schiller2025), and items for Depression and Borderline personality were found to load onto the same factor alternatively labelled ‘Mood’ (Schafer & Schiller, Reference Schafer and Schiller2025). On-the-other-hand, the presence of an ‘Emotional Insensitivity’ factor not reported previously reflects the current study’s specific focus toward assessing social evaluative learning. Indeed, this factor loaded items from the AQ-10 and AMI, questionnaires not included together in previous studies. The extraction of this factor highlights the ability to understand and interpret the emotions of others as an important transdiagnostic dimension of social learning.
We further found significant associations between extracted transdiagnostic dimensions and task-related assessments of social evaluation learning. Specifically, we show that a latent Social Avoidance dimension, cutting across social anxiety and related traits, is selectively associated with a negative learning bias and slower DTs toward positive social feedback. This finding extends previous research using categorical assessments of social anxiety and BPD demonstrating similar learning biases using RL models (Hoffmann et al., Reference Hoffmann, Hobbs, Moutoussis and Button2024; Koban et al., Reference Koban, Schneider, Ashar, Andrews-Hanna, Landy, Moscovitch, Wager and Arch2017, Reference Koban, Andrews-Hanna, Ives, Wager and Arch2023; Korn et al., Reference Korn, La Rosée, Heekeren and Roepke2016) and increased deliberation in response to positive social information (Hunter et al., Reference Hunter, Meer, Gillan, Hsu and Daw2022; Van Der Molen et al., Reference Van Der Molen, Poppelaars, Van Hartingsveldt, Harrewijn, Gunther Moor and Westenberg2014). The Social Avoidance Factor further loaded items from the ‘Social Motivation’ subscale of the AMI. Though existing research on apathy has mainly focused on motivation control and effort-based decision-making (Costello, Husain, & Roiser, Reference Costello, Husain and Roiser2024; Derosiere et al., Reference Derosiere, Vassiliadis, Dricot, Dessain, Delinte, Zénon and Duque2025), recent accounts have identified the motivation to socially engage as a key transdiagnostic measure given its comorbid presentation across multiple disorders (Barkus & Badcock, Reference Barkus and Badcock2019) that may have distinct clinical and neurobiological correlates and respond differently to treatments (Chetcuti et al., Reference Chetcuti, Hardan, Frazier, Loth, McPartland, Youngstrom and Uljarevic2026).
A second transdiagnostic factor, Emotional Insensitivity, reflecting lowered empathy and problems inferring the emotions of others, attenuated performance in both Like and Dislike conditions. As empathy requires accurate emotional identification (Bird & Viding, Reference Bird and Viding2014; Shamay-Tsoory & Hertz, Reference Shamay-Tsoory and Hertz2022), individuals with reduced empathy are less capable of discerning changes in other’s emotions (Coll et al., Reference Coll, Viding, Rütgen, Silani, Lamm, Catmur and Bird2017; Gonzalez-Gadea et al., Reference Gonzalez-Gadea, Herrera, Parra, Gomez Mendez, Baez, Manes and Ibanez2014). This is commonly observed among individuals with ASD who show difficulties in social interactions (Bolis & Schilbach, Reference Bolis and Schilbach2017) due to challenges with understanding the intentions of others (Rosenthal, Hutcherson, Adolphs, & Stanley, Reference Rosenthal, Hutcherson, Adolphs and Stanley2019). In the current study, measures from the Autism Quotient (AQ-10) and ‘Emotional Sensitivity’ subscale of the AMI loaded strongly onto the Emotional Insensitivity factor, both of which may be obscured in categorical assessments or questionnaires. Emotional apathy is robustly associated with prosocial behavior across different contexts (Contreras-Huerta et al., Reference Contreras-Huerta, Lockwood, Bird, Apps and Crockett2022), with higher levels predicting a lowered tendency to help others (Lockwood et al., Reference Lockwood, Hamonet, Zhang, Ratnavel, Salmony, Husain and Apps2017). Yet, few studies have specifically investigated its role with social reward learning. In a study of dementia patients, those with high emotional apathy were found to demonstrate impaired learning toward social rewards (Wong et al., Reference Wong, Wei, Husain, Hodges, Piguet, Irish and Kumfor2023). Our results further show that difficulties with interpreting the emotions of others directly impair the ability to accurately evaluate social feedback.
The present study has some potential limitations. Although we compared four RL models assessing selective learning from positive and negative feedback, along with an initial-value bias, this represents a relatively restricted model space. We deliberately adopted a parsimonious model specification without additional parameters (e.g. choice lapse, perseveration), because such parameters may only be informative in longer tasks or reversal-learning paradigms (e.g. Sugawara & Katahira, Reference Sugawara and Katahira2021), where lapses and choice-history effects are more readily dissociated from learning and decision noise. In the present task, however, there were no reversals and participants completed only 32 trials per condition block. Given this limited number of observations, adding further parameters would risk weak identifiability and parameter trade-offs. We also opted for not including an outcome sensitivity parameter, as outcomes in our task were binary rather than varying in their magnitude. We therefore prioritized a simpler model that captured the core learning and choice processes supported by the task design and available data, though our winning model may nonetheless be regarded as best-fitting only among these candidate models.
Additionally, our sample is mainly comprised of females and consisted exclusively of university students. This may explain the lack of any significant results with the Depressive Self-Identity factor, which strongly loaded items assessing depressive symptoms centered on guilt, lack of satisfaction, and suicidal ideation. The reported BDI scores in our sample (M = 12.52 ± 9.34) primarily reflect minimal (0–13) or mild (14–19) depression (Beck et al., Reference Beck, Steer, Ball and Ranieri1996). However, depressive symptomatology may only emerge with more severe cases than those present in our non-clinical student population (Insel et al., Reference Insel, Cuthbert, Garvey, Heinssen, Pine, Quinn, Sanislow and Wang2010). Furthermore, given the non-clinical nature of the sample which consisted primarily of female university students, our findings should be interpreted as reflecting subclinical trait dimensions. Further studies within clinical and more diverse samples are warranted before drawing conclusions about clinical mechanisms. Future studies should therefore aim to capture a wider range of depressive symptoms across a more diverse sample (Geng et al., Reference Geng, Chen, Chuan-Peng, Jin, Chan, Li, Hu, Zhang and Zhang2022), including recent approaches that take the advantage of large language models by simulating individuals with various personal profiles (Li et al., Reference Li, Hao, Hou, Huang, Wen, Huang, Liu, Liu, Fan, Wang, Wu, Gao, Mohsin, Tang, Joshi, Liu, Deng, Di, Jajee and Song2026; Sohail & Zhang, Reference Sohail and Zhang2025b; Sohail, et al., Reference Sohail, Zhong, Konovalov, Lockwood and Zhang2026), both in laboratory and naturalistic conditions (Wang et al., Reference Wang, Luo, Wang, Zhang and Wu2026).
Taken together, combining a transdiagnostic measure of behavior with computational modelling, our study identifies key behavioral signatures of biased social evaluation learning. Computational modelling revealed that participants exhibited asymmetric learning from positive versus negative social feedback, with learning rates varying by feedback valence. A transdiagnostic factor reflecting social anxiety and motivational deficits biased social learning toward negatively salient information. An ‘Emotional Insensitivity’ factor capturing difficulties in empathy and mentalizing was associated with sensitivity to positive social feedback. These findings demonstrate how transdiagnostic traits influence social evaluative learning, identifying candidate computational processes that can be targeted in future studies.
Supplementary material
The supplementary material for this article can be found at http://doi.org/10.1017/S0033291726106217.
Data availability statement
All code and data for data analysis and figure generation are publicly available at 10.5281/zenodo.19161237.
Acknowledgments
The computations described in this paper were performed using the Birmingham Environment for Academic Research (BEAR) BlueBEAR HPC service.
Author contribution
A.S.: Methodology, Software, Validation, Formal analysis, Data Curation, Writing – Original Draft, Writing – Review & Editing, and Visualization; A.M.: Methodology, Validation, Formal analysis, Investigation, and Writing – Review & Editing; M.S.: Methodology, Validation, Formal analysis, Investigation, and Writing – Review & Editing; L.P.: Methodology, Validation, Formal analysis, Investigation, and Writing – Review & Editing; Y.L.: Validation, Formal analysis, Investigation, and Writing – Review & Editing; G.R.: Validation, Formal analysis, Investigation, and Writing – Review & Editing; A.C.-F.: Validation, Formal analysis, Investigation, and Writing – Review & Editing; J.R.: Validation, Formal analysis, Investigation, and Writing – Review & Editing; L.H.: Validation, Formal analysis, Investigation, and Writing – Review & Editing; T.S.: Validation, Formal analysis, Investigation, and Writing – Review & Editing; A.C.S.: Validation, Formal analysis, Writing – Review & Editing, Visualization, and Supervision; L.Z.: Conceptualization, Methodology, Software, Validation, Formal analysis, Resources, Data Curation, Writing – Review & Editing, Visualization, Supervision, Project administration, and Funding acquisition.
Funding statement
A.S was funded by an MRC AIM iCASE Studentship (MR/W007002/1). A.Sa. was funded by a Walter Benjamin Fellowship from the German Research Foundation (DFG/534697423). L.Z. was supported by the Wellcome Trust (228268/Z/23/Z), the Royal Society (IES\R3\243253), and the Birmingham–Nanjing University Joint Research and Education Centre pump-priming funding.
Competing interests
We declare no conflict of interest.
Ethical standards
The authors assert that all procedures contributing to this work comply with the ethical standards of the relevant national and institutional committees on human experimentation and with the Helsinki Declaration of 1975, as revised in 2008.


 Open access

