INTRODUCTION
Carbon-14 (14C) is a pure β emitter with a relatively long half-life of 5730 years, and it has been widely studied for its high mobility in the environment and important radiological impact on humans (Rohl Reference Pohl1976; Begg et al. Reference Begg, Cook, Baxter, Scott and McCartney1992; Mook and van der Plicht Reference Mook and van der Plicht1999; Ješkovský et al. Reference Ješkovský, Povinec, Steier, Šivo, Richtáriková and Golser2015; Muir et al. Reference Muir, Cook, MacKenzie, MacKinnon and Gulliver2015; Park et al. Reference Park, Hong, Xu, Park, Sung, Sung, Lee, Nakanishi and Park2015). There are three main sources of 14C: (1) naturally occurring in the atmosphere from the interaction of cosmic ray neutrons with nitrogen and oxygen, (2) anthropogenic nuclear weapons tests, and (3) nuclear facilities including nuclear power plants, reprocessing plants, etc. (Pohl Reference Pohl1976; Yim and Caron Reference Yim and Caron2006). Since atmospheric nuclear explosions have been banned, the only anthropogenic 14C source is from nuclear facilities. Compared to the 14C generated by natural cosmic rays and nuclear weapons tests, the source term of 14C from nuclear power plants is considerably lower (Dias et al. Reference Dias, Telles, Santos, Stenström, Nícoli, Corrêa and Skog2009). However, it will definitely increase the 14C content in the biosphere in the long-term perspective. Owing to its relatively long half-life, high isotopic exchange rates, long residence time in the environment, and ease of incorporation into the food chain, efforts for quantifying and controlling 14C in nuclear power plants have been made in many countries (IAEA 2004; Dias et al. Reference Dias, Telles, Santos, Stenström, Nícoli, Corrêa and Skog2009).
14C is a radionuclide of great interest in nuclear power plants and their surroundings since it is present in the primary system of various reactor concepts, it is released into the environment through gaseous and liquid discharges, and represents a large percentage of solid radioactive waste. Dias et al. (Reference Dias, Telles, Santos, Stenström, Nícoli, Corrêa and Skog2009) measured the 14C activity in soils near a Brazilian nuclear power plant and evaluated the transformation and storage of 14C from the nuclear power plant emissions in soil. Yim and Caron (Reference Yim and Caron2006) reviewed the life cycle and management of 14C from nuclear power plants, aiming to provide a basic/up-to-date understanding of the life cycle of 14C and presented the technical issues in current 14C waste management. Aghoyeh and Khalafi (Reference Aghoyeh and Khalafi2012) evaluated the 14C radioactivity and concentration in the primary coolant of the Tehran Research Reactor in Iran. Hou (Reference Hou2005) developed a rapid analysis method to determine the activities of 14C and tritium (3H) in graphite and concrete, respectively. Aquilonius and Hallberg (Reference Aquilonius and Hallberg2005) proposed a process-oriented dose assessment model for 14C released during the normal operation of a nuclear power plant. Fachinger et al. (Reference Fachinger, Lensa and Podruhzina2008) studied the behavior of 14C released from irradiated nuclear graphite in an inert atmosphere at 1350°C. The release and transport behavior of 14C have been of great concern not only during normal power plant operation but also in case of accidents. Xu et al. (Reference Xu, Cook, Cresswell, Dunbar, Freeman, Hou, Jacobsson, Kinch, Naysmith, Sanderson and Tripney2016) reported the radiocarbon releases from the 2011 Fukushima nuclear accident based on the 14C activities measured in the annual tree rings of Japanese cedar trees from 2009 to 2015. Finally, the 14C source terms in fusion reactors have been studied based on the activation analysis (Khripunov et al. Reference Khripunov, Kurbatov and Subbotin2008).
The very high temperature reactor (VHTR) is a development of the high temperature gas-cooled reactors (HTGRs) and one of the six proposed Generation IV reactor concept candidates (NERAC and GIF 2002). 14C is a fission and activation radioisotope produced in HTGRs. As indicated in our previous paper, in HTGRs, especially the pebble-bed types, the source term can be divided into five categories: fission products, activation products, radioactive dust, 3H, and 14C (Xu et al. Reference Xu, Li, Xie, Cao and Tong2017). The fission products can usually be divided into gaseous, such as 85Kr and 133Xe, and solid, such as 137Cs and 110mAg. The activation products includes typical nuclides, such as 60Co and 59Fe. The radioactive dust is a unique source term in HTGRs since it provides a parallel route for the transportation of radionuclides. Research on 3H and 14C in various nuclear reactors and facilities is of great interest due to their potential involvement in the biocycle and contributions to the radiological body burden.
In China, the Institute of Nuclear and New Energy Technology (INET) guided the research and development of pebble-bed HTGRs (Zhang and Yu Reference Zhang and Yu2002). The 10 MW high temperature gas-cooled reactor (HTR-10) was the first pebble-bed gas-cooled test reactor in China, which was used to study and demonstrate the physical principles of high temperature gas-cooled reactors. Meanwhile, much experience and knowledge was gained from the design, construction and operation of HTR-10 (Xu and Zuo Reference Xu and Zuo2002). The HTR-10 adopted helium as primary coolant and graphite spheres containing tristructural-isotropic (TRISO) coated particles as fuel elements. The reactor reached criticality in 2000 and commenced full power operation in 2003 (Wu et al. Reference Wu, Lin and Zhong2002). A series of source term experiments have been conducted at HTR-10, aiming to provide reliable data for understanding the characteristics of radiation safety and promote radioactive nuclides research in pebble-bed HTGRs. So far, the following studies on HTR-10 have been carried out: (1) measurement of 3H activity concentration in the primary coolant (Xie et al. Reference Xie, Cao, Feng, Tong, Dong, Zhang and Scarlat2018a), (2) measurement of radioactive dust concentration in the primary coolant (Xie et al. Reference Xie, Cao, Chen and Dong2015, Reference Xie, Cao, Feng, Liu, Tong, Wang, Dong, Zhang and Loyalka2017), and (3) measurement of distribution of typical nuclides in irradiated graphite spheres (Wang et al. Reference Wang, Pi, Xie, Li and Cao2014; Li et al. Reference Li, Liu, Xie and Jia2017; Liu et al. Reference Liu, Huang, Xie, Jia, Feng and Li2017; Xie et al. Reference Xie, Li, Liu, Chen, Li, Chen and Verfondern2018b).
In this study, we are focusing on the investigation of the source term of 14C in HTR-10. The generation mechanisms, distribution characteristics, reduction routes, and release types of 14C in HTR-10 were analyzed. A theoretical method to calculate the 14C activity in the core and primary coolant of HTR-10 was proposed. In addition, we presented the newly designed 14C sampling system in the helium purification system (HPS) of HTR-10, and reported the measurement of 14C activity in the primary coolant. Furthermore, we compared the experimental results to the values derived from theoretical calculations based on the operational history of HTR-10 and experimental data from the Arbeitsgemeinschaft Versuchsreaktor (AVR) (Bäumer and Barnert Reference Bäumer and Barnert1990).
MATERIALS AND METHODS
Theoretical Model and Analysis
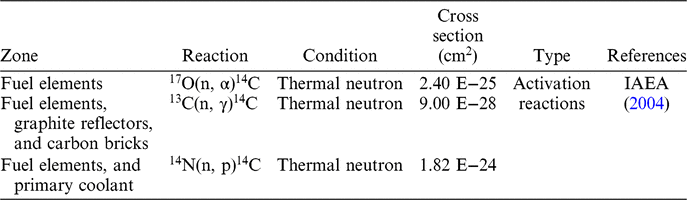
The production mechanisms of 14C have been studied previously, and the dominant sources of 14C have been determined to be the activation reactions of light nuclides in the graphite reflectors, carbon bricks, and primary coolant in the reactor core (Davis Reference Davis1977; Wichner and Dyer Reference Wichner and Dyer1980). The production mechanisms of 14C in HTR-10 are summarized in Table 1. The 14C is produced by the ternary fission reaction of heavy nuclides (Frolov Reference Frolov2002; IAEA 2004; Val’skii Reference Val’skii1976). However, this is a negligible contribution to the 14C inventory and has no practical importance (IAEA 2004; NDA 2012). We excluded this generation source in our analysis. The detailed description of the calculation model of the activity amount of 14C in the reactor core and the activity concentration of 14C in the primary coolant of HTR-10 is presented in the following section.
Production mechanisms of 14C in HTR-10.

Production of 14C in HTR-10
Production of 14C from the Activation Reaction of 17O
In HTR-10, the 17O isotope in the UO2 fuel kernel can be activated into 14C using the large thermal neutron fluence in the core. The amount of 14C generated from the activation reaction of 17O in the fuel elements can be expressed as follows:
 $${{d{N^{F\_{}^{17}O}_{{}^{14}{C}}}} \over {dt}} = - {\sigma _{{}^{17}O}}\phi {N_{F\_{}^{17}O}}$$(1)
 $${{d{N_{F\_{}^{17}O}}} \over {dt}} = - {\sigma _{{}^{17}O}}\phi {N_{F\_{}^{17}O}}$$(2)
where  $N_{^{14}C}^{F{\_^{17}}O}$ is the number of 14C atoms from the activation reaction of 17O in the fuel elements,
 ${N_{F{\_^{17}}O}}$ is the number of 17O atoms in the fuel elements,
 ${\sigma _{{}^{17}O}}$ is the cross section of the activation reaction of 17O(n, α)14C (cm2), and ϕ is the average thermal neutron flux in the core (cm–2·s–1).
Production of 14C from the Activation Reaction of 13C
In HTR-10, the 13C isotope in the fuel elements, graphite reflectors, and carbon bricks can be activated. The amount of 14C generated from the activation reaction of 13C in these zones can be expressed as follows:
 $${{dN_{{}^{14}C}^{F\_{}^{13}C}} \over {dt}} = {\sigma _{{}^{13}C}}\phi {N_{F\_{}^{13}C}}$$(3)
 $${{d{N_{F\_{}^{13}C}}} \over {dt}} = - {\sigma _{{}^{13}C}}\phi {N_{F\_{}^{13}C}}$$(4)
 $${{dN_{{}^{14}C}^{G\_{}^{13}C}} \over {dt}} = {\sigma _{{}^{13}C}}{\phi _G}{N_{G\_{}^{13}C}}$$(5)
 $${{d{N_{G\_{}^{13}C}}} \over {dt}} = - {\sigma _{{}^{13}C}}{\phi _G}{N_{G\_{}^{13}C}}$$(6)
 $${{dN_{{}^{14}C}^{C\_{}^{13}C}} \over {dt}} = {\sigma _{{}^{13}C}}{\phi _C}{N_{C\_{}^{13}C}}$$(7)
 $${{d{N_{C\_{}^{13}C}}} \over {dt}} = - {\sigma _{{}^{13}C}}{\phi _C}{N_{C\_{}^{13}C}}$$(8)
where  $N_{{}^{14}C}^{F\_{}^{13}C}$,
 $N_{{}^{14}C}^{G\_{}^{13}C}$, and
 $N_{{}^{14}C}^{C\_{}^{13}C}$ are the numbers of 14C atoms from the activation reaction of 14C in the fuel elements, graphite reflectors, and carbon bricks, respectively,
 ${N_{F\_{}^{13}C}}$,
 ${N_{G\_{}^{13}C}}$, and
 ${N_{C\_{}^{13}C}}$ are the numbers of 13C atoms in the fuel elements, graphite reflectors, and carbon bricks, respectively,
 ${\sigma _{{}^{13}C}}$ is the cross section of the activation reaction of 13C (n, γ) 14C (cm2), and ϕ, ϕG, and ϕC are the average thermal neutron fluxes in the core, graphite reflectors, and carbon bricks, respectively (cm–2·s–1).
Production of 14C from the Activation Reaction of 14N
In HTR-10, the 14C generated from the activation of 14N can originate from two sources: the fuel elements and the primary coolant.
Production of 14C from the Activation Reaction of 14N in the Fuel Elements
In the fuel elements, part of the 14C produced from the activation of 14N can enter the primary coolant due to corrosion, while the rest will be retained inside the fuel spheres. Based on the features of the pores in the fuel elements, radiation characteristics, corrosion mechanism of the graphite, etc., the following assumptions were adopted in the calculations: (a) The N impurities were mainly concentrated in the pores of the matrix graphite. (b) There were open and closed pores in the matrix graphite. The open pores could connect to the surroundings. When fresh fuel elements were loaded into the core, the content of N in the open pores of the matrix graphite would quickly reach an equilibrium concentration of 2 vpm in the primary loop of HTR-10. The nitrogen pressure in the closed pores was 7.9 × 10⁴ Pa. (c) The corrosion of graphite in the fuel elements occurred at the surface of the open pores, the dominant corrosion form of 14C from the fuel elements was CO since the radiolytic oxidation of graphite produces CO (Marsden et al. Reference Marsden, Hopkinson and Wickham2002; Smith et al. Reference Smith, Mccrory and Dunzik-Gougar2013). Therefore, the partial pressure of CO could be an indicator of the corrosion degree of graphite. The corrosion rates of 12C, 13C, and 14C were considered to be the same. (d) When a fuel element achieved its final burn-up, approximately one third of the closed pores in the matrix graphite would become open (Hoinkis et al. Reference Hoinkis, Eatherly, Krautwasser and Robens1986). (e) When the helium in the primary loop went through the HPS, the gaseous 14C would be transformed into 14CO2 and adsorbed by the molecular sieve bed entirely.
Based on the above assumptions, the 14C in the fuel elements from the activation of 14N originated from two sources: the activation reaction of 14N in the open pores and the activation reaction of 14N in the closed pores. Only the 14C generated at the surface of the open and closed pores which unfolds at the final burn-up, could enter the primary coolant through corrosion. It takes approximately 1080 days for each fuel element in the core to achieve final burn-up. Therefore, the amount of 14C generated by the activation of 14N in a fuel element that was kept in the core for 1080 days could be calculated using the following equations:
 $$R_{{}^{14}C}^{All} = {t_e} \cdot \left({\sigma _{{}^{14}N}}\phi N_{{}^{14}N}^{Closed} + {\sigma _{{}^{14}N}}\phi N_{{}^{14}N}^{Open}\right)$$(9)
 $$R_{{}^{14}C}^{Release} = {t_e} \cdot \bigg({1 \over 3}{\sigma _{{}^{14}N}}\phi N_{{}^{14}N}^{Closed} + {\sigma _{{}^{14}N}}\phi N_{{}^{14}N}^{Open}\bigg) \cdot k$$(10)
 $$CR_{^{\it 14}C}^{Release} = z \cdot R_{{}^{\it 14}C}^{Release}/{t_e}$$(11)
where  $R_{{}^{14}C}^{All}$ is the number of 14C nuclides generated from the activation of 14N in a fuel element kept in the core for 1080 days,
 $R_{^{14}C}^{Release}$ is the number of 14C nuclides generated by the activation of 14N in a fuel element that can be released into the primary coolant through corrosion during 1080 days,
 $CR_{{}^{\it 14}C}^{Release}$ is the average release rate of 14C from the fuel elements into the primary coolant, te is the resident time in the core for a fuel element to achieve final burn-up, which is 1080 days in HTR-10 (s),
 ${\sigma _{{}^{14}N}}$ is the cross section of the activation reaction of 14N(n, p)14C (cm2),
 $N_{{}^{14}N}^{Closed}$ and
 $N_{{}^{14}N}^{Open}$ are the numbers of 14N atoms in the closed and open pores of the fuel element, respectively, k is the ratio of the 14C nuclides released into the primary coolant to the total 14C nuclides from the activation of 14N in the fuel element, and z is the total number of fuel elements in the reactor (27,000 for the HTR-10 equilibrium core).
As stated before, the partial pressure of CO could be an indicator of the corrosion degree of the graphite, and the corrosion rates of 12C, 13C, and 14C were assumed to be the same. The number of 14CO molecules removed by the HPS during the time te can be thought of as the number of 14C nuclides released into the primary coolant from the fuel elements. Thus, the number of C nuclides purified in the HPS during the time te,  $N_C^P$, can be described as:
 $$N_C^P = {t_e} \cdot {C_{CO}} \cdot {V_{He}} \cdot {P_{ur}} \cdot {N_A}/R$$(12)
where C CO is the concentration of CO in the primary coolant (vpm), V He is the volume of primary coolant (m3 (STP)), P ur is the purification rate of the HPS (s−1), N A is Avogadro’s constant (6.02 × 10²³), and R is the volume of one mole of ideal gas at standard temperature and pressure (0.0224 m3).
Since corrosion occurred at the surface of the open and closed pores which unfolded at final burn-up in a fuel element, the number of C nuclides at the surface of the microscopic pores in a fuel element, NC, can be described as,
 $${N_C} = {\raise0.7ex\hbox{$S$} \!\mathord{\left/ {\vphantom {S {{S_C}}}}\right.\kern-\nulldelimiterspace}\!\lower0.7ex\hbox{${{S_C}}$}}$$(13)
 $$S = ({F_{Open}} + 1/3 \cdot {F_{Closed}}) \cdot m \cdot {S_0}$$(14)
 $${S_C} = {\raise0.7ex\hbox{${3\sqrt3 }$} \!\mathord{\left/{\vphantom{{3\sqrt3 } 4}}\right.\kern -\nulldelimiterspace}\!\lower0.7ex\hbox{$4$}} \cdot {a^2}$$(15)
where S is the surface area of the microscopic pores in a fuel element, SC is the area of each C atom in graphite, FOpen and FClosed are the ratios of open and closed pores to the total pores in a fuel element, m is the mass of a fuel element (g), S0 is the specific surface area, which is 11 m2/g for the fuel element of HTR-10 (Lu et al. Reference Lu, Chen, Zhou, Zhang, Jiang and Liu2013), and a is the lattice constant of graphite, which is 2.46 × 10⁻¹⁰ m.
Therefore, the ratio of 14C nuclides released into the primary coolant to the total 14C nuclides from activation reaction in the fuel element, k, can be calculated as follows:
 $$k = {\raise0.7ex\hbox{${N_C^P}$} \!\mathord{\left/{\vphantom{{N_C^P} {(Z \cdot {N_C})}}}\right.\kern -\nulldelimiterspace}\!\lower0.7ex\hbox{${(Z \cdot {N_C})}$}}$$(16)
Production of 14C from the Activation Reaction of 14N in the Primary Coolant
In the equilibrium core of HTR-10, on the average 25 fuel elements will achieve final burn-up each day and will be replaced with 25 fresh fuel elements. When the fresh fuel elements are loaded into the core, in order to reduce air import, a vacuum pump is used to decrease the pressure to 100 Pa. Thus, approximately 79 Pa of nitrogen are thought to reside in the open pores of the fuel elements. In the primary coolant of HTR-10, 14N is captured by the helium purification system. Therefore, the consumption rate of 14N in the primary coolant and the production rate of 14C during the activation reaction of 14N can be calculated as follows:
 $${{d{N_{P\_{}^{14}N}}} \over {dt}} = {R_{^{14}N}} - ({\sigma _{^{14}N}}g\phi + {L_R} + {P_{^{14}N}}) \cdot {N_{P\_{}^{14}N}}$$(17)
 $${{dN_{{}^{14}C}^{P\_{}^{14}N}} \over {dt}} = {\sigma _{{}^{14}N}}g\phi {N_{P\_{}^{14}N}}$$(18)
where  ${N_{P\_{}^{14}N}}$ and
 $N_{{}^{14}C}^{P\_{}^{14}N}$ are the number of 14N nuclides in the primary coolant and the number of 14C nuclides generated by the 14N in the primary coolant, respectively,
 ${R_{^{14}N}}$ is the rate of 14N entering the primary coolant (s−1), g is the ratio of the helium volume in the core to that in the primary loop, which is approximately 2%, LR is the release rate of the primary coolant (s−1), and
 ${P_{^{14}N}}$ is the purification rate of 14N in the HPS (s−1).
Calculation Model of the Concentration of 14C in the Primary Coolant
There are three routes for the reduction of 14C in the primary coolant of HTR-10: radioactive decay of 14C, leakage of primary helium in the primary loop, and purification through HPS. There are two sources of 14C in the primary coolant of HTR-10: the activation reaction of 14N in the primary coolant and the release of 14C from the fuel elements. Considering the reduction routes and production sources in HTR-10, the number of 14C nuclides,  $N_{{}^{\it 14}C}^{Primary}$, in the primary coolant can be expressed as:
 $${{dN_{{}^{\it 14}C}^{Primary}} \over {dt}} = {\sigma _{{}^{\it 14}N}}g\phi {N_{P\_{}^{\it 14}N}} + CR_{{}^{\it 14}C}^{Release} - ({L_R} + {P_{ur}} + \lambda )N_{{}^{\it 14}C}^{Primary}$$(19)
where λ is the decay constant of 14C (s−1).
RESULTS AND DISCUSSION
Theoretical Calculation Results
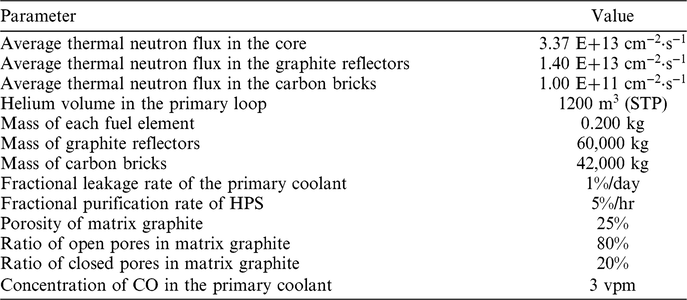
The main parameters for the source term calculations of 14C in HTR-10 are listed in Table 2. The majority of the parameters were adopted from the design values in the final safety analysis report of HTR-10 (INET 2000). Some experimental data were used when available. The porosity and ratio of open and closed pores of the matrix graphite of HTR-10 were determined using micropore structures studies (Lu et al. Reference Lu, Chen, Zhou, Zhang, Jiang and Liu2013, Reference Lu, Chen, Wei, Zhou, Zhang and Liu2016). The concentration of CO in the primary loop of HTR-10 was deduced according to the measured values along with the reactor power (Zhu and Li Reference Zhu and Li2010).
Main parameters used in the source term calculations of 14C in HTR-10.

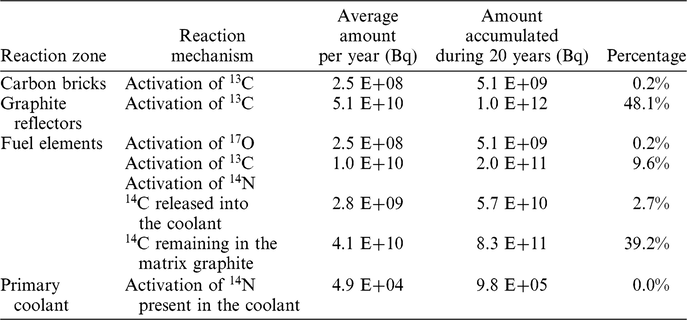
The amount of 14C produced from various sources in different zones of HTR-10 is presented in Table 3. The total amount of 14C produced in HTR-10 per year is 1.1× 10¹¹ Bq. The largest contribution (48%) is generated from the activation reaction of 13C in the graphite reflectors. Although there are numerous carbon bricks in HTR-10, the amount of 14C generated by the activation reaction of 13C in this area is two orders of magnitude smaller compared to the amount generated in the graphite reflectors given the average thermal neutron flux in the carbon bricks assumed to be correspondingly smaller than in the graphite reflectors.
Amount of 14C generated in HTR-10.

In the fuel elements, most of 14C is produced by the activation of 14N present in the pores of graphite (41.9%). A part of 14C will be oxidized and released into the primary coolant, and the larger part remains in the graphite matrix. Furthermore, the amount of 14C generated from the activation of 13C and the activation of 17O decreased (9.6% and 0.2%, respectively).
However, in the primary loop, the amount of 14C generated from the activation of 14N present in the primary coolant is small, since the amount of 14N brought in by the fresh fuel elements is small and the HPS continuously removes nitrogen from the primary coolant.
Since the designed lifetime of HTR-10 is 20 years, the amount of 14C accumulated over 20 years generated in different zones of the core of HTR-10 is also presented in Table 3. According to the design criteria of HTR-10, the released 14C can be classified as solid and gaseous waste. Most of the 14C generated in the reactor core (97%) is retained by the graphite reflectors, carbon bricks, and fuel elements in solid form. Only a part of the 14C generated by the activation reaction of 14N in the open pores of the matrix graphite and those closed pores which opened up under neutron irradiation during the fuel element lifetime, could enter the primary loop. However, this contribution from the fuel elements represents the dominant production source of 14C in the primary coolant of HTR-10.
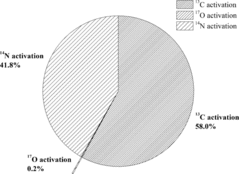
Figure 1 shows the percentages of 14C in the reactor core of HTR-10 from various sources. Most 14C (58%) is produced by the activation reaction of 13C. The second dominant contributor (42%) is the activation reaction of 14N. Further, the amount of 14C generated by the activation reaction of 17O represents less than 1% of the total amount and remain insignificant. The high contribution from 13C despite its relatively low cross-section and abundance can be attributed to carbon being the main constituent of graphite. Moreover, there is a large amount of graphite in the reflectors of HTR-10. In addition, 14N is also a main source of 14C, which can greatly affect the amount of 14C in graphite, especially in the primary coolant. Since 13C is a natural isotope in graphite and carbon materials, controlling 14N impurities in the graphite and primary coolant will be a key factor for limiting the activity of 14C in HTGRs.
Percentages of generated 14C amount in the HTR-10 reactor core from various sources.

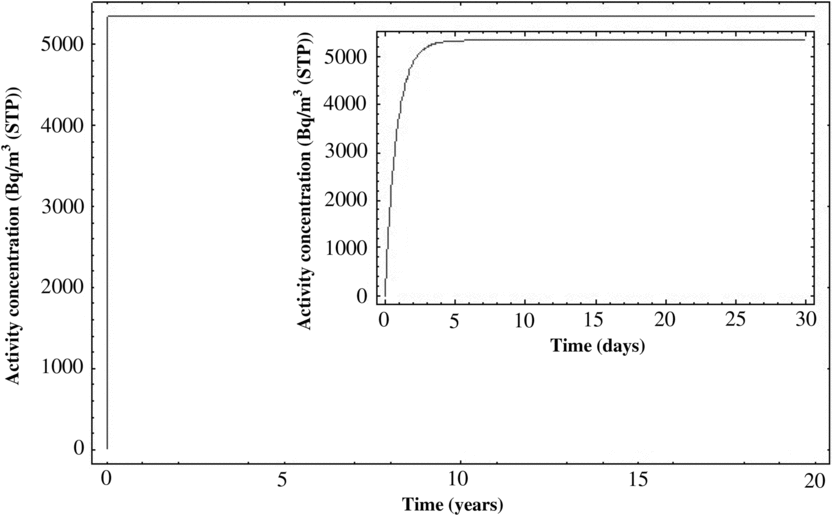
The activity concentration of 14C in the primary coolant of HTR-10 at full power operation was calculated, as indicated in Figure 2. After 20 years of operation, the total activity of 14C in the primary coolant of HTR-10 was estimated to be 6.4 × 10⁶ Bq and the activity concentration of 14C was estimated to be 5.3 × 10³ Bq/m3 (STP). The activation reaction occurred when HTR-10 was started, resulting in a rapid increase of the activity concentration of 14C in the primary coolant. Unlike 3H in the primary coolant of HTR-10, which takes a long time to reach equilibrium, the activity concentration of 14C in the primary coolant reached equilibrium approximately 10 days later after the initial start of the reactor (Xu et al. Reference Xu, Li, Xie, Cao and Tong2017).
Calculated activity concentration of 14C in the primary coolant of HTR-10 as a function of operation time.

The dominant source of 14C in the primary coolant is the release of 14C from the open pores and those closed pores unfolded at the final burn-up stage in the fuel elements. The corrosion process started with the beginning of reactor operations. Moreover, the corrosion rate was estimated by dividing the corrosion ratio of carbon by the residence time for a fuel element in the reactor core. Meanwhile, the removal in the HPS, the leakage of primary helium, and the decay of 14C decreased the amount of 14C in the primary loop.
The reduction of the 14C amount in the primary loop of HTR-10 after 20 years of operation is listed in Table 4, which indicates the removal by HPS representing by far the greatest sink term, whereas the leakage of primary helium and the decay of 14C remain insignificant.
Reduction of 14C in the primary loop of HTR-10 at the end of 20 years of operation.

The gaseous 14C leaked from the primary coolant into the reactor building or removed by the HPS in HTR-10 will discharge into the environment. The molecular adsorber in the HPS in HTR-10 was used to remove the gaseous 14C in the primary coolant. After a certain time, the gaseous 14C will be desorbed from the molecular adsorber during the regeneration process and be discharged into the stack (Yao et al. Reference Yao, Wang, Liu, He and Li2002). The amount of gaseous 14C discharged from the stack per year is estimated to be 2.8 × 10⁹ Bq, which represented approximately 2.7% of the total amount of 14C in HTR-10. According to the Chinese National Standard GB6249-2011, the limits for 14C emission via gaseous effluents for light and heavy water reactors are 7.0×10¹¹ Bq/a and 1.6×10¹² Bq/a, respectively (MEPC 2011). According to our current calculations, the emission of 14C per year from gaseous effluents of the HTR-10 is significantly below the imposed limit.
Experimental Setup and Results
The measurement of the activity of 14C in the primary loop of HTR-10 was performed in 2015, when the HTR-10 was restarted for personnel training for the high temperature gas-cooled reactor pebble-bed module (HTR-PM) and operated in a low thermal power mode. In 2015, the HTR-10 operated for approximately 100 days, and the detailed summary of its operational history was described by Wei et al. (Reference Wei, Xie, Chen, Ma, Tong and Li2016). From June 1 to August 6, 2015, several source-term experiments were performed. Four sampling experiments of 14C in the primary HPS were performed using the 14C sampling loop installed in 2013. This was the first experimental measurement of the activity concentration of 14C in the primary loop of HTR-10.
The measurements of 14C in the primary coolant were performed using gas samples collected from the HPS of HTR-10. The HPS was described in detail by Yao et al. (Reference Yao, Wang, Liu, He and Li2002). Briefly, the HPS of HTR-10 includes two purification lines. Each line possesses a dust filter, a copper oxide bed, a molecular sieve absorber, and a low-temperature absorber, which can reduce chemical impurities (H, CO, CO2, N, etc.) and remove radioactive dust and gaseous fission products (isotopic nuclides of Kr and Xe). The system can purify the helium in the primary loop at 5% per hour with a flow rate of 10.5 kg/hr under normal operating conditions (250°C and 3 MPa).
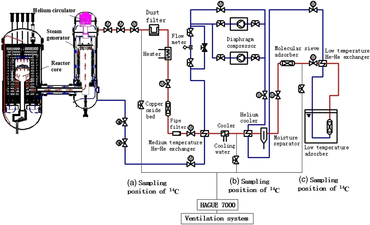
The flow scheme of the primary loop of HTR-10, and the sampling positions of 14C in the HPS are presented in Figure 3. The primary helium gas was sampled from three positions in HTR-10: (1) the entrance of the HPS, (2) downstream of the dust filter, heater, copper oxide bed, temperature exchanger, and water cooler, and (3) downstream of the helium cooler, moisture separator, and molecular sieve absorber, and upstream of the low-temperature absorber.
Sampling positions for the measurement of 14C in the HPS of HTR-10.

The primary coolant was sampled by connecting a HAGUE 7000 device (SDEC, France), to a helium gas flow routed through three different sampling tie-in points in the HPS. The HAGUE 7000 device, which is widely used and recognized in the international nuclear industry, collects gaseous 14CO2 into NaOH solution vials with a higher than 99% trapping yield. The CO to CO2 conversion unit associated with the HAGUE 7000 instrument was not utilized for these measurements, therefore only the CO2 in the helium stream was measured. The instrument measures gas flows with 1% accuracy, for a cumulative gas volume up to 25,000 m3.
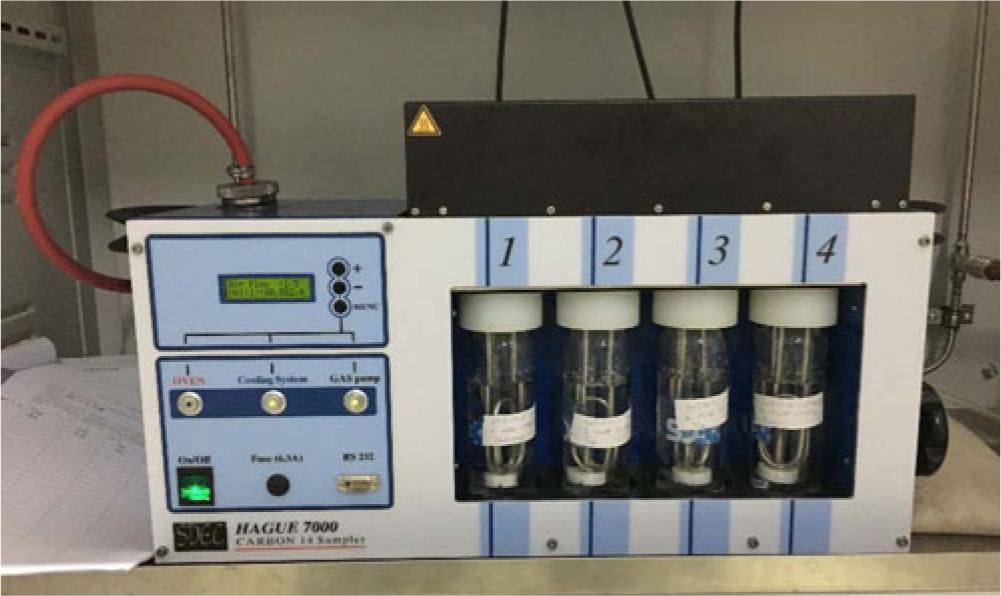
Figure 4 shows the HAGUE 7000 device and the bubbling vials installed at the INET laboratory, in Beijing. Four vials with NaOH solution (170 mL, 0.1 mol/L, for each vial) were used to collect 14CO2 by bubbling the helium stream through the aqueous alkali in the vials. The details of the HAGUE 7000 device and its application can be found elsewhere (SDEC France 2013).
HAGUE 7000 device and installed bubbling vials.

The gas line operated at approximately 20°C. Similar to the analysis of 3H in the primary loop of HTR-10, the activity concentration of 14C was measured by liquid scintillation counting (LSC) in a 1220 Quantulus Analyzer (PerkinElmer, Inc.). The LSC measurements were carried out shortly after the 14C collection from the primary HPS. The volumetrically measured amount of NaOH solution in the collection vials, the activity concentration of 14C in the liquid sample measured by LSC, and the total amount of sampled helium measured using the HAGUE 7000 instrument helped deduce the activity concentration of 14C in the primary coolant.
Most of 14C exists in HTGRs (helium coolant) as 14CO, and very little as 14CO2. The HAUGE 7000 device can only collect the 14CO2 because 14CO does not react with NaOH. In the helium purification system, the 3H2 and 14CO can be oxidized into 3H2O vapor and 14CO2, respectively by the copper oxide bed. The majority of 14C (95%, based on AVR data) in the primary loop after the copper oxide bed is thought to convert to 14CO2. Therefore, the measurements at sampling position (b) indicate the total 14C activity in the primary loop. The measurements at sampling position (a) indicated the activity of 14C as 14CO2 in the primary loop. The measurements at sampling position (c) indicate the gaseous 14CO2 left in the helium stream, downstream of the moisture separator and molecular sieve absorber and upstream of the low-temperature absorber.
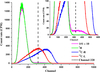
We performed a total of four sampling experiments: the first measurement from sampling position (a) with approximately 70 L primary helium for about 4 hr, the second measurement from sampling position (b) with approximately 80 L primary helium for about 4 hr, the third measurement from sampling position (c) with approximately 200 L primary helium for approximately 6 hr, and the fourth measurement from sampling position (b) with approximately 1835 L primary helium for about 30 hr. Unfortunately, 14C could only be detected in the samples obtained from sampling position (b) in the fourth measurement with enough helium flowing through. Figure 5 shows the LSC spectra for the fourth measurement of liquid sample 1#1 (vial 1, run 1), in which the count rate above channel 600 is close to 0, implying that the contributions in 3H and 14C channels from higher energy β-emitters can be neglected. The left part of the LSC spectrum for 14C in Figure 5 overlaps with the LSC spectrum for 3H since 3H has been detected in the primary HPS of HTR-10 (Xie et al. Reference Xie, Cao, Feng, Tong, Dong, Zhang and Scarlat2018a).
LSC spectra of 1#1 (SQP(E) = 784.8, where × 10 means the experimental data was multiplied by 10 for comparison) and three standard samples (one for 3H, with SQP(E) = 785.4, approximately the same as the 1#1 sample, and two for 14C, with SQP(E)s of 854.0 and 760.4 for 14C-R and 14C-L, corresponding to the rightmost and the leftmost points in Figure 6, respectively).

The radioactivity concentration of 14C in a sample,  $A{C_{{}^{14}C}}$, can be obtained using the following equation:
 $$A{C_{{}^{14}C}} = {{c{r^{chn320 - 600}}/{K_{{}^{14}C}}} \over {{E_{{}^{14}C}} \cdot V}}$$(20)
where cr chn320-600 is the count rate in channels 320–600 due to the LSC source alone without background,  ${K_{{}^{14}C}}$ is the ratio of the 14C count rate in channels 320–600 to that in channels 1–600,
 ${E_{{}^{14}C}}$ is the counting efficiency of 14C when channels 1–600 are chosen as the region of interest, and V is the volume of the sample. For the measurement of 14C by LSC, the values of
 ${K_{{}^{14}C}}$ and
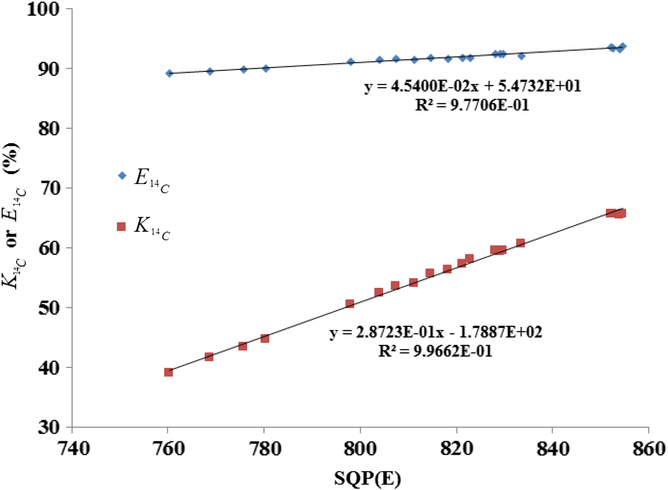
 ${E_{{}^{14}C}}$ vary with the quench level of the sample as shown in Figure 6. The calibration data in Figure 6 were obtained as follows: (1) preparation of five LSC samples, each containing 50 μL 14C standard solution, 10 mL cocktail, and different volume of quenching agent; (2) measurement of the five samples after they have been prepared for 1, 2, 6, and 10 days, and calculate the
 ${K_{{}^{14}C}}$ and
 ${E_{{}^{14}C}}$ for each sample; (3) correlation of the
 ${K_{{}^{14}C}}$ and
 ${E_{{}^{14}C}}$ with the quench index SQP(E) (Feng et al. Reference Feng, He, Wang and Chen2012).
 ${K_{{{14}_C}}}$ and
 ${E_{{{14}_C}}}$ variation with SQP(E).

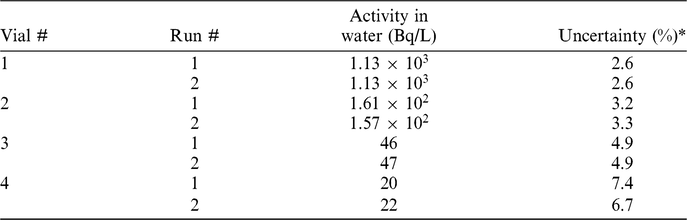
Table 5 summarizes the activity concentration of 14C for each liquid sample for the measurements of helium in the fourth sampling experiment. Assuming a linear relationship between the 14CO2 concentration in the helium stream and the activity of 14C in the NaOH solution samples, we concluded from this data that the bubbling system collects more than 99% of the 14CO2 in the helium stream.
Activity concentration of 14C for each liquid sample in the fourth measurement.

* Includes uncertainties associated with counting statistics, counting efficiency and sampling volume.
From sampling position (b), a value of 1.2(1) × 102 Bq/m3 (STP), was deduced from the measurement that required approximately 30 hr and a large amount of primary helium. This can be thought of as a representative time-averaged value for the activity concentration of 14C in the primary loop of HTR-10. Although the second measurement was also performed at sampling position (b), the accumulated sampling helium volume was too small to detect 14C. Since most 14C was considered to exist as CO in the primary loop of HTR-10, the measurement at sampling position (a) hardly detected 14C as CO2. As the molecular sieve adsorber can adsorb CO2, there was no 14C detected at sampling position (c) as expected.
Comparison of Experimental Data with Theoretical Calculations and AVR Results
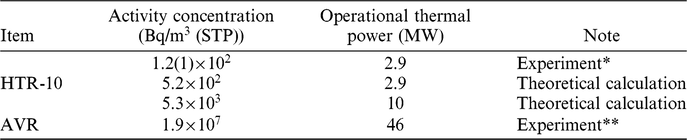
According to the theoretical model proposed above, the activity concentration of 14C in the primary loop of HTR-10 was calculated as 5.2×10² Bq/m3 (STP), as listed in Table 6. Although the theoretical calculation result was approximately five times larger than the experimental value, our results were reasonable considering the complicated physical and chemical processes in the core and the adoption of parameters with design values. The neutron fluence in the core adopted in the calculation was converted using the ratio of thermal power, which was 2.9/10. As suggested above, the concentration of CO in the primary loop could indicate the corrosion degree of the graphite in the core. We used the experimentally measured concentration of CO in the primary loop at a reactor power of approximately 2.9 MW, which was approximately 1 vpm compared to the design value of 30 vpm (Zhu and Li Reference Zhu and Li2010). Furthermore, we used the values associated with the full power operation for the other parameters.
Activity concentration of 14C in the primary loop of HTR-10 and AVR.

* Experimental uncertainty of the measurement in HTR-10 is approximately 8%.
** Experimental uncertainty of the measurement in AVR was not reported.
The activity concentration of 14C in the primary loop of AVR was measured as 1.9 × 10⁷ Bq/m3 (STP), which was much higher than the 1.2(1) × 102 Bq/m3 (STP) experimental value determined when the operational power of HTR-10 was 2.9 MW (Bäumer and Barnert Reference Bäumer and Barnert1990). There are two main reasons that may explain this difference. A pumping process was implemented to remove the air in the fuel elements and related pipes in HTR-10 before fresh fuel elements were loaded into the core. There was no air pumping process during the load of fresh fuel elements into the core of AVR, therefore the level of N impurities in the fuel elements and primary loop of AVR were supposed to be higher compared to HTR-10. In addition, the temperature in the core of AVR for large periods of operation time was much higher compared to HTR-10, given the average maximum helium outlet temperature of AVR was approximately 950°C compared to 700°C for HTR-10. A higher temperature implied an increase in the corrosion of graphite with oxidants, such as oxygen, etc. Therefore, 14C release from graphite was greatly promoted. When the experimental measurement of 14C in the primary loop of HTR-10 was implemented in 2015, the primary helium temperature at the outlet of the HTR-10 core was approximately 570°C.
However, this was the first time the activity concentration of 14C in the primary loop of HTR-10 was determined experimentally. Although the experimental data were adopted whenever possible, the theoretical results for the activity concentration of 14C in the primary loop were still higher than the experimental values. This indicates that current theoretical calculations are conservative for the evaluation of the activity concentration of 14C in the primary loop of HTR-10 as well as the production and discharge amount of 14C in HTR-10. The average thermal neutron fluxes in the core, graphite reflectors, and carbon bricks are derived from the reactor physics calculation. The porosity of matrix graphite and the irradiation-induced porosity changes are roughly known, which may lead to the overestimation of the 14C production in the primary loop. However, current experimental data indicate that the activity concentration of 14C in the primary loop of HTR-10 is rather low. This is the reason that in one short-duration run downstream the copper oxide bed 14C could not be detected. Thus, multiple measurements over an extended period of time to derive the activity concentration of 14C in the primary loop of the reactor in a statistical way should be performed to supply more reliable information.
CONCLUSION
Various 14C source terms in HTR-10 have been explained and calculated in detail, more specifically, the production amount in the reactor core, the constitution amount in the primary loop, the reduction amount, and the various types of release amount. An experimental system for measuring the 14C activity concentration was designed, constructed and implemented in the HTR-10 primary loop to collect 14C from the primary coolant at three locations: (1) upstream of the dust filter, (2) downstream of the copper oxide bed, and (3) downstream of the molecular sieve adsorber.
The activity concentration of 14C in the HTR-10 primary loop was measured to be 1.2(1) × 102 Bq/m3 (STP) downstream of the copper oxide bed. This information was acquired using the newly built experimental system during the HTR-10 operation in 2015. That was the first time the activity concentration of 14C in the HTR-10 primary loop was experimentally determined. Compared to AVR, the data collected for HTR-10 were found to be five orders of magnitude lower. Two main reasons for these differences were proposed: (1) the amount of nitrogen impurities in the AVR primary loop was supposed to be higher compared to HTR-10, and (2) the operational temperature in the core of the AVR was considerably higher compared to HTR-10 in 2015, which promotes the corrosion of graphite.
The calculations for the activity concentration of 14C in the primary coolant of HTR-10 have overestimated the experimentally determined values by a factor of five. The content of nitrogen impurities in graphite and the characteristics of the graphite structure, such as porosity and ratio of close pores, can greatly affect the activity concentration of 14C in the primary coolant. However, we emphasize that multiple measurements during longer periods of time should be performed in future studies to derive the activity concentration of 14C with a math statistical basis.
In summary, we performed a successful 14C sampling from the primary loop of HTR-10. A theoretical calculation method for the 14C source term analysis was proposed and it proved to be conservative compared to the experimental values. From these conservative calculations, the emission of 14C per year from gaseous effluents of HTR-10 was significantly smaller than the regulated limit, i.e., as given in the Chinese National Standard GB6249-2011. The current research results can provide an in-depth understanding of the 14C source terms in HTR-10, supply experimental data for the radiation safety evaluation of HTR-10, and eventually promote 14C studies for commercial-size HTGRs.
ACKNOWLEDGMENTS
This work was supported by the National Natural Science Foundation of China (No. 11575099), the Tsinghua University Initiative Scientific Research Program (No. 20151080375), the Chinese National S&T Major Project (Grant No. ZX069), and the National High Technology Research and Development Program of China (863) (2014AA052701). The collaboration with Massachusetts Institute of Technology (MIT) was supported by 2016-2017 MISTI Global Seed Funds. We are grateful for the experimental setup support from Mr. Yue Pi, Mr. Shouang Wang, Mr. Yi Xu, and Mr. Ling Liu in INET, Tsinghua University, Beijing, China, and fruitful discussions with Mr. Zhenming Lu at INET, Tsinghua University, Beijing, China, and Dr. Karl Verfondern at the Research Center Juelich, Germany.