Introduction
Evidence from a UK Department of Health census has shown a gradual decline in the number of children undergoing grommet insertion between 1994 and 2005.1 In the UK, there is currently pressure on Primary Care Trusts to avoid funding procedures which have a limited evidence base. In the field of otorhinolaryngology, tonsillectomy and grommet insertion have been described as procedures which fall into this category, and several Primary Care Trusts have produced individual policies limiting funding for grommet insertion.2–4 Thus, there is now an emphasis on assessing the evidence that these procedures provide measurable benefit to those children undergoing them.
The National Institute for Health and Clinical Excellence guidelines published in February 2008 made explicit recommendations regarding those children likely to benefit from surgical intervention, imposing a three-month ‘wait and watch’ period and specific audiometric criteria.5
Many authors have assessed the outcomes of grommet insertion. The primary outcome measure is hearing benefit. This has traditionally been measured by air conduction pure tone audiometry; therefore, such assessment forms the basis of the majority of evidence to date.
Prior to undertaking our current research, the most authoritative study was a Cochrane review performed in 2005.Reference Lous, Burton, Felding, Ovesen, Rovers and Williamson6 This was a systematic review of all randomised, controlled trials evaluating the effect of grommet insertion on hearing, duration of effusion, development of language, cognition, behaviour and quality of life. Regarding hearing outcomes, the reviewers found that mean hearing levels improved by 9 dB (95 per cent confidence interval (CI) 4–14 dB) after the first six months, and by 6 dB (95 per cent CI 3–9 dB) after 12 months. The reviewers concluded that, from the current evidence, the benefits of grommet insertion appeared small, but they acknowledged that this was at odds with the dramatic improvement frequently reported by parents. With reference to the speech audiogram, it should be noted that an improvement of 9 dB may in fact have a very significant impact on the child's ability to discriminate speech, which may explain the improvement noted by parents.Reference Browning, Rovers, Williamson, Lous and Burton7 The Cochrane reviewers stated that more work was needed, particularly investigation to identify any subgroup which might benefit more significantly. The role of speech in noise testing was also identified as a potential area of research.
This Cochrane review was updated in 2010.Reference Martin8 There were similar findings with respect to pure tone hearing improvement. One of the concluding points specifically addressed the possible role of speech in noise testing in the evaluation of hearing benefit ‘…as it may more accurately reflect the child's disability’.
Pure tone audiometry has limitations as it provides a measure only of the child's ability to detect single, threshold tones in a quiet environment. It provides no information about the child's ability to handle supra-threshold sounds, or how well the child can discriminate between sounds.
Speech testing, particularly when conducted with background noise, is a more realistic test of a child's hearing in real life situations, such as the classroom, and therefore is likely to provide a better measure of auditory ability. It has been shown that children with otitis media with effusion are worse at identifying words in the presence of other, competing sounds.Reference Jerger, Jerger, Alford and Abrams9
The use of speech in noise testing in assessing childhood hearing has been limited. It can be time-consuming, and may require significant personnel and equipment. The ability of this type of test to show significant results may also be limited by test–retest variability, which can make it difficult to gain statistically significant results when comparing two sets of tests.Reference Martin10
In the research setting, speech in noise testing has been used in one arm of the Medical Research Council multicentre otitis media study group.11 Given the ages of the children in this study, the McCormick toy test was used. The authors found that baseline speech in noise scores predicted hearing performance after grommet insertion; in particular, they found that children with the worst baseline scores benefitted most from surgical intervention.
Signal to noise ratios describe the difference between the decibel levels of the sound presented (e.g. a teacher's voice) and the background noise. This difference is crucial as it determines speech intelligibility. In the classroom, signal to noise ratios in the range of −7 to +5 dB have been measured, despite the fact that it has been suggested that children require a signal to noise ratio of +15 dB to hear reliably.Reference Arnold and Canning12–15 The position of the child in the classroom is also an important factor, as the volume of the signal reduces with increasing distance from the teacher. The inverse square law states that the signal volume drops 6 dB for every doubling of the distance between pupil and teacher.
We designed a study to test the feasibility of using speech in noise testing in children before and after grommet insertion. We hoped to start to address the question of whether this type of audiometric testing may provide useful evidence in assessing hearing benefits following grommet insertion.
Materials and methods
Twelve children aged six years and above were identified via the pre-operative assessment clinic as having been scheduled for bilateral grommet insertion with or without adenoidectomy. After completing their routine pre-operative tests, they were asked to complete a further hearing test.
We used Arthur Boothroyd word lists for hearing testing.Reference Boothroyd16 These were developed in 1968 and have been widely used and validated. They comprise isophonemic, 10-word lists, with each word consisting of a vowel consonant vowel combination. Scoring is done phonemically, i.e. 1 point for each correct phoneme, to give a total score for each list out of 30. Each word is made up of 3 phonemes, therefore the minimum score is 0 and the maximum score 3. For example, if the word was ‘ship’, a response of ‘ship’ would earn 3 points, ‘shop’ 2 points, ‘chop’ 1 point and ‘duck’ 0 points.
Testing was carried out in a soundfield provided in an out-patient clinic room with background noise levels of 30–35 dB. The same room was used for all testing in order to provide a consistent environment.
Equipment
The speech materials used had been developed for an earlier study investigating the effect of age and gender on children's speech discrimination in noise (G Kirk, unpublished data). This study had involved 40 otologically normal children and had enabled standardisation of the speech test materials.
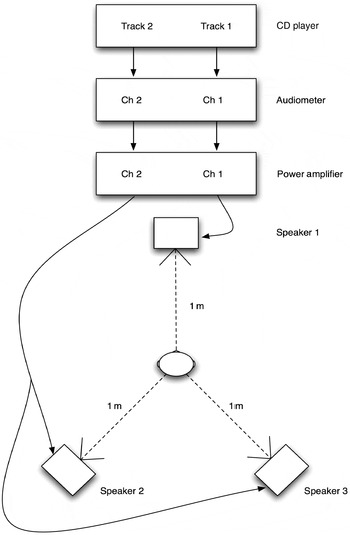
A recording of the Arthur Boothroyd word list was made by recording a senior speech and language therapist reading the Arthur Boothroyd word lists one to eight. A babble recording was made by recording 6 11-year-old children (3 girls and 3 boys) talking in a classroom. Both recordings were then reworked to ensure a maximum variation of ±2 dB. The word list and babble recordings were then copied such that each Arthur Boothroyd word list (i.e. lists five to eight) played on one track while the babble recording played on a second, concurrent track. Exactly the same babble recording was used for each of these tracks. During testing, the tracks were played on a Sony Walkman compact disc player (Sony, Tokyo, Japan) connected to the inputs of a Kamplex AD27 clinical audiometer (Kamplex, London, UK). The sound field outputs of the audiometer were connected to three Fostek 6301B Personal Monitor loudspeakers (Fostex, Tokyo, Japan). Sound field measurements were made using a Tenma 7206635 sound level meter (Tenma, Dayton, Ohio, USA) held in the position where the child's head would be. Calibration signals, pre-recorded onto the compact disk, were used for speech and babble signals to enable accurate arrangement of the sound field. The equipment was connected so as to allow independent control of the speech signal and the babble signal.
The child was seated in a chair positioned exactly 1 m from a speaker (speaker 1) positioned at head level directly in front of the child. Speakers 2 and 3 were positioned 1 m behind the child to the left and right (see Figure 1). Testing was carried out by the first author (VP), following training by GK.
Schematic diagram of the arrangement of equipment used in speech in noise testing. CD = compact disc; Ch = channel

Testing
For testing in ‘quiet’ conditions, word list one or two was played through speaker 1 at 60 dB. The other speakers were turned off. The following instructions were given to the child by the tester.
The lady is going to say some words. I want you to tell me what you hear. Let's have a practice: ‘dog’, ‘limp’. Don't worry if you're not sure, just tell me what you think you hear.
The child then repeated each word after it had been read. The tester noted the score obtained for each word, giving a final score out of 30.
For ‘speech in babble’ testing, speakers 2 and 3 were turned on. Babble was played through these speakers at the appropriate level: 50 dB for a signal to noise ratio of +10, 60 dB for a signal to noise ratio of 0 and 70 dB for a signal to noise ratio of −10. One of the word lists five to eight was played at each noise level. The choice of which list to read in which sound condition was made at random. The following instructions were given to the child.
Now you will also hear some children talking behind you. Try to keep listening carefully to the lady. It might be more difficult to hear some of the words. Just tell me what you hear.
The children were asked to perform the task at background noise levels of 50 dB (a signal to noise ratio of +10) and 60 dB (a signal to noise ratio of 0). If they were able to continue (dependent on age, concentration and hearing), they were also asked to complete the task at 70 dB background noise (a signal to noise ratio of −10).
This set of tests was carried out on the day of the child's pre-operative visit. This was within 3 weeks prior to surgery for all children. The tests were repeated at their first routine post-operative visit. This was between 6 and 11 weeks post-operatively. At this visit, each child also had a pure tone audiogram and was reviewed by the first author to ensure that their grommets were in situ and patent.
Results and analysis
The 12 children were aged between 6 and 9 years. There were 7 girls and 5 boys. They all underwent bilateral grommet insertion, involving 10 Shah grommets (Exmoor, Taunton, UK) and 2 Permavent grommets (Exmoor, Taunton, UK). Eight of the children were undergoing their first grommet insertion, two their second, one their third and one their fourth. Four children also underwent adenoidectomy.
Seven children completed the hearing task in all four listening conditions both before and after surgery. Three children were able to complete the hearing task in quiet conditions and also against a signal to noise ratio of +10 and 0, both pre- and post-operatively. One child completed the task in quiet conditions and also against a signal to noise ratio of +10 pre-operatively. The final child could only complete the task in quiet conditions pre-operatively. This was because these latter two children stated that they were unable to hear anything at all and therefore gave up the hearing task at that point. Both these children were able to complete the task in quiet conditions and against a signal to noise ratio of +10 and 0 post-operatively.
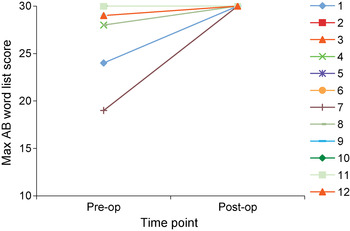
Figure 2 shows the children's results in quiet listening conditions. All children scored full marks (i.e. 30 out of 30) post-operatively. The majority also scored well pre-operatively, with only 2 scoring below 25. (Note that, as the scores were clustered around values of 28 to 30, most individual symbols in this graph are not clearly visible.)
Pre- and post-operative (pre- and post-op) Arthur Boothroyd (AB) word list scores in quiet conditions, for each individual, numbered child. Max = maximum

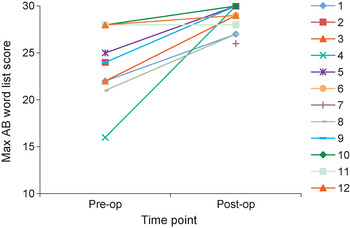
Figure 3 shows results for hearing in 50 dB background noise (giving a signal to noise ratio of +10). As expected, scores were poorer in the presence of background noise than in quiet conditions. Post-operative scores were better than pre-operative scores.
Pre and post-operative (pre- and post-op) Arthur Boothroyd (AB) word list scores in 50 dB background babble (a signal to noise ratio of +10), for each individual child. Max = maximum

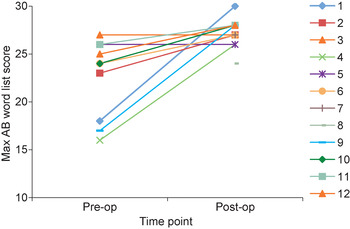
Figure 4 shows results for hearing in 60 dB background noise (giving a signal to noise ratio of 0), while Figure 5 gives results for hearing in 70 dB background noise (giving a signal to noise ratio of −10). As explained earlier, several children were unable to complete the hearing task at these noise levels; therefore, fewer symbols appear on these graphs. For those children who completed the task only post-operatively, symbols are included. Again, there was a trend toward post-operative improvement.
Pre- and post-operative (pre- and post-op) Arthur Boothroyd (AB) word list scores in 60 dB background babble (a signal to noise ratio of 0), for each individual child. Max = maximum

Pre and post-operative (pre- and post-op) Arthur Boothroyd (AB) word list scores in 70 dB background babble (a signal to noise ratio of −10), for each individual child. Max = maximum

Figure 6 shows the mean air conduction hearing improvement seen on pure tone audiometry (at 0.5, 1, 2 and 4 kHz), together with the mean improvement in Arthur Boothroyd word list score, for speech in noise, comparing pre- and post-operative values. There was no correlation between the two results, suggesting that they assessed different hearing parameters.
Comparison of mean air conduction (AC) hearing improvement on pure tone audiography and mean improvement in Arthur Boothroyd (AB) word list score, for each individual child, comparing pre- and post-operative values.

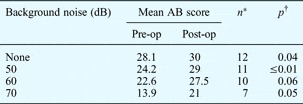
Table I shows the number of children who completed the hearing task in each listening condition, and the mean scores achieved. As expected, the scores became progressively lower as increasing levels of background noise were added. In all listening conditions, the post-operative scores were better than the pre-operative scores. Application of the Mann–Whitney U test (used because data were non-parametric) indicated that these differences were statistically significant in all conditions except 60 dB background noise (a signal to noise ratio of 0).
Mean AB word list score by background noise level

* Number of children who completed the test.
† Mann–Whitney U test. AB = Arthur Boothroyd; pre-op = pre-operative; post-op = post-operative
When analysing data for each listening condition, we only included results for those children who completed the test in that condition, both pre- and post-operatively. This is likely to have resulted in an under-estimation of the improvement in speech in noise, as those children who could not complete the task in 50 dB background noise (a signal to noise ratio of +10) or 60 dB background noise (a signal to noise ratio of 0) pre-operatively stated that they could not hear anything, at which point they lost interest or became distressed and did not continue. It was therefore decided to consider these tests abandoned and void, rather than giving a score of zero, which may not have been a true reflection of the child's ability. Post-operatively, these same children were all able to complete the hearing task in these same levels of background noise with good scores, suggesting a very marked improvement.
Discussion
Our results indicate that the children's performance in speech in noise testing improved following grommet insertion. This was most evident in those children unable to complete the task pre-operatively; these children achieved high scores post-operatively. This is in keeping with the findings of the Medical Research Council trial, which suggested that those children initially showing particularly poor speech hearing scores tended to do better following grommet insertion.11
Clearly, the significance of our results is limited by the small numbers in our study, particularly in conditions of 60 and 70 dB background noise (signal to noise ratios of 0 and −10, respectively) as smaller numbers of children were able to complete the hearing task in these conditions.
Assessment of the test–retest reliability of Arthur Boothroyd word list scoring suggests that there are limitations as regards inferring significance to differences between scores for two tests for an individual.Reference Browning, Rovers, Williamson, Lous and Burton7 Despite this, application of the Mann–Whitney U test to the group score results indicated the presence of a statistically significant difference between pre- and post-operative results, for all but one listening condition.
It may be appropriate to apply this form of hearing assessment in a larger trial, and this may provide more robust evidence that grommet insertion does lead to benefits in hearing performance in hearing environments such as those found in the classroom. The benefits of grommet insertion may not be accurately assessed or demonstrated by the pure tone audiometry routinely used for such assessment.
Speech in noise testing may not be practical for routine assessment of all children in a busy ENT and audiology out-patient clinic. However, once the test materials have been created and the equipment arranged, the test itself takes approximately 15 minutes to complete, comparable to the duration of a pure tone audiogram. At this stage, speech in noise testing is recommended primarily as a research tool to more accurately assess the improvement in auditory ability following grommet insertion.
• Public funding for grommet insertion is being increasingly limited
• Pure tone audiometry evidence of hearing benefit is limited
• However, auditory disability is better assessed by speech in noise testing
• Such testing is feasible before and after grommet insertion
• This study found significant post-grommet hearing benefit in children thus tested
Our study group comprised children undergoing their first, second, third or fourth grommet insertions. Furthermore, not all received the same type of grommets, and several underwent adenoidectomy in addition to grommet insertion. The group size was too small to allow separate examination of the additional effect of adenoidectomy, and this may be an area of relevance for further studies.
Post-operative testing was performed early (6 to 11 weeks) after grommet insertion. As seen in the Cochrane review, this is the period of maximal hearing benefit when compared with controls. In future work, it would be necessary to follow up the children for a longer period and to include a control group to provide comparative data.
Conclusion
This study suggests that it is possible to design and implement speech in noise testing to assess hearing outcomes following grommet insertion. The small population in this study showed evidence of significant hearing benefits following grommet insertion; this outcome may not be reflected by the current method of audiological testing. Such hearing benefits are likely to translate into an educational advantage for children in the classroom setting, and may represent important evidence in the current discussion on the benefits of grommet insertion.