I. INTRODUCTION
Carbon nanotubes are highly regarded for their potential applications, particularly in electronics, due to their excellent electrical, thermal, and mechanical properties. The use of individual nanotubes as electronic components, such as transistors or interconnects, is the subject of many efforts, but significant challenges in selective placement and isolation of metallic or semiconducting nanotubes remain hurdles to large-scale use. Vertically aligned arrays of multiwall carbon nanotubes (MWNTs), however, do not suffer from the same challenges and have been proposed as possible materials for a variety of applications such as field emission, Reference Saito and Uemura1 biosensors, Reference Sotiropoulou and Chaniotakis2 and thermal interface material. Reference Liu, Jiang, Fu and Wang3 Aligned arrays of MWNTs have been fabricated by techniques such as thermal Reference Fan, Chapline, Franklin, Tombler, Cassell and Dai4 or plasma-enhanced chemical vapor deposition (CVD), Reference Ren, Huang, Xu, Wang, Bush, Siegal and Provencio5 but the resulting MWNTs tend to suffer from one or more of the following drawbacks: entanglement, varying heights, lack of density control, and poor crystalline quality. Template-guided CVD growth using anodized aluminum oxide (AAO) nanopore templates offers a means to mitigate these limitations.
By employing an AAO template to guide nanotube growth, one is able to control the diameter, length, and density of MWNTs simply by tailoring the template geometry. This is done by selecting the thickness of the Al film to be anodized, adjusting the anodizing conditions, and/or chemically widening the pores after anodization. Additionally, the physical constraint of the AAO template keeps the nanotubes from bundling or tangling together. If the nanotubes grow beyond the height of the template, they can be cut to uniform heights with ultrasonication Reference Jeong, Lee, Lee, Oh and Park6 or physical etching, such as ion milling or mechanical polishing. MWNTs grow in AAO templates in one of two ways. The first is by depositing amorphous carbon on the internal surfaces of the AAO template by high temperature pyrolysis of a carbon feed gas followed by a graphitization step. Reference Li, Papadopoulos, Xu and Moskovits7,Reference Suh and Lee8 Such carbon tubes have poor crystallinity, do not extend above the AAO surface, and necessarily have identical diameter, length, and density to the AAO template pores. The second method is by CVD growth of MWNTs from catalyst stubs electrodeposited in the bottom of the AAO pores. Reference Jeong, Hwang, Lee and Jeong9–Reference Sklar, Paramguru, Misra and LaCombe11 Nanotubes resulting from the latter process have higher as-grown crystalline quality, extend above the AAO surface, and have an MWNT site density which can vary between 0–100% of the template pores depending on template preparation and MWNT growth conditions. For these reasons, the catalyst-originated growth is advantageous for applications of MWNT arrays and is the subject of this work.
AAO templates for CVD growth of MWNTs are typically prepared by two-step anodization of an electropolished Al sheet. This process results in a barrier oxide at the bottom of the pores that interferes with both the controlled electrodeposition into the pores and the quality of the electrical contact to the resulting MWNTs in the array. Additionally, the use of Al sheets limits possible applications if a different substrate is desired due to electrical or thermal conductivity requirements. In this work, we prepare AAO templates on substrates with control over the catalyst site density. Furthermore, we demonstrate Ohmic back contact to MWNTs grown from the pores, even after ultrasonic cutting of the nanotubes. These results create a viable route for electrically or thermally active arrays of vertically aligned MWNTs on arbitrary substrates.
II. EXPERIMENTAL PROCEDURE
A. Template and catalyst preparation
The AAO templates used in this study are prepared on polished sapphire substrates, but templates prepared from films deposited on top of other substrates such as silicon and aluminum were also demonstrated with an identical procedure. No differences in MWNT growth or template stability were found between arrays grown on the various substrates. A benefit of this approach is that it can be applied to a variety of substrates that may be selected for their electrical and/or thermal properties, depending on the intended application. The substrate is first coated with a 100-nm thick W film, followed by a 1- to 2.5-μm thick film of 2 wt% Nd-doped Al, each deposited by RF magnetron sputtering. It is critical to optimize sputtering conditions to minimize the residual film stresses and prevent the evolution of extremely rough surfaces or even film cracking and peeling. This is done by measuring the curvature of a 2-inch Si wafer before and after film deposition for a range of sputtering pressures and powers at a given sample to target spacing. Reference Siegal, Overmyer and Kaatz12 A rough surface is problematic for template formation because the pores form perpendicularly to the local film surface. Using Nd-doped Al instead of pure Al further allows for a smooth, shiny surface, even after exposure to air. Reference Oh and Thompson13 These steps eliminate the need to electropolish the Al film or use a two-step anodization process. Reference Jeong and Lee14 After Nd-doped Al deposition, the films are removed from the chamber and one edge is masked off for sputter deposition of a 0.4-μm-thick Ti strip to serve as an electrical contact for the anodization and electrochemical deposition of the catalyst.
The Nd-doped Al films are anodized as described elsewhere. Reference Limmer, Yelton, Siegal, Lensch-Falk, Pillars and Medlin15 Briefly, films are anodized at 40 V at 1 °C in a 3 wt% oxalic acid solution agitated by bubbling air. A digital multimeter logs the current, which is terminated when the current dips by ∼10–50% from its steady state value, indicating that oxidation has reached the W underlayer. The resulting WO3 layer is removed from the pore bottoms by soaking in a 0.2 M pH 7 phosphate buffer for 10–120 min, resulting in an electrically conductive bottom W contact to all of the nanopores. The pores are then widened from ∼45 nm to ∼75 nm diameter by etching in 5 wt% H3PO4 solution for 20 min at 30 °C. Finally, cobalt is deposited to the desired thickness from a bath of 1 M CoSO4 and 0.4 M H3BO3 at −0.8 V versus Ag/AgCl with a Pt mesh counter electrode.
B. Carbon nanotube growth and characterization
After Co deposition, the AAO templates are ready for MWNT growth. Nanotubes were grown by thermal CVD in a tube furnace at atmospheric pressure similar to processes reported for the growth of highly crystalline MWNTs on flat substrates. Reference Siegal, Overmyer and Provencio16,Reference Siegal, Overmyer, Provencio and Tallant17 The furnace is ramped to 600 °C in a flowing mixture of 17% H2 in N2 with a total flow rate of 240 sccm. After 10 min at 600 °C, 20 sccm C2H2 is introduced to the existing gas flow. After 20 min, the H2 and C2H2 are turned off, the N2 flow is turned up to 2000 sccm, and the samples are furnace-cooled to room temperature before removal for characterization. The as-grown MWNT arrays are studied with scanning electron microscopy (SEM) and Raman spectroscopy. All Raman measurements are obtained with a WiTec alpha300R Raman system employing a 100x/0.95 NA objective to focus a 532 nm laser. Power levels are chosen to ensure no damage to the MWNTs.
C. Nanotube array planarization and characterization
The as-grown MWNT arrays are cut to a relatively uniform height above the AAO surface by an ultrasonic cutting technique. Reference Jeong, Lee, Lee, Oh and Park6 The as-grown sample with overgrown nanotubes protruding from the AAO is submerged in 5 mL of acetone in a 50-mL beaker and placed in a 40 kHz ultrasonic bath for 1 min. This process cuts the MWNTs at a preferential height above the AAO surface and disperses the cut segments of the MWNTs in the acetone solution. The AAO/MWNT array is then rinsed with isopropanol and dried in flowing nitrogen. The cut MWNTs liberated into the solution are dip cast onto Si substrates for further analysis with Raman spectroscopy. The planarized MWNT array is studied with conductive atomic force microscopy (c-AFM) using conductive Pt tips (RMN-25PT300B, Bruker) in ambient conditions in a hybrid system composed of a Digital Instruments Dimension 5000 AFM head interfaced with a Nanotec Dulcinea control system. Nanotec WSXM SPM software is used to control the AFM head and process the acquired images. Reference Horcas, Fernández, Gómez-Rodríguez, Colchero, Gómez-Herrero and Baro18
III. RESULTS AND DISCUSSION
A. WO3 etch and Co site density
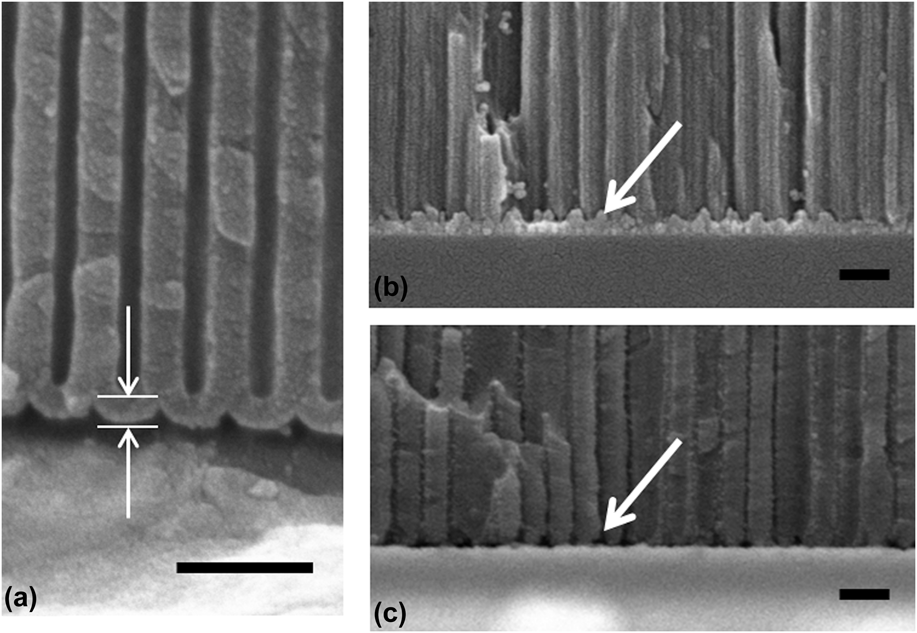
To grow an array of MWNTs in AAO with maximum site density, one must start with near 100% Co site density. The key to achieving this is the W underlayer. When Al is anodized it results in a test tube-like structure with a barrier oxide thickness similar to the wall thickness at the bottom of the pores above the underlying substrate or unanodized metallic aluminum, as marked with arrows in Fig. 1(a). To successfully electrodeposit catalysts at the pore bottoms, this barrier oxide should be as thin and uniform as possible. For MWNT array applications, this is normally achieved via barrier thinning by decreasing the applied anodization voltage Reference Sklar, Paramguru, Misra and LaCombe11 and a pore-widening step, if desired. If an underlayer is used that oxidizes under the same conditions as the Al film and has a higher ionic conductivity than alumina, as W does, the underlayer's oxide will grow into the pore and form an oxide plug. Reference Oh and Thompson13,Reference Limmer, Yelton, Siegal, Lensch-Falk, Pillars and Medlin15 This is shown in Fig. 1(b), where the arrow points to one such WO3 plug. By selectively etching the WO3 plug, the underlying metallic W is exposed at the pore bottoms, as shown in Fig. 1(c). This metallic underlayer facilitates electrodeposition of the Co catalyst and provides a backside electrical contact, even on an insulating substrate.
(a) SEM image of the test tube-shaped pore structure and barrier oxide at the pore bottoms after anodizing an Al film without a W underlayer. The barrier oxide is marked by arrows. (b)–(c) SEM images of the tungsten/pore bottom interface before and after etching of the WO3 plug, respectively. The arrows point to an example WO3 plug and a resulting void after removal. All scale bars are 200 nm.

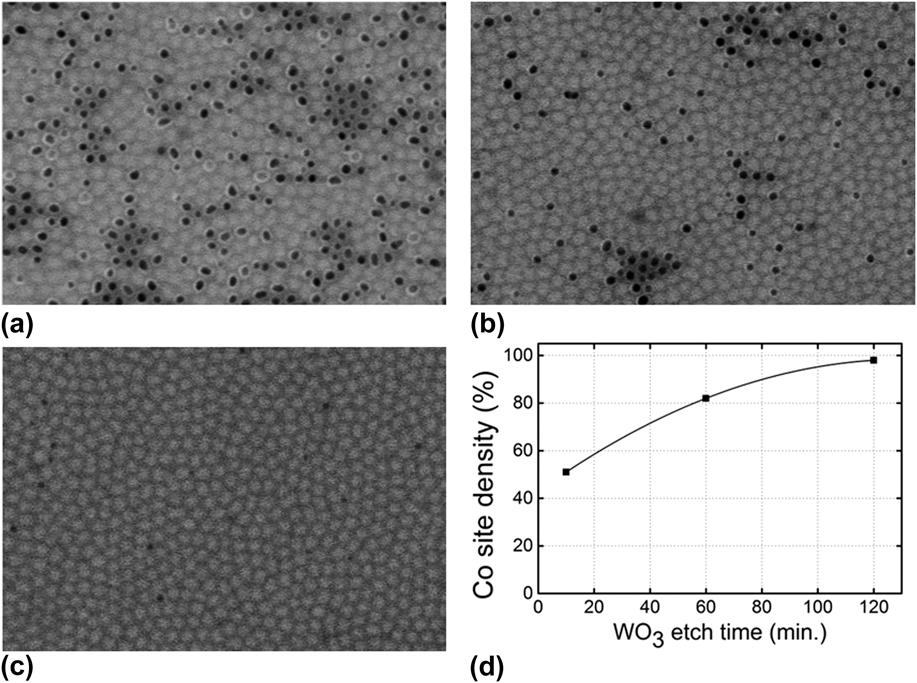
To investigate the Co site density resulting from the W underlayer technique, ∼750 nm Co was electrodeposited into the pores followed by ion milling of the AAO surface in a Precision Ion Polishing System (Gatan) at an ion beam angle of 2°. A Co height of 750 nm was determined to yield reliable MWNT growth, which is discussed further in Sec. III. B. The ion milling, which etches a wide-angle cone as the sample rotates, continues until the AAO in the center of the cone is completely removed. In this configuration, SEM easily distinguishes between the filled and empty pores along the etched cone since the surface of the AAO and the Co nanowires are now flush with each other. The Co-containing pores appear bright relative to the empty pores. Furthermore, we can gain some insight into the height uniformity of the Co nanowires by comparing the fraction of full and empty appearing pores, as we image radially out from the center of the etched cone.
For a given distance from the etched cone center, the apparent pore filling ratio is constant. SEM images in this regime for WO3 etch times of 10, 60, and 120 min are shown in Figs. 2(a)–2(c). Etch times longer than 120 min and up to 15 h yield neither further improvement nor template failure upon Co electrodeposition. The 10-min etch time leaves both empty, isolated pores surrounded by full pores as well as clusters of empty pores. Increasing the etch time to 60 min decreases the number of clusters and the total number of empty pores. After 120 min, all empty pore clusters are eliminated, with only a few isolated empty pores remaining. Figure 2(d) shows the Co site density as calculated from representative SEM images for each of the three WO3 etch times. With this technique, the upper limit of Co site density is ∼98%. Controlling the WO3 etch time, therefore, provides a new technique to tune the site density of the Co catalyst and thus that of the MWNTs. This approach is also relevant for controlling the fabrication of nanowire arrays of other materials using AAO templates.
(a)–(c) Representative SEM images of Co site density in ion-milled pores for 10-, 60-, and 120-min WO3 etch times, respectively. Scale: pore diameter is 75 nm. (d) Co site density versus WO3 etch time. The line is a guide to the eye.

B. Carbon nanotube growth and characterization
When C2H2 is introduced to the CVD furnace at temperature, there are two competing processes: (i) CVD growth of carbon nanotubes from the Co catalyst and (ii) amorphous carbon deposition via C2H2 decomposition on the AAO surfaces. Reference Chen, Chang, Kuo and Pan19,Reference Lee, Gu, Kim, Jeong, Bae and Suh20 Catalytic CVD growth of MWNTs from Co under experimentally similar conditions is known to occur by tip, as opposed to base, growth, evidenced by transmission electron microscopy imaging of Co particles at the ends of MWNTs, which emerge from the pores. Reference Chen, Chang, Kuo and Pan19 However, as the amorphous carbon deposits on the pore walls, it can prevent upward lifting of the Co catalyst, halting MWNT growth and leaving short MWNTs inside the pores. MWNTs that do emerge from the pore openings are free to continue growing longer with time. Adding H2 to the gas mixture during nanotube growth has been systematically shown to etch away amorphous carbon and help MWNTs emerge from the pores. Reference Chen, Chang, Kuo and Pan19 In addition to blocking the Co particle uplift, if the concentration of the carbonaceous feed gas is too high, the Co catalyst can be deactivated by amorphous carbon deposition. This results in shorter MWNTs above the AAO surface at which point amorphous carbon growth on the AAO is no longer interfering with the MWNT growth. Decreasing the aspect ratio of the open pore above the Co catalyst is another technique to increase the fraction of pores producing MWNTs. Varying the aspect ratio by more than a factor of 4 was shown to vary the emerging MWNT density by 4 orders of magnitude, underscoring the sensitivity of this competition. Reference Jeong, Lee, Lee, Oh and Park10
All of these mechanisms are relevant to this work. The presence of amorphous carbon on the AAO surface is confirmed by Raman spectroscopy (not shown) of an AAO template that underwent an identical CVD process without the Co catalyst. Additionally, a maximum aspect ratio ∼10 was established as necessary for at least 1% emerging MWNT site density as determined by SEM imaging. Explicitly stated, for the pore diameter of 75 nm used in this work, the depth of the open pore above the Co needs to be less than 750 nm for MWNTs to emerge from the pores. Because the Al film expands by nearly 50% upon anodization, the deposited 1-µm thick Al film produces a 1.5-μm thick AAO template and requires electrodeposition of 750 nm of Co. Using a thinner template layer decreases the pore aspect ratio linearly for a given Co deposition height, but it is observed that a minimum AAO thickness is necessary for structural integrity of the AAO array following dense MWNT growth. Templates thinner than 1 µm tend to have regions of delamination after MWNT growth due to stress on the template from the presence of MWNTs in the pores. Using a thicker Nd-doped Al layer together with longer electrodeposited Co catalyst nanowires mitigates this problem. However, with longer electrodeposition times, it becomes increasingly important for the pore bottoms to have uniform electrical contacts with the underlying W metal to ensure Co height uniformity. Catalyst overgrowth of even a small percentage of the pores results in uncontrolled carbonaceous growth that is detrimental for the practical use of MWNT/AAO arrays. The implementation of the W layer and attention to WO3 etch times described above provide the necessary uniformity.
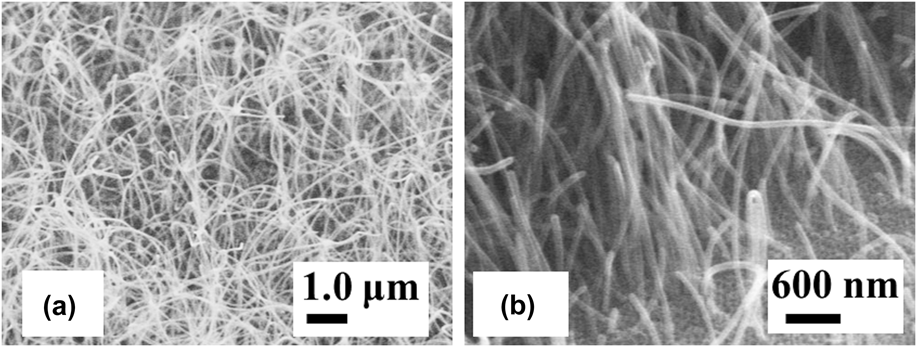
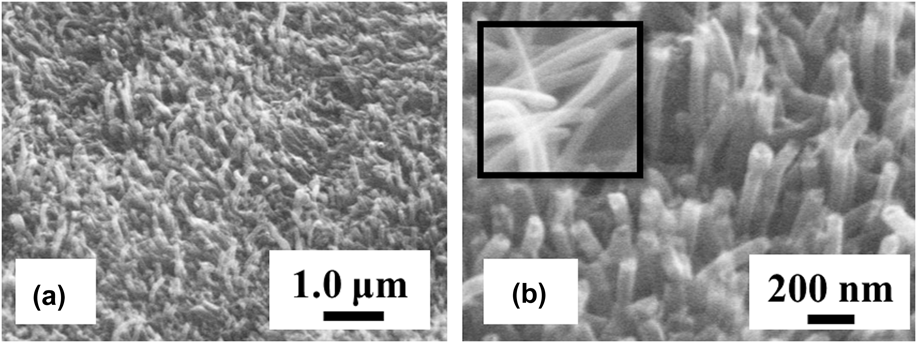
SEM images of the as-grown MWNT arrays are shown in Fig. 3. Once the MWNTs emerge from the pore openings, they lose their lateral confinement and tend to take random gently curved paths resulting in a loosely intertwined network of MWNTs. However, the growth is generally free from kinks and bends, which are evidence of severe microstructural defects in the nanotubes. Figure 3(b) provides a magnified inspection near the AAO surface and reveals that MWNTs emerge from the pores straight and with uniform diameter; however, not every pore yields a nanotube. With further optimization of the gas composition and pore aspect ratio, higher MWNT site density should be achievable. Note that the MWNT diameters appear to be slightly larger than the pore opening, in agreement with previous reports. Reference Jeong, Lee, Lee, Oh and Park6,Reference Suh and Lee8
SEM images of (a) the MWNT array overgrowth above the AAO surface and (b) the MWNTs emerging from the AAO pore openings.

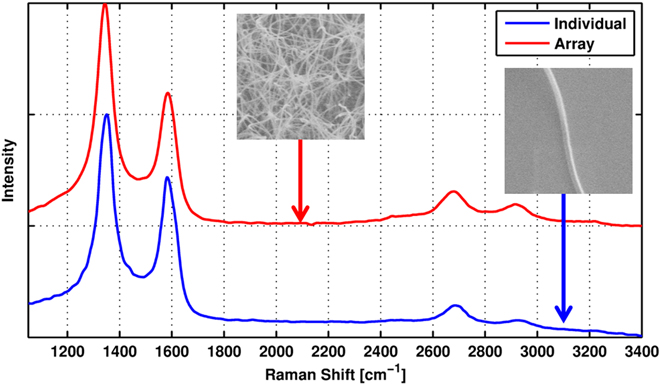
To gain insight into the crystalline quality of MWNTs resulting from this template growth process, Raman spectra are acquired on (i) the overgrown array and (ii) an individual tube dispersed on a silicon substrate after being sheared from the template during sonication. To obtain a representative sample, 200 separate spectral acquisitions of the overgrown array are gathered over a length scale of 100 μm. Since the AAO has a nominal pore size of 75 nm and the diameter of the Raman spot is ∼350 nm, the average spectrum shown in Fig. 4 resulting from these 200 acquisitions is the composite signal resulting from a sample of ∼1000 separate MWNTs. No appreciable change in the Raman signal was observed between any of the 200 acquisitions. In a similar fashion, investigation of an individual MWNT occurred via spectral acquisition every 30 nm over a 2 × 3-μm area. Little variation is observed over the 500 Raman spectra acquired across the nanotube. In addition, little variation occurred from tube to tube. Spectra extremely similar to that shown in Fig. 4 were acquired on 10 separately imaged individual MWNTs. Therefore, the average response shown in Fig. 4 is representative of the individual MWNT as a whole.
Raman spectra of the MWNT array overgrowth above the AAO and an individual MWNT cut from the same array overgrowth by ultrasonication. Insets show SEM images of the material sampled for each spectrum.
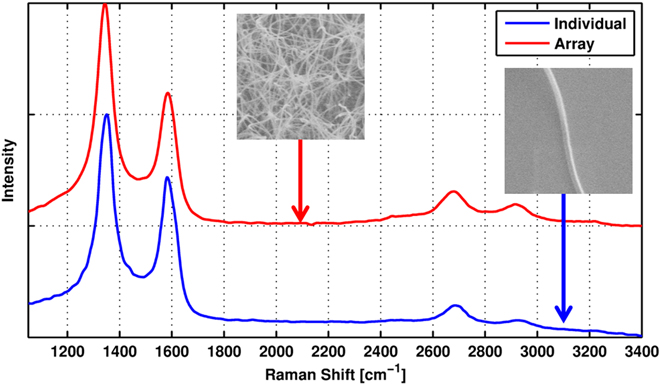
The Raman response of both the array and individual tube are marked by four distinct spectral features characteristic of MWNTs, namely the first order D (∼1350 cm−1) and G modes (∼1582 cm−1) along with the second order 2D (∼2677 cm−1) and D+G (∼2930 cm−1) modes. Reference Dresselhaus and Eklund21 While observation of the D and D+G modes is indicative of crystalline disorder, the persistence of the 2D-mode accompanied by an I(D)/I(G) ratio of 1.9 implies that this disorder is moderate and in line with previous reports of non-graphitized CVD-synthesized MWNT arrays grown without the use of templates. Reference Kang, Yoon, Kim, Hong, Han, Cha, Song, Jung, Lee and Kim22–Reference Chen, Chen and Chen25 Due to this similarity with reported non-templated growth, we conclude that use of the AAO template is to first order benign to the synthesis of the MWNTs. Furthermore, since the Raman spectrum of an individual tube is very similar to that acquired over an array of tubes, we deduce that the template approach results in nominally uniform MWNTs across the array. Note that it should be possible to improve the MWNT crystalline quality with a post-growth graphitization annealing step, Reference Mattia, Rossi, Kim, Korneva, Bau and Gogotsi26,Reference Huang, Wang, Luo and Wei27 which is the subject of ongoing work.
C. Nanotube array planarization and characterization
Figure 5 shows SEM images of the MWNT array in AAO after ultrasonication in acetone for 1 min, after which nearly every nanotube is cut to a few hundred nanometers above the AAO surface. For illustration purposes, a region with higher than average MWNT site density is shown. Because of the sensitivity of the MWNT density to the factors outlined in Sec. III. B, some variation may be observed across a given sample. The MWNTs do not fully support each other laterally, since their site density has yet to be optimized, and tend to clump together or lean over. In future work, this can be improved by drying the array in supercritical CO2. Reference Liang, Zhen, Zou and Xu28,Reference Limmer, Yelton, Erickson, Medlin and Siegal29 Figure 5(b) shows a higher magnification image of the ends of the cut MWNTs. The insert shows an image of the MWNT ends before cutting. By comparison, it is clear that the growth produces carbon nanotubes and that ultrasonication results in open-ended tubes.
(a) Low- and (b) high-magnification SEM images of a MWNT array after ultrasonic cutting. The inset in (b) shows the ends of MWNTs before ultrasonic cutting.

However, an open question remained as to whether or not ultrasonication degrades or destroys the electrical contact between the MWNT, the Co catalyst, and the W-coated substrate or even causes breaks in the MWNTs themselves inside the template. To answer this question, we used c-AFM to study the current path between the exposed MWNT tip and the W underlayer. For this measurement, contact to the W underlayer is made through the Ti strip that is located on one edge of the sample surface as mentioned above. The Ti strip makes contact with the W underlayer through the non-anodized Nd-doped Al that is under the strip. The W underlayer extends across the entire substrate and makes contact with every Co catalyst nanowire. Topological and current maps are acquired simultaneously in non-contact/intermittent mode using a conductive tip with a nominal spring constant of 18 N m−1. Non-contact mode is necessary due to mechanical damage and nanotube cleaving produced by physical contact between the tip and the MWNT. The tip will, however, have momentary contact with protruding MWNTs on the side of approach before the feedback is able to move the tip over the MWNT.
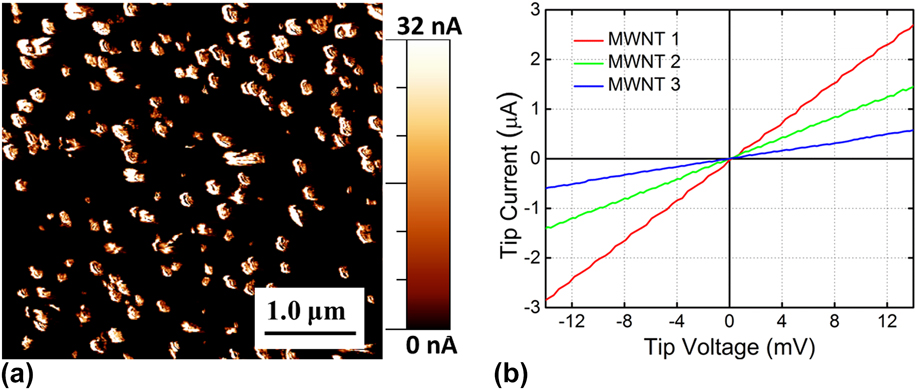
Figure 6(a) shows a current map generated by c-AFM. The current recorded varied between 0–250 nA with the highest current coming from a small number of hot spots. The current in the figure is cropped at 32 nA to increase the contrast and improve the clarity of the image. During current mapping, a static bias voltage is applied to the tip, and the current through the sample is recorded as a function of tip position. The current is only detected when the tip is in intermittent contact with a MWNT. As expected, no current is seen from the AAO. Intermittent contact occurs when the non-contact topological feedback begins to move the tip over the MWNT. Since the non-contact feedback is not perfect, there are brief moments when the tip touches the MWNT. This is verified by merging both the topological and current maps (not shown) to reveal that the current flow occurred at the approaching edge of the MWNT.
(a) Conductive AFM map of current between the top of the AAO/MWNT array and the underlying W layer. (b) I–V data from three individual MWNTs in the array showing Ohmic conduction through the MWNT, the MWNT-Co interface and the Co-W interface after ultrasonic cutting.
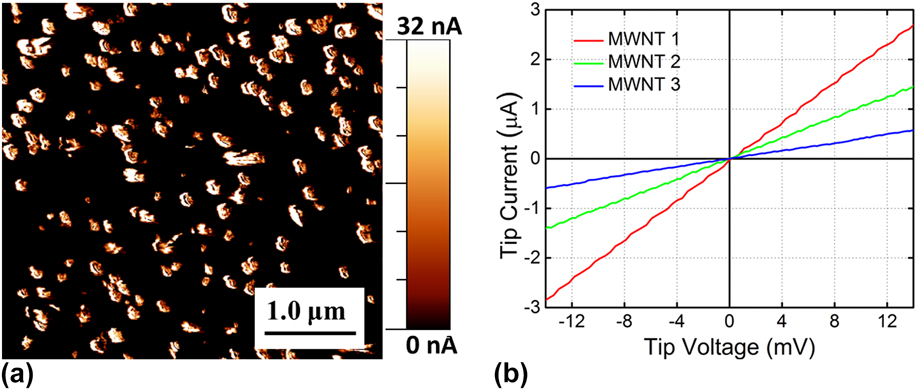
Figure 6(b) shows I(V) data collected on three individual MWNTs in contact mode with a loading force of ∼1.6 μN using the same tip as the non-contact imaging experiments. The electrical resistance varies from ∼5 to 25 kΩ, depending on the MWNT being measured. Recall from earlier in this section that this resistance includes the series resistance contributions of the unanodized Nd-doped Al under the Ti contact strip, W underlayer, and Co catalyst nanowire, as well as the contact between the metal layers, the contact between the Co and MWNT, and the contact between the MWNT and tip. In every case, Ohmic I(V) behavior is observed, implying that the W-Co and Co-MWNT interfaces have not been seriously compromised. This measurement does not explain the origin of the range of total resistance measured, but the contact resistance and contact geometries between individual MWNTs and the c-AFM tip are potential sources of variability. It is also not known how many shells contribute to the electronic conduction for each measurement and hence how many parallel current paths through the MWNT are in use. The MWNTs are open at the c-AFM tip end, suggesting that the tip could be in contact with several shells at once. However, if the tip is only in contact with the outermost shell, for instance from a MWNT edge, only that shell would contribute significantly to the conductivity since adjacent shells have negligible interlayer electronic coupling. Reference Collins, Arnold and Avouris30
Ohmic contact between the MWNTs and the underlying metal is a significant finding. One of the benefits of the W underlayer technique discussed above is the ability to have electrical contact to the entire MWNT array regardless of the chosen substrate's electrical properties. This offers flexibility in device design not possible when MWNT/AAO arrays are fabricated from Al sheets. Confirming the retention of Ohmic contact to the MWNTs after ultrasonic cutting allows for a simple, scalable technique to cut all MWNTs in the array to a uniform height. Good electrical contact also suggests the possibility of good thermal contact. Thermal conductivity of the MWNT arrays and the thermal interfaces between the MWNT and underlying substrate are not studied here but are the subject of an ongoing effort.
IV. SUMMARY
This article presents a technique to fabricate an array of vertically aligned, untangled MWNTs with uniform heights and Ohmic electrical contacts to an arbitrary substrate surface. This is done by growing nanotubes using Co catalysts deposited at the nanopore bottoms of an AAO template film prepared from sputtered Nd-doped Al directly on a W underlayer. The substrate may be selected based on the desired properties for a given application since the W underlayer provides the electrical access to the nanotubes. This W underlayer allows for nearly 100% uniform catalyst fill by eliminating the typical barrier oxide at the nanopore bottoms. Site density of the Co catalyst and hence the nanotube growth is controlled by varying the duration of the WO3 etch step. Growth by catalytic CVD results in MWNTs with uniform diameters and crystalline quality but varying lengths. However, the nanotube lengths can be trimmed to uniform heights above the template surface using ultrasonic cutting. The nanotube cutting technique retains Ohmic electrical contact between the nanotubes and the Co catalyst as well as to the tungsten underlayer, enabling whole-array electrical and thermal applications. Improving crystalline quality with postgrowth annealing, further optimizing the nanotube site density, and investigating the thermal conductivity of the arrays are the subjects of ongoing work.
ACKNOWLEDGMENTS
The authors thank Lyle Brunke for assistance with sputter depositions and Anthony McDonald for assistance in Raman spectroscopy measurements. This work is supported by the Laboratory Directed Research and Development program at Sandia National Laboratories. Sandia National Laboratories is a multiprogram laboratory managed and operated by Sandia Corporation, a wholly owned subsidiary of Lockheed Martin Company, for the U.S. Department of Energy's National Nuclear Security Administration under contract DE-AC04-94AL85000.