The first generation of African Americans to reach age 65 in the twentieth century could not afford to retire. The majority had grown up in slavery and left it with no accumulated wealth. In the South in the late nineteenth and early twentieth centuries, blacks had only 5.8 cents of wealth for every dollar of white wealth.Footnote 1 As Gunnar Myrdal wrote of African Americans in the 1930s, “Their incomes are not only low but irregular. They thus live from day to day and have scant security for the future.”Footnote 2 One group of African Americans was more fortunate in their old age—the veterans of the Union Army. These men became eligible for a pension that was a pure income transfer given regardless of own income, wealth, or labor force participation. Because the pension program expanded only in 1890, the pension was unanticipated.
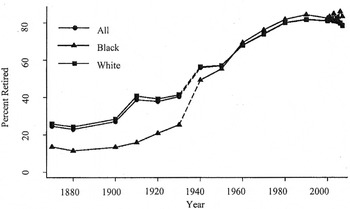
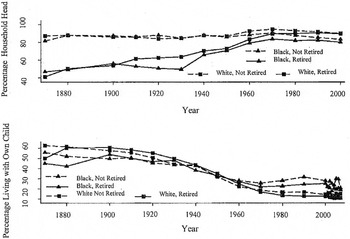
This article examines the effects of Union Army pensions on the retirement rates and living arrangements of African American veterans.Footnote 3 The typical pattern for both blacks and whites shifted over the twentieth century from one of low retirement with joint living among retirees to high levels of retirement with independent living among retirees (see Figures 1 and 2). Black retirement and independent living rates were considerably lower than those of whites at the beginning of the twentieth century, but by the century's end blacks were slightly more likely to be retired. Racial differences in retirement and elderly living arrangements did not narrow until 1940, coincident with the institution of Social Security, but the retirement rates of both black and white men older than 64 more than doubled between 1880 and 1930. Black retirees’ adoption of independent living, whether measured through headship rates or through the fraction of elderly men living with at least one of their children, began in 1940 whereas this change began in 1880 for white retirees.
RETIREMENT RATES BY RACE, AGE 65+

LIVING ARRANGEMENTS BY RACE, AGE 65+

Why were black retirement rates and rates of independent living among retirees so much lower than those of whites at the beginning of the twentieth century? Blacks had much less wealth than whites and I have emphasized the role of income as an explanation for the rise of retirement and of independent living.Footnote 4 An alternative explanation is that because the majority of blacks were living in the rural South, they were not subject to the same sectoral shifts faced by white industrial workers, which Chulhee Lee has argued explains much of the early rise in retirement rates.Footnote 5 Research on modern families has emphasized that norms of filial responsibility are greater among blacks than among non-Hispanic whites (e.g., Jeffrey Burr and Jan Mutchler) and scholars such as Antonio McDaniel, Philip Morgan, Andrew T. Miller, Samuel H. Preston, and Steven Ruggles have argued that the importance attached to familial relations has persisted from African history and culture.Footnote 6 Did blacks have different co-residence and work preferences and face a different work environment from whites or were they simply poorer?
This article uses Union Army pensions to argue that the work and living arrangement decisions of blacks were even more responsive to income than those of whites. Retirement and independent living were normal goods for both blacks and whites. The findings also provide insights into the rise in black retirement rates prior to 1930 and in how the institution of Social Security affected convergence in black-white retirement rates and living arrangements among retirees.
RETIREMENT AND LIVING ARRANGEMENT DECISIONS
Union Army pensions represent a pure income effect on labor supply and therefore should have induced more men to retire at any given age. The question I pose is by how much Union Army pensions reduced labor supply for veterans in their later years. Pensions might have two different effects on the retirement decision. They will directly affect income flows and the receipt of pensions in the past will increase current assets, allowing veterans to retire earlier. I estimate only the direct effect of pensions. The estimated effect of pensions will therefore be a lower-bound estimate.Footnote 7
The effect of an income transfer will depend on the size of the pension relative to income. Low earners should be more responsive to pension income than high earners, that is black veterans should be more responsive to pension income than white veterans. However, those without any wealth, as was true for most black veterans, may not find a pension enough to retire on, particularly if they subsidize needy friends and relatives. A Civil War widow (and pension recipient) interviewed in the 1930s reported that “the negroes of East Austin consider her a sort of bank. Whenever anyone needs a dime or a quarter, he or she thinks, ’Nancy has the money.’”Footnote 8 Ninety-four percent of black men employed as domestic servants in Philadelphia at the end of the nineteenth century had parents or others dependent on them.Footnote 9
If independent living is a normal good, then examining the living arrangements of retirees provides some clues about their financial wherewithal. I therefore examine the effect of Union Army pensions on living arrangements. The impact of pensions on living arrangements is theoretically ambiguous. The decision of older men and their kin to share living quarters is a function of income, including pension income, and prices, including shadow prices, faced both by the older men and their relatives. Such demographic variables as kin availability and such institutional variables as the rules of the Union Army program can be thought of as affecting the shadow price. The impact of these income and price variables on living arrangements will depend on the underlying model of living arrangements, the preferences of individuals, and household decisions made throughout the life cycle. For example, under a bargaining model if a man preferred to live on his own, then a sizable government transfer would enable him to do so; whereas if he preferred to live with relatives, then it would enable him to bribe them. Under an altruism model, a government transfer might either wholly or partially displace children's transfers and therefore have either no or very little impact on the living arrangements of older men.
UNION ARMY PENSIONS
By the end of the Civil War, 186,017 men had served in the U.S. Colored Troops. Seventy-eight percent of black men aged 15–49 in 1869 in the free northern states had served, a higher rate of service than that of whites in the same age group. In contrast, in the slave states where most blacks lived, 14 percent of black men in that age group served. The percentage was higher in the border states (34 percent) and in states such as Louisiana and Tennessee, which the Union Army occupied earlier in the war.Footnote 10 Although Union Army veterans were a relatively small percentage of the total black population, most of the black elite in both the North and the South had served.
Both black and white veterans were eligible for a pension. Congress established the basic system of pension laws, known as the General Law pension system, in 1862 to provide pensions to both regular recruits and volunteers who were disabled as a direct result of military service. The dollar amount depended on the degree of disability, regardless of the veteran's employment status, his job if employed, or his wealth. Application was through a pension attorney, and the degree of disability was determined by a board of three local doctors employed by the Pension Bureau and following guidelines established by the bureau.Footnote 11 Veterans could apply for a pension increase at any time and increases were granted as men's health declined.
The act of 27 June 1890 instituted a universal disability pension program for Union Army veterans. According to the veterans’ lobby, the new law would “place upon the rolls all survivors of the war whose conditions of health are not practically perfect.”Footnote 12 Within a year of the act's passage, the number of pensioners on the rolls more than doubled. Any disability now entitled a veteran to a pension and a veteran who could not claim a service-related disability received from $6.00 to $12.00 per month or from 19 to 38 percent of the monthly income of a laborer. However, an applicant who could trace his disability to the war (often because of the incorrect medical theories of the time such as marching in the damp causing rheumatism) received substantially more for the same disability than his counterpart who could not.
In 1890 the Pension Bureau instructed the examining surgeons to grant a minimum pension to all veterans at least 65 years of age, unless they were unusually vigorous. In 1904 Executive Order 78 reduced the discretion of the examining surgeons and officially authorized the Pension Bureau to grant pensions on the basis of age. Under the Service and Age Pension Act of 6 February 1907, pensions were $12.00 per month for veterans age 62 to 69, $15.00 per month for those age 70 to 74, and $20.00 per month for those older than 74. This act did not increase the total number of pensioners on the rolls; it mainly induced pensioners, when applying for a pension increase, to apply under the 1907 law rather than the 1890 law.
When the pension system was first created, blacks had close to the same approval rate as whites (roughly 85 percent for blacks and 89 percent for whites). However, by 1890, 81 percent of whites who had applied for a pension had been approved, compared to only 44 percent of black applicants. In the years prior to the 1890 liberalization, the pension board approved more and more pensions, even though the conditions for which pensions were granted often had a tenuous link to service in the war. But black veterans were not granted the same leniency.
The 1890 law increased black participation in the pension system because now any disability, even if not related to the war in the judgment of the Pension Bureau, entitled a veteran to a pension. The veteran and his attorney decided under what law to apply. Presumably they applied under the 1890 law only if the claim to a war-related disability was likely to be disputed. By 1900, 91 percent of black applicants had applied under the 1890 law, whereas only slightly more than half of all white applicants had done so. Because pension amounts were lower under the 1890 law than under the General Law, the average black pension in 1900 was $7.59 per month compared to $12.94 per month for whites. Nonetheless, blacks and whites received roughly equal treatment under the 1890 law. Between 1890 and 1899, 74 percent of black applications under the 1890 law were approved by the end of the period, compared to 81 percent of white applications under the 1890 law. The mean monthly pension during this period was only 80 cents higher for whites than for blacks.Footnote 13 In 1900 median pensions awarded to blacks were the same in both the North and the South, suggesting that the system was a federal one and did not depend on region of residence.
By 1910, when men could receive a pension by law purely on the basis of age, 83 percent of black applicants had applied under the aged-based 1907 law, 16 percent under the 1890 law, and only 1 percent under the General Law. Among whites 64 percent applied under the 1907 law, 14 percent under the 1890 law, and 22 percent under the General Law. Blacks were less likely to suffer from war wounds but had greater rates of arteriosclerosis and congestive heart failure than whites.Footnote 14 Pension recipiency among blacks in 1910 was probably slightly lower than among whites. I was able to find in the pension records 86 percent of a sample of whites who identified themselves as Union veterans in the 1910 census and 79 percent of blacks who reported themselves to be veterans.Footnote 15
Pensions replaced a higher fraction of blacks’ wage income. In 1900 the mean pension of $12.94 per month given to whites replaced 36 percent of the earnings of a manufacturing worker. In contrast, the mean pension of $7.59 per month given to blacks replaced 47 percent of their earnings.Footnote 16
DATA
Two data sets are used in the analyses. The first data set is based on the military service and pension records of 5,673 black Union Army soldiers in 51 infantry companies.Footnote 17 This sample is representative of the U.S. Colored Troops in terms of geography and slave status. Twenty-nine percent of the men in the sample were free when they joined the army; 28 percent of men were from the free states, and the remaining 72 percent were from the border and southern states. Twenty-two percent of these men died while in the service, a higher service mortality rate than the 14 percent rate for white soldiers, mainly because sanitary conditions for black troops were so poor. Over 90 percent of black service deaths were from disease.
The military service records provide information on state of birth, age and occupation at enlistment, year and place of enlistment, and on all military service events such as death, injury, and illness. The pension records provide information on pension recipiency and dollar amount received, date of death (if on the pension rolls), postbellum residence, and occupation.Footnote 18 The records of the examining surgeons provide information on height, weight, and various chronic conditions.
Veterans are linked to the 1870, 1880, 1900, 1910, 1920, and 1930 censuses which provide information on occupation (and therefore labor force participation), head of household status, whether any own children were present in the household, and characteristics such as literacy. Past censuses and the pension records provide information on last occupation, a measure of opportunity cost. Only the 1,018 men linked to the 1900 census are used in the analysis.Footnote 19 I restricted the sample to the noninstitutionalized. When using health information in the analyses, I also limited the sample to men for whom this information is available. Total sample size is 885 in 1900. When I restrict the samples to men with information on pension amount, the sample size become 877.
The second data set is drawn from the 1.4 percent 1910 Integrated Public Use Micro Sample (IPUMS), which identified veteran status. This census identifies 204 black noninstitutionalized Union Army veterans age 60–85. Both white and black veterans were undernumerated. Only 45 percent of black men in the Union Army sample are listed as veterans in the census.Footnote 20 I therefore add veterans from the Union Army sample to create an “expanded IPUMS” sample, giving me 729 black Union Army veterans age 60–85. When I restrict the sample to states in which I have both veterans and non-veterans, the sample size falls to 678 men.
The disadvantage of the IPUMS is that it provides no information on either health or pensions. However, the expanded IPUMS sample is the only sample large enough to examine living arrangements among the retired. An additional advantage of the IPUMS sample is that it is easily comparable to random samples of either the black or white populations.
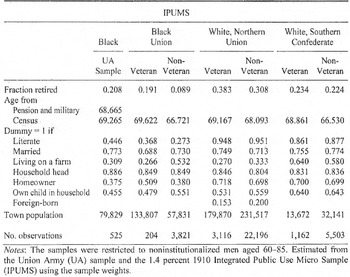
Veterans in the black Union Army sample were roughly similar to the self-identified veterans in IPUMS, but Table 1 shows that they were more likely to be household heads, less likely to be homeowners, and were more likely to live in a smaller town. Using age as reported in the military service and pension records, veterans in the Union Army sample were on average one year younger than IPUMS veterans. In the census, Union Army veterans reported themselves one year older on average.
CHARACTERISTICS OF 1910 UNION ARMY SAMPLE AND 1910 CENSUS SAMPLES

Notes:
The samples were restricted to noninstitutionalized men aged 60–85. Estimated from the Union Army (UA) sample and the 1.4 percent 1910 Integrated Public Use Micro Sample (IPUMS) using the sample weights.
Table 1 also reveals that compared to non-veterans, black veterans were more likely to be literate, less likely to live on a farm, more likely to live in a larger town, and were about one year older. In contrast, white Union Army veterans were more likely to be in a smaller town than white non-veterans who had been born in a northern state or who had immigrated prior to 1865. Similarly, white Confederate veterans were more likely to be in a small town than white southern-born non-veterans. White Union Army veterans were more likely to be retired than non-veterans, but the difference in retirement rates was not as large as the difference between the retirement rates of black veterans and non-veterans.
EMPIRICAL FRAMEWORK
Retirement
I estimate the effect of pensions on retirement rates in 1900 using both a probit model and also an IV probit model.Footnote 21 Although the Pension Bureau was not supposed to take labor force participation into account in awarding pensions, the examining surgeons may have considered labor force status in rating disabilities. If being out of the labor force was a sign of disability, there will be a spurious positive relationship between pensions and retirement. If being out of the labor force indicated laziness and therefore unworthiness, this will lead to a spurious negative relationship between pensions and retirement. Alternatively, those in the labor force may have been better able to obtain pensions and to obtain bigger pensions because they could pay the attorney fees or because they were better connected. This will produce a spurious negative relationship between pensions and retirement.
I use whether a veteran could trace his disability to the war as an instrumental variable. Men who succeeded in tracing their disabilities to the war received a larger pension for the same disability. In 1900 the difference in monthly pension amount among men who could trace their disabilities to the war and those who could not in a sample matched on demographic, socioeconomic, geographic, and health conditions was $3.30. Because men's ability to trace their disability to the war depended on the incorrect medical theories of the time, the law itself should not affect their decision to retire. However, men who could trace their disabilities to the war had been on the rolls longer. Among those who could trace their disabilities to the war, 46 percent were on the rolls before 1890 whereas among men who could not trace their disabilities to the war, only 9 percent were on the rolls before 1890. As a robustness test, I will therefore restrict the sample to men who were on the rolls only in 1890 or later.
Control variables in the regressions include age; two dummies indicating occupation (artisan, professional, or proprietor and laborer, with farmer as the omitted category); a dummy equal to one if the veteran was married; BMI and BMI squared; four dummies indicating whether the veteran had difficulty walking or bending and whether he was paralyzed or blind; dummies indicating literacy, property ownership, whether the veteran had been wounded in the war, whether the veteran was free at the time of enlistment, whether the veteran lived on a farm, and whether there were any own children in the household; the logarithm of town population; and area of residence fixed effects (equal to either a state or a region).
I use the expanded IPUMS sample to compare black Union Army veterans with non-veterans in 1910. In comparing veterans and non-veterans, I cannot control for poor health arising from wartime service, but, by comparing retirement rates between Confederate veterans and southern-born non-veterans, I can use a differences-in-differences strategy to account for war-time health shocks. Because Confederate veterans were ineligible for a Federal pension (and served longer and in worse health conditions than Union Army soldiers), any differences in retirement rates between Confederate veterans and southern-born non-veterans must be due to their worse health.Footnote 22
I use propensity score matching to analyze the expanded IPUMS sample because there are many men in the treatment (veterans) and control (non-veterans) groups whose characteristics do not overlap. Veterans were from different states and in the South were more likely to have migrated to southern cities after the war. I cannot model the initial decision of who enlisted, but I can control for basic covariates. Although my estimate of pension effects may be biased because of poor controls and because veterans were undernumerated, I can examine whether black soldiers were more or less responsive to pensions than white soldiers by comparing the retirement rates of white Union Army veterans with those of white non-veterans who either were northern-born or were pre-1865 immigrants.
I derive propensity scores from a probit regression of veteran status on age; the log of population in the town of residence; dummies for literacy, marital status, whether the man was residing on a farm, whether the man owned property (known only for household heads), whether the man was the head of the household, and whether any own children were living with the man; and state fixed effects. Because some of these variables may be determined by pension amount, I also run regressions using only age and region of residence fixed effects. I use the propensity scores in nearest neighbor matching with a caliper of 0.1 and with no replacement. A disadvantage of this approach is that if black veterans have a higher probability of being in worse health relative to whites, I will overestimate pension effects.
A pension effect derived from a comparison of the retirement rates of veterans and non-veterans should be smaller than the instrumental variable estimate from a sample that compares different pension amounts for veterans provided that the effect of receiving a small benefit is small or much smaller than the effect of receiving a large benefit. Consider a simple case in which non-recipients have a pension of zero and do not retire; some recipients have a small pension of p 1 and do not retire because the pension is not enough for subsistence; and other recipients have a large pension of p 2 and retire. If I estimate the average treatment effect for the treated using the differences in payments in the sample of veteran recipients, I am looking at the change from not retiring (0) to retiring (1) associated with an increase in pension from p 1to p 2. The result will be the ratio (1 – 0)/(p 2– p 1). When I compare non-recipients to recipients to obtain the average treatment effect on the treated, I calculate the ratio of the difference between the mean retirement rate for recipients ( ) and non-recipients (0) to the difference between the average pension rate for recipients (
 ) and the zero pension for non-recipients, which results in
 – 0). Since (
 ) is less than or equal to (1 – 0) and (
 ) is larger than (p 2 – p 1), the average treatment effect on the treated will be larger using an all veteran sample than when comparing veterans and non-veterans.Footnote 23 Estimates from both comparisons will overestimate the effect of giving men a small pension (which is 0) and underestimate the effect of going from no pension to a large pension.
Living Arrangements
In examining the effect of pensions on elderly living arrangements in 1910, I compare living arrangements between black Union Army veterans and non-veterans, white Union Army veterans and northern non-veterans, and white Confederate veterans and southern non-veterans. I look at both retirees and non-retirees to understand differences in their living standards. Because the Union Army sample contains too few retirees, I use only the expanded IPUMS sample. The two measures of living arrangements are whether the man was the household head and whether the man was living with any of his own children. The samples are restricted to noninstitutionalized men age 60–85. I obtained matches by deriving propensity scores from a probit regression of veteran status on age; the logarithm of population in the area of residence; dummies for literacy, marital status, whether the man was residing on a farm, and whether the man owned property; and, state fixed effects.
RESULTS: RETIREMENT
IV Estimates
Men who could trace their disability to wartime service obtained a larger pension than those who could not do so. The difference in retirement rates in 1900 between men with a war-related disability and men without one in a sample matched on demographic, socioeconomic, health, and geographic characteristics was 5.4 percentage points. Because the difference in monthly pension amount between the two groups was $3.30, the average treatment effect on the treated was 1.6 (= 5.4/3.3,  = 2.62).
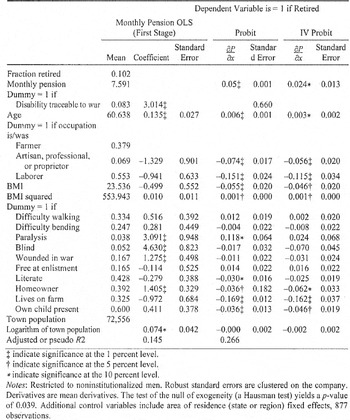
In Table 2 the first stage pension regression in the IV probit analysis shows that veterans received larger pensions if they could trace their disability to the war in 1900, were older, were paralyzed or blind, had been wounded in the war, were homeowners, and were from larger towns. Observables explain 15 percent of the variation in pension amount. Comparing the results with those I obtained earlier for whites, shows that observables explain less of the variation in pension income for blacks than for whites and that a war-related disability was not as strong a predictor of pension income for blacks as it was for whites.Footnote 24 Black veterans’ pensions were endogenous: the test of the null hypothesis of exogeneity yielded a p-value of 0.04. In contrast, in previous work I found no evidence of pension endogeneity for whites.Footnote 25 Using an un-instrumented probit model indicates that a dollar increase in monthly pension amount yields a small but statistically significant increase in the probability of retirement by 0.005 in 1900 (see Table 2). In contrast, the instrumental variable estimate of the effect of pension income implies that a dollar increase in pension income increases the probability of retirement by 0.024 (see Table 2).Footnote 26 Given that the pension coefficient increased when I instrumented, it is possible that those in the labor force were better able to obtain pensions.
PREDICTORS OF MONTHLY PENSION AMOUNT AND RETIREMENT (PROBIT AND IV) AMONG BLACK UNION ARMY VETERANS IN 1900

‡ indicate significance at the 1 percent level.
† indicate significance at the 5 percent level.
* indicate significance at the 10 percent level.
Notes:
Restricted to noninstitutionalized men. Robust standard errors are clustered on the company. Derivatives are mean derivatives. The test of the null of exogeneity (a Hausman test) yields a p-value of 0.039. Additional control variables include area of residence (state or region) fixed effects, 877 observations.
Black veterans were more responsive to pension income than whites. In previous work, I estimated that a one dollar increase in pension increased the retirement rates of white Union Army veterans by 1.1 percentage points and I calculated that the income elasticity of retirement was 0.7.Footnote 27 A derivative of 0.024 on monthly pension amount from the IV probit equation in Table 2 for blacks implies that a 1 percent increase in pension income raised their probability of retirement by 1.8 percent based on elasticity calculations using the mean pension of $7.60 for blacks and the mean retirement rate of 10 percent (1.8 = 0.024[ ]).Footnote 28
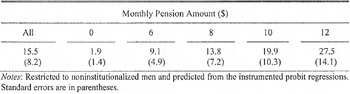
Table 3 shows predicted values at different pension amounts using the coefficient estimates from the IV probit analysis. A move from a zero pension to a $6.00 pension increases the predicted retirement rate by 7.2 percentage points from 1.9 to 9.1 percent. The effect gets even stronger as the pension amount increases. A $6.00 increase from a $6.00 pension to a $12.00 pension rates the retirement rate by 18.4 percent from 9.1 to 27.5 percent.
PREDICTED RETIREMENT RATES AT SPECIFIC MONTHLY PENSION AMOUNTS IN 1900

Notes:
Restricted to noninstitutionalized men and predicted from the instrumented probit regressions. Standard errors are in parentheses.
Comparing Veterans and Non-Veterans in 1910
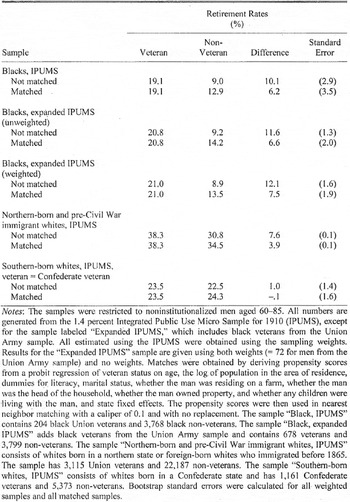
Table 4 reports the results of the matching estimation for the various samples using the combination of IPUMS and Union Army Data for 1910. Without matching, the difference in retirement rates between black Union Army veterans and non-veterans ranged from 10.1 to 12.1 percentage points (lines 1, 3, and 5 of Table 4), depending on which sample was used. After estimating propensity scores and matching each black veteran to the black non-veteran with the most similar characteristics, the difference falls to from 6.2 to 7.5 percentage points.Footnote 29
RETIREMENT RATES IN 1910 BY VETERAN STATUS

Notes:
The samples were restricted to noninstitutionalized men aged 60–85. All numbers are generated from the 1.4 percent Integrated Public Use Micro Sample for 1910 (IPUMS), except for the sample labeled “Expanded IPUMS,” which includes black veterans from the Union Army sample. All estimated using the IPUMS were obtained using the sampling weights. Results for the “Expanded IPUMS” sample are given using both weights (= 72 for men from the Union Army sample) and no weights. Matches were obtained by deriving propensity scores from a probit regression of veteran status on age, the log of population in the area of residence, dummies for literacy, marital status, whether the man was residing on a farm, whether the man was the head of the household, whether the man owned property, and whether any children were living with the man, and state fixed effects. The propensity scores were then used in nearest neighbor matching with a caliper of 0.1 and with no replacement. The sample “Black, IPUMS” contains 204 black Union veterans and 3,768 black non-veterans. The sample “Black, expanded IPUMS” adds black veterans from the Union Army sample and contains 678 veterans and 3,799 non-veterans. The sample “Northern-born and pre-Civil War immigrant whites, IPUMS” consists of whites born in a northern state or foreign-born whites who immigrated before 1865. The sample has 3,115 Union veterans and 22,187 non-veterans. The sample “Southern-born whites, IPUMS” consists of whites born in a Confederate state and has 1,161 Confederate veterans and 5,373 non-veterans. Bootstrap standard errors were calculated for all weighted samples and all matched samples.
The difference of 6.2 to 7.5 percentage points in retirement rates between matched veterans and non-veterans suggests a sizable pension effect on retirement. Assuming that all black veterans were receiving an average pension of $13.50 in 1910, the average treatment effect on the treated ranges from 0.5 (= 6.2/13.5) to 0.6 (= 7.5/13.5). In contrast, when I use the matching methods to compare two groups who did not have access to Civil War pensions, southern non-veterans to southern-born Confederate veterans, the difference in retirement rates is only 0.1 percentage points.
Pension income explains roughly 61 to 75 percent of the 10.1 to 12.1 percentage point difference in retirement rates between black veterans and non-veterans in the various unmatched IPUMS samples. Had all black non-veterans received a Union Army pension, the matching estimator implies that their retirement rates would have risen by 6.2 to 7.5 percentage points to 15.2 or 16.4 percent. These percentage increases account for 61 (= 6.2/10.1) to 75 (= 7.5/12.1) percent of the gap in retirement rates between black veterans and non-veterans.Footnote 30
Table 4 also implies that blacks were more responsive than whites to pension income. In the fourth grouping in Table 4, white Union Army veterans are compared with white non-veterans who were born in the North or who immigrated to the United States prior to 1865. Using propensity score matching, veterans had a retirement rate that was 3.9 percentage points higher than for similar non-veterans. Assuming that the average white veteran received a pension of $16.90, the average treatment effect on the treated was only 0.2 (= 3.9/16.9), less than half than the 0.5 to 0.6 average treatment effect for blacks.Footnote 31
RESULTS: LIVING ARRANGEMENTS
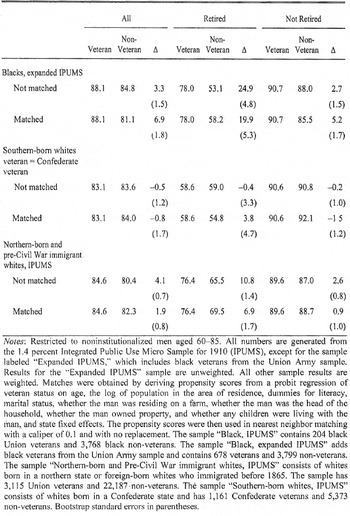
Tables 5 and 6 show that pension income enabled black veterans, particularly retired veterans, to maintain a household independent of their children. The first line of Table 5 shows that in 1910 differences in headship rates between black veterans and non-veterans were 3.3 percentage points overall, 24.9 percentage points for the retired, and 2.7 percentage points for those still in the labor force. The second line of Table 5 shows that when propensity scores are used to match black veterans with comparable non-veterans, differences in headship rates between veterans and non-veterans become 6.9 percentage points overall, 19.9 percentage points for the retired, and 5.2 percentage points for the non-retired. In contrast, when southern-born whites are matched to comparable Confederate veterans in the fourth line of Table 5, the difference in headship rates among the retired was small: only 3.8 percentage points. When I use a matching procedure in the sixth line of Table 5 to compare Union Army veterans with non-veterans who were born in the North or who immigrated prior to 1865, I find that the difference in headship rates among the retired was 6.9 percentage points. (Differences in headship rates among white men still in the labor force were small.) Using the difference between white Confederate veteran and non-veteran headship rates to construct differences-in-differences estimates for both whites and blacks, the difference in headship rates due to pensions was 16.1 (= 19.9 – 3.8) percentage points for blacks retirees and 3.1 (= 6.9 – 3.8) percentage points for white retirees.
PERCENTAGE OF MEN WHO WERE HOUSEHOLD HEADS BY VETERAN AND RETIREMENT STATUS

Notes:
Restricted to noninstitutionalized men aged 60–85. All numbers are generated from the 1.4 percent Integrated Public Use Micro Sample for 1910 (IPUMS), except for the sample labeled “Expanded IPUMS,” which includes black veterans from the Union Army sample. Results for the “Expanded IPUMS” sample are unweighted. All other sample results are weighted. Matches were obtained by deriving propensity scores from a probit regression of veteran status on age, the log of population in the area of residence, dummies for literacy, marital status, whether the man was residing on a farm, whether the man was the head of the household, whether the man owned property, and whether any children were living with the man, and state fixed effects. The propensity scores were then used in nearest neighbor matching with a caliper of 0.1 and with no replacement. The sample “Black, IPUMS” contains 204 black Union veterans and 3,768 black non-veterans. The sample “Black, expanded IPUMS” adds black veterans from the Union Army sample and contains 678 veterans and 3,799 non-veterans. The sample “Northern-born and Pre-Civil War immigrant whites, IPUMS” consists of whites born in a northern state or foreign-born whites who immigrated before 1865. The sample has 3,115 Union veterans and 22,187 non-veterans. The sample “Southern-born whites, IPUMS” consists of whites born in a Confederate state and has 1,161 Confederate veterans and 5,373 non-veterans. Bootstrap standard errors in parentheses.
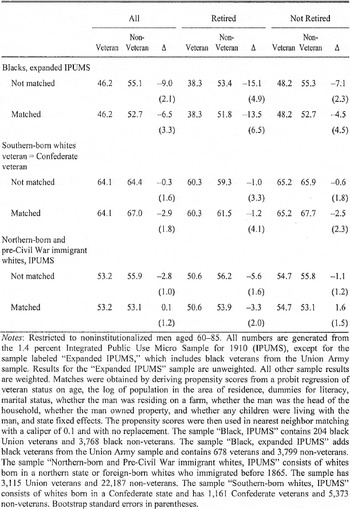
PERCENTAGE OF MEN LIVING WITH AT LEAST ONE OF THEIR CHILDREN BY VETERAN AND RETIREMENT STATUS

Notes:
Restricted to noninstitutionalized men aged 60–85. All numbers are generated from the 1.4 percent Integrated Public Use Micro Sample for 1910 (IPUMS), except for the sample labeled “Expanded IPUMS,” which includes black veterans from the Union Army sample. Results for the “Expanded IPUMS” sample are unweighted. All other sample results are weighted. Matches were obtained by deriving propensity scores from a probit regression of veteran status on age, the log of population in the area of residence, dummies for literacy, marital status, whether the man was residing on a farm, whether the man was the head of the household, whether the man owned property, and whether any children were living with the man, and state fixed effects. The propensity scores were then used in nearest neighbor matching with a caliper of 0.1 and with no replacement. The sample “Black, IPUMS” contains 204 black Union veterans and 3,768 black non-veterans. The sample “Black, expanded IPUMS” adds black veterans from the Union Army sample and contains 678 veterans and 3,799 non-veterans. The sample “Northern-born and Pre-Civil War immigrant whites, IPUMS” consists of whites born in a northern state or foreign-born whites who immigrated before 1865. The sample has 3,115 Union veterans and 22,187 non-veterans. The sample “Southern-born whites, IPUMS” consists of whites born in a Confederate state and has 1,161 Confederate veterans and 5,373 non-veterans. Bootstrap standard errors in parentheses.
Table 6 enables me to estimate the effect of pensions on the percentage of men living with at least one of their children. The second line of this table shows that when propensity scores are used to match black veterans with comparable non-veterans, there is a 13.5 percentage point difference between veteran and non-veteran retirees in the percentage residing with children. In contrast, matching Confederate veterans with whites born in the south yields only a 1.2 percentage point difference in co-residence rates between veteran and non-veteran retirees (see line 4 of Table 6). Matching white Union Army veterans with whites who were either born in the north or who immigrated before 1865 yields a 3.3 difference in co-residence rates between veteran and non-veteran retirees. Using the difference between white Confederate veteran and non-veteran co-residence rates to construct differences-in-differences estimates for both whites and blacks, the difference in co-residence rates due to pensions was –12.3 (= 1.2 – 13.5) percentage points for blacks retirees and –2.1 (= 1.2 – 3.3) percentage points for white retirees.
Tables 5 and 6 imply that the headship and co-residence rates of black retirees were 6 to 8 times more responsive to pension income than those of whites. Assuming that the average pension for the retired was $15.30 for whites and $18.90 for blacks, I find that for headship rates the average treatment effect on the treated was 1.1 (= 16.1/15.3) for black retirees and 0.2 (= 3.1/18.9) for white retirees. For co-residence rates the average treatment effect on the treated was –0.8 (= –12.3/15.3) for black retirees and –0.1 (= –2.1/18.9) for white retirees.
IMPLICATIONS
The upper-bound income effects that I calculated are greater than most estimates of the effects of Social Security or asset income on retirement obtained from more recent populations, whether in the United States or in developing countries.Footnote 32 The closest estimates in magnitude are those of Leora Friedberg, whose study of the effect of OAA benefits on retirement in 1940 and 1950 implies elasticities of 0.4 for whites and 1.2 for blacks.Footnote 33 Her elasticity estimates for both whites and blacks are smaller than my results for U.S. veterans, perhaps because she was examining a means and wealth tested program or because in the United States in 1940 and 1950 retirement rates were higher than those of African Americans in 1910.
Both my results and Friedberg's suggest that blacks were 2 to 3 times more responsive to income transfers than whites. Had black non-veterans in 1910 been given a monthly pension of $12.00 per month (the median awarded to black veterans in 1910), their retirement rates would have exceeded those of white southerners and have been comparable to those of northerners. The results imply that much of the black-white differences in retirement rates at the beginning of the century are attributable to blacks’ low incomes.
My estimated pension elasticity of 1.8 implies that rising incomes might be able to account for all of the increase in black retirement rates between 1900 and 1930. Real national income per capita rose by 55.2 percent between those years. Given that there was roughly an 8 percent improvement in the black-white income ratio in those years,Footnote 34 real national income per capita may have risen by 59.6 percent for blacks.Footnote 35 An elasticity of 1.8 would lead to a 99 percent increase in retirement rates.Footnote 36 In the South, retirement rates rose from 13 to 25 percent between 1900 and 1930. Increases in incomes imply that retirement rates should have been 26 percent in 1930. Rising incomes cannot explain patterns in headship among retirees prior to 1930—headship rates among black retirees fell between 1900 and 1930. If rising retirement is unaccompanied by independent living, even though I have shown that independent living is a normal good, then perhaps retirement rates rose because of economic dislocation.Footnote 37
Rising wealth cannot account for the black-white convergence in retirement rates observed between 1930 and 1950. Most of the convergence occurred between 1930 and 1940. But national income fell between 1929 and 1939. Census data show that between 1930 and 1940 the fraction of nonfarm men age 45 to 54 owning a home fell by 4 percentage points among whites and by almost 6 percentage points among blacks. The real value of housing wealth fell by 30 percent for whites and by 36 percent for blacks (estimated from the Integrated Public Use Census Samples).
Although there were tremendous changes in economic and social structure between 1900 and 1940, my estimate can provide some suggestive evidence on the impact of the institution of Social Security on the retirement rates of blacks and whites. I examine how retirement rates of whites and blacks in the South (where most blacks were located in 1930) would have changed if in 1930 Social Security had been instituted in its 1950 form. In 1950 Social Security consisted of Old Age and Survivors’ Insurance (OASI) and Old Age Assistance (OAA), a need-based program. OAA recipiency expanded sharply between 1940 and 1950, particularly in the southern states where most blacks were located. By 1950 at most 9 percent of men older than 64 were collecting OASI, whereas 23 percent of all elderly were collecting OAA.Footnote 38
Had OAA been instituted in its 1950 form in 1930, the difference in retirement rates between blacks and whites in the South would have fallen by up to 54 percent. Given the population distribution of blacks and whites in the southern states, average monthly OAA payments in 1910 dollars were $10.50 for blacks and $11.40 for whites. Average OAA recipiency rates were 37.4 percent for blacks and 35 percent for whites.Footnote 39 Using the 1900 IV estimates of the percentage point increase in retirement rates for a dollar increase in pension income of 2.4 for blacks (see Table 2) and of 1.1 for whites from my earlier work, retirement rates in the South would have risen from 25.5 to 34.9 percent for blacks and from 37 to 41.4 percent for whites, thus explaining 54 percent of the initial difference in retirement rates (= (41.4 – 34.9)/(37.0 – 25.5)).Footnote 40 Because OAA included large work disincentives, the pure income effect estimated from Union Army pensions may underestimate the effect of OAA on retirement rates.Footnote 41 Differences in retirement rates that cannot be explained by the income effects and work disincentives of Social Security may be explained by changes in labor demand.
Instituting OAA in its 1950 form in 1930 would have reduced the difference in black and white headship rates of retirees up to 43 percent. In 1930, 49 percent of southern black retirees headed their own household compared to 56 percent of southern white retirees, a difference of 7 percentage points. Using the estimates of the average treatment effects on the treated derived from the 1910 comparison of veterans and non-veterans (Table 5) and average southern recipiency rates and payouts implies that headship rates would have risen to 53.3 percent for retired blacks and to 56.8 percent for retired whites, a difference of 3.5 percentage points.
CONCLUSION
Most studies of black economic progress have focused on prime-aged men.Footnote 42 Less is known about long-run trends in the economic status of the elderly and even if rates of retirement and independent living can be used as indicators of well-being is uncertain. The Union Army pension program provided me with a unique opportunity to examine the effect of an exogenous, unearned income transfer on the retirement rates and living arrangements of African Americans at the beginning of the twentieth century and therefore to show that retirement and independent living were normal goods not just for whites but also for blacks. In fact, blacks were even more responsive to income than whites in making their retirement and living arrangement decisions. There is no evidence of historical differences in norms of work or co-residence dating either to slavery or African traditions.Footnote 43 This European pattern differs from that observed in South Africa, where pensions have had no effect on independent living but is similar to that observed in Brazil.Footnote 44 Black rates of retirement and independent living were low prior to 1940 because they could not afford to retire and, when retired, to live independently of their children.
 is
 and the fraction of men receiving pensions of
 is
 then
 and
 .
 can be written as
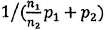 and the denominator of this term is greater than
 .
 = 0.001) in 1900. When I restrict to men who are matched on all observed characteristics in 1900, including health, and run the IV regression on the resulting sample of 125 men, I obtain a derivative of 0.041 (
 = 0.018), statistically significant at the 5 percent level. When I restrict the black sample to men who were on the pension rolls only by 1890 or later, the instrumental variable estimate is statistically insignificant, but the magnitude of the derivative remains a similar 0.027 (
 = 0.017). Lastly, if pensions improved health outcomes and therefore enabled men to stay in the labor force longer, I might underestimate the effect of pensions on retirement rates. Using whether a disability was traceable to the war as an instrumental variable, I am able to determine if men with larger pensions in 1900 were less likely to have died by 1910 controlling for socioeconomic status, demographic characteristics, and region of residence. I find that pension amount in 1900 raised the probability of dying by 1910 by a small but statistically insignificant amount (the derivative on monthly pension amount was 0.024 (
 = 0.024) controlling for health in 1900 and 0.029 (
 = 0.021) not controlling for health).
 where
 is the coefficient on pension amount, x is mean pension amount, and y is the mean retirement rate.
 = 3.7) to 6.9 (
 = 1.9) percentage points.
 = 3.2) percentage points.
 = 0.018), –0.022 (
 = 0.068), and 0.049 (
 = 0.013) for black Union Army veterans, white Confederate veterans, and white Union Army veterans, respectively. Double-differencing with the coefficient for Confederate veterans, the implied average treatment effects on the treated are 0.7 for black Union Army veterans and 0.4 for white Union Army veterans.