




No CrossRef data available.
Article contents
Heterogeneous model of schistosomiasis transmission and long-term control: the combined influence of spatial variation and age-dependent factors on optimal allocation of drug therapy
Published online by Cambridge University Press: 13 December 2004
Abstract
Prior field studies and modelling analyses have individually highlighted the importance of age-specific and spatial heterogeneities on the risk for schistosomiasis in human populations. As long-term, large-scale drug treatment programs for schistosomiasis are initiated in subSaharan Africa and elsewhere, optimal strategies for timing and distribution of therapy have yet to be fully defined on the working, district-level scale, where strong heterogeneities are often observed among sublocations. Based on transmission estimates from recent field studies, we develop an extended model of heterogeneous schistosome transmission for distributed human and snail population clusters and age-dependent behaviour, based on a ‘mean worm burden+snail infection prevalence’ formulation. We analyse its equilibria and basic reproduction patterns and their dependence on the underlying transmission parameters. Our model allows the exploration of chemotherapy-based control strategies targeted at high-risk behavioural groups and localities, and the approach to an optimal design in terms of cost. Efficacy of the approach is demonstrated for a model environment having linked, but spatially-distributed, populations and transmission sites.
Keywords
Information
- Type
- Research Article
- Information
- Copyright
- © 2004 Cambridge University Press
INTRODUCTION
Effective control of schistosomiasis remains beyond the reach of many affected countries, despite implementation of large-scale control programs. There are a number of reasons for this disappointing result. Beyond the issue of limited financial resources, implementation of targeted therapy programs has typically not reached the levels of coverage required to attain the desired benefit of reducing transmission and prevention of new infection (Gryseels, 1996; Muchiri, Ouma & King, 1996). In this setting, individuals who are treated benefit from their own therapy, but the community-at-large does not benefit if transmission is not reduced or eliminated over the long term. Without achieving this community-wide benefit as an ‘externality’ of large-scale treatment (Miguel & Kremer, 2004), a schistosomiasis control programme remains a curative, rather than a fully preventive form of health intervention.
Recent programme development by the WHO, the Partnership for Child Development, and the Schistosomiasis Control Initiative has led to the implementation of combined ‘deworming’ programmes for school-age children or total populations, in the form of public–private collaborations to reduce disease burden due to schistosomiasis and intestinal helminths. Questions remain, however, about the optimal definition and scale of an intervention population, the appropriate duration of control, and about how control resources can best be allocated to achieve elimination of schistosome-related disease (Gryseels, 1996).
Woolhouse and others have pointed to the potentially strong influence of population and environmental heterogeneities on parasite transmission in endemic communities (Woolhouse et al. 1997, 1998). While certain features, such as clustering of heavy human infection, tend to stabilize transmission in susceptible communities, they also offer potential leverage to reduce or stop transmission through selective focal interventions. In order to capture this advantage, recent field studies have begun to assess both the spatial and temporal variation in transmission factors in endemic areas (Malone et al. 1994; Agwanda, 1997; Woolhouse et al. 1998; Bavia et al. 1999; Webster et al. 2001; Zhou et al. 2002; Clennon et al. 2004). In the context of these new data, our present modelling analysis employs both basic models and newer, extended models to examine the optimal timing and distribution of treatment efforts to obtain the goal of region-wide control of disease in the multi-community setting.
The overall pattern of endemic schistosomiasis consists of linked processes of human-to-snail and snail-to-human infection. This process can be viewed as one of coupled dynamics (recruitment/reproduction/attrition) of schistosome worms within a human host, linked with snail infection caused by human activity at water contact sites (MacDonald, 1965; Woolhouse, 1991; Barbour, 1996). After reviewing the implications of the basic coupled differential equations model, we develop a new, extended model of heterogeneous schistosome transmission that accounts for spatial distribution of human and snail population clusters and human population age and behaviour structure. As in previous studies (see for example, Woolhouse, 1991 and Barbour, 1996), we used a simplified Macdonald-type ‘mean burden+snail infection prevalence’ formulation, but we place it in a more realistic environment made of spatially-distributed human population clusters (villages) and water contact (snail) sites based, in part, on parameter estimates from recent field data from Kenya (Clennon et al. 2004; Kariuki et al. 2004). In the setting of this extended model, the interactions of human and snail populations are described by age-dependent human water contact patterns and the geographical proximity between human and snail locales.
Assuming a stationary environment (stable human and snail population densities, contact frequencies, transmission, mortality rates, etc.), we examine endemic equilibria in such a model system. The endemic equilibria in many transmission models are often linked to the basic reproduction number R0, which measures parasite population growth rate due to secondary infection (see, e.g. Anderson & May, 1991a,b; Barbour, 1996). For the distributed systems, we show that the role of R0 is played by a ‘basic reproduction matrix’, R. We next identify the important transmission and behavioural parameters that affect the endemic (equilibrium) levels of worm burden and snail infection pervalence, and apply this information to devise an optimal treatment strategy in terms of cost.
While the system of treated-population dynamics is no longer stationary, one can show that the average effect (of its period-varying coefficients) will drive up worm mortality from its natural value to a new (higher) level, in proportion to the frequency of treatment sessions. Linking such treatment-induced mortality to the human population's behavioural risk factors (water contact rates), one can find an optimal solution for suppression of infection intensity that minimizes cost by proper spacing of treatment sessions among various age/risk groups and locales. In order to capture the combined effects of spatial and behavioural heterogeneity within extended treatment areas, we apply our targeted control strategy to a representative, model, heterogeneous transmission environment, and find that it can effect a substantial reduction in the mean worm burden for a range of reproduction numbers.
MATERIALS AND METHODS
Assumptions
The working, distributed model makes several simplifying assumptions, including that of stationary environmental conditions (population densities, transmission parameters, etc.). A second important assumption is the independence of environmental and behavioural factors on population distribution and transmission dynamics. A real-world environment is clearly non-stationary, and would include seasonal and weather variations in snail populations and contact patterns that are not reflected in our model. Ideally, future modelling efforts will account for human population growth, more realistic geographical and human behaviour features, more detailed representation of schistosome life-cycle, the effects of acquired immune memory on schistosome infection, and the control of chronic morbidity in lieu of its surrogate, infectious burden (see MacDonald, 1965; King et al. 1988; King, Muchiri & Ouma, 1992; Chan et al. 1995; Guyatt & Tanner, 1996; Medley & Bundy, 1996; Muchiri et al. 1996; Chan & Bundy, 1997).
Numerical analysis
For the numerical analysis of our model, we coded the equations in Mathematica 5.0.1 (Wolfram Research, Champaign IL), and used both built-in and specially developed algorithms and procedures to estimate the solutions, equation parameters, and control strategies described in the text and figure legends. Details of these programs are available from the corresponding author.
The basic single site model (MacDonald, 1965)
The simplest homogeneous model for a single human population H, and snail site of density N, is given by a coupled system of differential equations for two variables: mean worm burden w(t) in human hosts, and infected snail infection prevalence
1More precisely, a rescaled prevalence of shedding snails.

Here, the coefficients have the following meaning: η – human–snail contact frequency (assumed to be uniform across an idealized human population), α – probability of worm establishment per contact per infected snail, β – rate of snail infection per contact per adult worm (N.B.: Hw thus represents the total worm population in human hosts, and Ny – infected snail density), γ and μ – respective mortalities of the adult worm (in the human host), and of infected snails.
Equations (1.1) can be derived from a more detailed precursor system that accounts for various stages of ‘snail-worm-larvae’ transmission cycle (see Anderson & May, 1991a). In deriving (1.1), we made several simplifying assumptions: For instance, ‘human infection force’, Bw in the second part of the coupled equations (1.1), should be proportional to the number of mated (reproducing) pairs, w′, rather than total worm number, w, within a human host. These two variables are related through the mating probability factor,

, which depends on the details of worm distribution in human hosts (see Anderson & May, 1991b). Inserting factor 0<ϕ(w)<1 leads to important qualitative changes in a simple model (1.1) (Woolhouse, 1991, 1992). It makes transmission cycle less efficient at low burden levels, but its effect diminishes at large w, when ϕ approaches 1. We drop it here because ϕ is typically estimated above 0·94 where the effect of over-dispersion of infection intensity is considered (Anderson & May, 1991a). Its implications for an extended heterogeneous system have not yet been explored, and will be addressed in a future study.
Endemic equilibria and chemotherapy control
There are well-known equilibria of system (1.1), which can be applied to study the long-term effect of mass chemotherapy. These equilibria, under stationary conditions (population densities, contact pattern, transmission, and attrition rates), depend on the basic reproduction number

a product of two transmission rates: TSH=A/γ and THS=B/μ. The endemic (nonzero) equilibrium requires R0>1, and gives the following values

These equations show explicitly the three parameters that are relevant for potential control: snail density N (affected by mollusciciding), worm mortality γ (affected by chemotherapy), and water contact frequecy η (behavioural factor). A further important factor is human population size, H. However, the increase in H, for fixed N, γ, η, can only drive equilibrium burden

to a finite (saturation) value

, which is independent of H.
We are interested in what this simplified two-dimensional system predicts as the long-term effects of chemotherapy administered at regular time-intervals, T. Assuming short duration of a treatment session compared to the worm's life-span, and its high efficacy (King & Mahmoud, 1989), we can model such treatment mathematically as a regular sequence of Dirac delta sources (or step-functions) added to the natural attrition term of w(t),

While this makes the system non-stationary in a strict sense, the long-term average effect of such ‘periodic forcing’ amounts to replacing the natural attrition, γ, by its new effective value γ+τ, where τ=1/T – the frequency of chemotherapy.
2More generally, τ=f/T – where f is ‘population fraction coverage’ times treatment efficiency.

Hence, we obtain new (τ-dependent) values of reproduction number and mean burden

Considering τ a control parameter, we see the effect of such treatment regimen on
and R0. Importantly, we can estimate a minimal value of τ for obtaining eradication,

Fig. 1 compares solutions {w(t),y(t)} for the exact system (1.4) and the average stationary one (1.5). We use typical transmission/decay parameters for a high-endemicity area:

Hence, calculated R0=8 is relatively high (Anderson & May, 1991a), but within the variance of individual transmission sites (Woolhouse et al. 1998), and the estimated initial endemic level

worms. We demonstrate (Fig. 1) the effect of three different treatment regimens, where τ=0·5; 1; 1·75 treatments per year, the latter corresponding to the critical value for eradication, τm in this isolated system.

Fig. 1. Solid and dashed curves show solutions for mean worm burden (w(t), left panels) and prevalence of infected snails (y(t), right panels) of the exact system (Equation 1.4, solid lines) and its ‘averaged’, effective attrition system (Equation 1.5, dashed lines), for three increasing values of treatment frequency, τ. Grey bars indicate individual treatment events. Grey lines in the left panel indicate ultimate equilibrium values of mean worm burden for the conditions shown.
The see-saw pattern of sharp falls during treatment phases, followed by steady off-treatment increase in mean worm burden, is well approximated by solutions of the average (stationary) system. Thus, we have shown the long-term effect of regularly timed chemotherapy to be equivalent to properly modified worm attrition, γ+τ. In the next section, we shall adopt this averaging principle for larger (heterogeneously-distributed) systems. with reference to the overall (per capita) cost of treatment, C(τ), this clearly increases linearly with τ, C(τ)=c0τ, where c0 – cost of a single session.
This simplified model (1.1) gives only a crude qualitative assessment of the transmission and control processes. It clearly fails to account for the observed over-dispersion of worm burden in typical populations and the heterogeneities associated with age-behavioural factors and environment (spatial distribution of human and snail populations) that affect transmission and control.
Heterogeneous model
Earlier studies have addressed some aspects of heterogeneity, e.g. (Barbour, 1978; Woolhouse, 1991), but have considered distributed populations without age structure, whereas Chan et al. (1995) have studied age-structured transmission effects for a single-site human and snail system. Here, we extend their work further by combining both types of heterogeneity.
A typical extended transmission environment consists of multiple human population sites, here labelled by index i=1,…, M, with population strata Ĥ=(Hi,a), where index a=1,2,…, P labels age bins with time-step Δa, and multiple water contact sites {j=1,…, L} with snail densities {Nj}, as illustrated in Fig. 2. Each site of aggregated human residences can be thought of as a hypothetical ‘village,’ so the putative scale of our model environment can range from several to several dozen kilometers (Clennon et al. 2004). Clearly, more realistic populations spread continuously across spatial regions, rather than concentrate in point-like clusters. It remains to be seen whether the difference between discrete and continuous population patterns has a significant effect on transmission dynamics – a question we postpone to further study.

Fig. 2. Model environment made of 12 human clusters and 10 snail sites with selected marked distances (top), along with their assigned population fractions (bottom left) and snail densities (bottom right).
To cast the resulting human–snail system in a compact form we introduce vector notations: ŵ=(wi,a) worm burden variables (labelled by human stratum and age), and ŷ=(yj) – location-specific snail infection prevalences. By analogy with (1.1) variables {ŵ,ŷ} obey a coupled system of differential equations

Here A=[αaηia,j], B=[βaηia,j]tr denote transmission matrices (snail-to-human and human-to-snail), Γ=diag(γa) – the (age dependent) worm attrition matrix, G=[ga,b] – aging operator – a progression of worm burden across age bins (both Γ and G are assumed idependent of site i), the dot indicates a matrix/vector product, while

,

etc. mark coordinate-wise products of vector quantities. The aging operator at each site i=1;…,M, consists of a (Leslie-type) P×P block,

a band matrix with

on the main diagonal and

on low sub-diagonal. Most other coefficients have the same meaning as in (1.1), but we furnish them with indices {i,j,a} to indicate spatial or age-dependent attributes. Thus, αa allow for age-dependent worm establishment rates, either through acquired immunity or due to other age-protective mechanisms (e.g. different patterns of exposure, changes in skin lipids, etc.). Coefficients βa represent (age-dependent) contamination rates of snail sites (per unit contact), γa are appropriate for age-targeted chemotherapy, and μj – site-specific snail mortality (for snail control).
The coordinate form of (1.8) is given by an MP+L system of differential equations

The essential behavioural parameters here are contact frequencies, ηi,a;j, for the (i,a) – human strata at the j-th snail site.
[Remark: To link our system to the age-structured models of Chan and colleagues (Chan et al. 1995; Chan & Bundy, 1997), we choose a single locus of human and snail population sites, but replace discrete age bins with a continuous age strata h*(a). That turns (1.9) into a coupled partial differential system

where the ‘human force’ of snail infection is given by integration over all age strata

Solving the second equation for y – equilibrium, and substituting in the first one, we get an integro-differential equation for w(a,t), similar to Chan and colleagues.]
Our main goal is to study endemic equilibria of system (1.8), particularly their dependence on the essential transmission parameters and chemotherapy controls. The analysis of equilibria also allows us to compare the performance of different targeted control strategies, and find an optimal one.
Our analysis exploits the concept of ‘basic reproduction matrix’ (defined below) – a generalization of the basic reproduction number, R0, defined in equation (1.2).
Note that chemotherapy controls enter system (1.8) through augmented worm attrition matrix, Γ+Θ, with diagonal treatment matrix

defined by the age dependent treatment frequencies (treatment vector)

. More generally, one could adapt chemotherapy control to both age and location. To this end, it is convenient to cast system (1.8) in terms of vector variables: ŵi=(wi,a) – age distribution of worm burden at site i, Ĥi=(Hi,a) – population strata,

– contact rates, and

contamination vectors,

We shall discuss, separately, two control strategies: (i) targeting age/behavioural subgroups across the entire region, so that all treatment matrices (at different sites) are equal, Θi=Θ; (ii) targeting high-risk locale(s), e.g. the sites i=4;10;… of Fig. 2, located closer to high density snail site I. Here

In either case, the community mean burden
, as well as its site/age distributions, will depend on

. One asks to minimize function

subject to certain constraints, the foremost of which is the cost constraint

– the maximum funds available for control.
Unlike the simple two-dimensional model (1.1) the extended system (1.9)–(1.10) allows no explicit analytic solutions to work with, but we can compute numerically suitable families of equilibrium solutions depending on its essential parameters (like the ‘basic reproduction scalar’ introduced below), and utilize suitable interpolation (approximation) procedures for the analysis of control.
RESULTS
Basic reproduction matrix and endemic equilibria of the extended model
By analogy with the single-site, two dimensional case (1.1), equilibria of system (1.8) depend on a matrix analog the basic reproduction number R0 (1.2), namely, an L×L (L – number of snail sites) basic reproduction matrix,

Its j, k entry measures a contribution of k-th snail site to schistosome reproduction at the j-th site, through distributed human intermediaries. We compute equilibria of (1.8), by first solving the ŵ-equations and then substituting it in the ŷ-equation. The offshoot is a nonlinear system for vector variable ŷ, and a linear operator relating ŵ to ŷ

The introduction of regular chemotherapy will change the worm attrition matrix Γ in (1.11)–(1.12) to Γ+Θ, and thus make R, ŷ, ŵ and the resulting community mean burden,

functions of the treatment frequencies

.
System (1.8) is known to have a nonzero stable (endemic) equilibrium (1.12), provided the largest eigenvalue λ1(R)>1. So λ1 plays the role of the ‘basic reproduction number’ for equation system (1.8).
To proceed further we make another simplifying assumption.
Independence hypothesis: we assume the basic environmental parameters are independent of age/behavioural factors. Mathematically, it would turn all essential variables and parameters into products of age-dependent and environmental terms. Specifically, we assume:
- identical age structure at each locale, with population fractions (age distribution), and
 (site distribution). So the population of a-th age stratum at i-th site is Hi,a=Hha*hi,
- a universal water contact frequency pattern defined for various age groups {ωa} (independent of location), multiplied by a hurdle factor {χij} to account for the geographical distance between the i (human) and j (snail) sites. In other words, each age stratum at site i redistributes its maximal contact rate ωa among different snail sites {j}, according to hurdle factors .
Thus our model environment has ‘product-type’ populations and contact patterns

For our numerical example (discussed below), we assume hurdle factors {χij} depend on geographical distances {dij} between human and snail sites via an ‘inverse square law’ (Haynes & Fotheringham, 1984). Let us note, however, that any other realistic hurdle pattern can easily be accommodated in our scheme.
While the demographic component (a) of (1.14) seems reasonable based on observed population structure in rural endemic households and villages (King et al. 2004), the validity of contact rate estimates (b) remains open (Muchiri, 1991). Further work, based on the available field data will test its (approximate) validity, find proper form of geographical hurdles, and possibly better spatial and socioeconomic models, in order to pattern a more realistic transmission environment (Woolhouse et al. 1998).
Under the independence hypothesis (1.14), the reproduction matrix R (1.11), the resulting worm burden distribution ŵ, and the community mean burden
, will all factor into products of environmental and age-dependent terms. Precisely,

is a product of the basic reproduction scalar (B.R.S.)

and a simplified ‘environmental’ matrix, R0, with entries

The former, ρ, encodes age-behavioural data, the latter accounts for the environmental factors (hurdles and spatial distribution of human and snail populations).
The resulting equilibrium snail infection prevalences and human worm burden (1.12) will depend on parameter ρ, through the infection potential. Namely, the (i,a) human stratum has burden

where û=(ua) designates a universal age pattern of burden distribution

while coefficient

represents (environmental) infection potential at site i due to snail prevalence distribution (at various sites j=1,…, L) via interconnecting hurdle factors. Hence, we find the community mean burden over the entire region

factors into a product of age-dependent terms

and the global infection potential

Rescaled model and its parameters
While certain variables and parameters used in system (1.8) are readily available from observational data (el Kholy et al. 1989; Clennon et al. 2004; Kariuki et al. 2004) and/or experiment, some others (e.g. probabilities of worm establishment {αa} or contamination rates {βa}) are uncertain, and can be estimated only by proxy data or through predicted outcomes. In general, given a multi-parameter system like (1.8), one tries to simplify (non-dimensionalize) it by rescaling variables and identifying the essential parameters.
We shall do it for system (1.8) assuming independence hypothesis. To this end we rescale all vector/matrix quantities by their ‘typical/maximal’ value, designated by ‘bar’ and the corresponding normalized dimensionless quantities (patterns) designated by ‘star’,

The analysis reveals two essential parameters of (1.8), namely a typical B.R.S. and typical worm burden,

We also introduce the dimensionless age pattern (of worm distribution)

and rescaled infection potential

All other parameters and equilibria of (1.8) are expressed through (1.24)–(1.26), namely,

and equilibrium burden distributions wi,a=w0fi*(ρ)ua* (by ‘age’ and ‘site’), hence

all w0 – multiples (1.24) of infection potential functions of ρ.
The age pattern û* represents a universal worm distribution by age observable in any locale (or over the region), under the independence hypothesis. Fig. 3 shows û* for the 12 age-bin strata. Here we used contact rates {ωa} of Chan et al. (1997), (tabulated in Table 1), a typical worm attrition

, and exponentially decreasing population fractions

. Qualitatively our worm burden pattern û* resembles the observed w-distributions (see, for example, Butterworth et al. (1996)). In endemic communities they typically peak between ages 10 and 20, then fall off (for older ages) by factor 10 or more in adult life (Butterworth et al. 1996). Such patterns cannot be explained by changing contact rates alone (for older groups). The additional protection, represented here by α*, could be acquired either through natural aging process (e.g. skin thickening or changing patterns of water exposure), or represent a function of the life-long worm exposure or egg-burden experience (acquired immunity). Here we shall consider only the former case (age-protection). The analysis of acquired immunity in a heterogeneous environment is more involved and we shall pursue it in a separate study. We demonstrate the effect of age-protection on burden patterns ŵ or û, by comparing the ‘unprotected’ distribution vs an ‘age-protected’ one (grey vs black on the right panel of Fig. 3). As expected, factors {0<αa*[les ]1} drive down the worm burden distribution for older groups. More significantly, the ratio of maximal-to-minimal burdens takes on a higher (more realistic) value in the latter case.

Fig. 3. The effect of an age-related protection factor {αa*} (left panel) that limits the rate of new infection on the mean worm burden age-distribution {wa} for fixed population fractions {ha*}, and contact rates {ωa*} of Table 1. In the right panel, grey bars indicate age-specific mean worm burden in the setting without age-related protection factors vs the setting where age-related protection is included (black bars).

Equations (1.20)–(1.23), or rescaled ones (1.25)–(1.27), yield a manageable formulation for analysis and therapy control. Indeed, control parameters {τ} will modify (augment) the worm attrition matrix Γ→Γ+Θ, and thus enter explicitly into scalar factors ρ,σ of (1.21). The infection potential, f(ρ), is constructed via numeric interpolation of functions (1.20), for computed snail infection prevalences ŷ(ρ) of (1.12).
Evaluation of control strategies based on drug therapy
We shall consider specifically, three cases of therapy-based control. (1) Age targeted strategy where all locales are treated identically, so all treatment matrices are equal {Θi=Θ; i=1,…, M}. (2) The general case that allows for site-specific and age-specific treatment at high risk locales. (3) An example of site-specific treatment of high risk locales (sites 4, 10, 11 on Fig. 2) treated in isolation.
Case 1
We apply the above ‘mean burden’ formulae (1.21)–(1.23) with teatment-augmented attrition matrix Γ+Θ. The corresponding scalars ρ(1.27) and σ(1.22) will depend now on treatment frequencies {τa}, hence the resulting community mean burden is
(τ1,…,τP). We compute numerically equilibrium snail infection prevalences {yj(ρ)} for a range of B.R.S. values:

, and find the corresponding (normalized) infection potential f*(ρ) of (1.20). Fig. 4 shows function f(ρ) for the model environment of Fig. 2, while Fig. 5 demonstrates site distribution of equilibrium snail infection prevalences {yj*(ρ)} and worm burdens {wi*(ρ)} for several selected values of the basic reproductive scalar, ρ.

Fig. 4. Infection potential f(ρ) (1.20), as a function of the basic reproduction scalar ρ, for model environment of Fig. 2.

Fig. 5. Site distribution of relative infection levels at equilibrium for different model locations, based on area transmission potential: mean worm burden (left column), and snail infection prevalence (right column) at selected values of normalized reproduction scalar ρλ1=3 (top panel); 5·5 (middle panel); and 8 (bottom panel).
Case 2
One can target chemotherapy at both high-risk population subgroups and/or locations. The location risk factor clearly exhibits itself in the elevated infection levels found at i=4, 10, 11, 12 (Fig. 5).
A general approach would require an array of treatment matrices {Θ1,…, ΘM} adopted for individual sites. Therefore, the basic reproduction matrix (1.11) would depend on several treatment frequency vectors

. The increased number of control parameters, however, is only part of the problem. More importantly, mathematical formulation of site-specific control problem becomes more involved. We provide details in Appendix 1, and here just state the results. The basic reproduction matrix will depend now on several parameters: R=ρR0 (r1,…), namely the previous B.R.S., ρ, and additional (site-specific) parameters

. One can think of ρ as B.R.S. of untreated populations, while

measures the long-term effect of focal treatment at site {i}. Hence equilibrium snail-site infection prevalences become multivariable functions ŷ(ρ; …, ri,…), and the corresponding community worm burden takes on the form

Here, σ corresponds to untreated value (1.22),

gives the effect of local treatment, and

The treatment frequencies

enter such
through variables ri, si, and we can formulate the corresponding control/optimization problem similar to Case 1. We do not pursue it here for two reasons (i) extra variables

add a substantial computational burden, (ii) in future programming development we do not foresee that this strategy wins compared to the age targeted (‘uniform’) teatment scheme of Case 1. Rather than the full-scale optimization, we shall estimate the efficacy of site-targeted control at high-risk locales, comparing them to untreated populations (see Case 3, below).
Case 3 (site-specific chemotherapy)
We want to examine the effect of selective treatment at high-risk locations. Our environment (Fig. 2) suggests that sites 4, 10, 11, and 12, close to a high-density snail site I, are high-risk locations, and Fig. 4 (untreated equilibria) corroborates such conclusion. For analysis of site-specific treatment, we choose sites i=4;10;11, hence an array of treatment matrices

According to (1.28) the community mean burden will take on the form

As discussed above for Case 2, the extra variables {ri,si} represent ratios of treated/untreated values of B.R.S., ρ and σ. Clearly, a treatment can only decrease ρi and σi, according to (1.16) and (1.22), so variables r,s change between 0 (extreme treatment) and 1 (untreated). They go down to zero with increasing frequencies,

. Thus, we get a crude estimate of the efficacy of focal treatment (and its effect on untreated populations) by comparing the two extremes.
Synthesis of chemotherapy strategies: analysis and optimization
Schistosomiasis can produce both short-term (acute) effects and long-term (chronic) illness, exemplified by hepatomegaly and Symmers's fibrosis. Here we consider only its short-term effects, and use worm burden as a crude proxy of acute morbidity, as correlated with the egg count and consequent illness. For other models of morbidity and its long-term (chronic) effects, we refer to (Medley & Bundy, 1996; Chan & Bundy, 1997). In particular, Chan et al. (1997) proposed, based on their analysis, a mass-treatment strategy comprised of 4 year treatment cycles administered over a 1 to 21 year span.
Here, we propose a similar strategy targeted at high-risk/exposure groups but, instead of a fixed 4-year cycle, we shall adjust treatment frequency {τa} for each age group, so as to minimize the overall mean worm burden of the entire community.
The important constraint for mass chemotherapy in many developing countries is limited available resources. In asking for the most efficient distribution of treatment efforts among various risk groups, we aim to attain the minimal community worm burden within a given cost constraint. We shall formulate the corresponding constrained optimization problem, assuming as above that the long-term effect of time-dependent (periodic) chemotherapy amounts to changing the natural worm attrition matrix Γ by the treatment matrix Γ+Θ, Θ=diag(τa).
The optimal control strategy then asks to distribute the available teatment resources among affected human groups, so as to attain the lowest community burden
(τ1,…,τP), subject to non-fixed (per capita) cost constraint C(τ1,…,τP)=C0, and the natural time constraints {0<τa<τmax}.
Although a treatment programme carries both fixed and non-fixed expenses, the non-fixed cost of treatment is clearly proportional to its frequency and the size of the targeted populations. Hence, the per capita non-fixed cost function in terms of population fractions, {ha*} becomes

where c0 denotes per capita cost of each treatment dispensed, and C0 is the amount actually allocted for control on a per capita basis. Here we used simple considerations of cost that result in a linear constraint (1.30). Other considerations, e.g. fixed costs or economies of scale, could produce nonlinear

, but, computationally, a particular form of C makes no difference in our approach to numeric solution.
For our analysis, we developed and implemented a numerical scheme based on Mathematica software package that computes equilibria ŷ(ρ) for a range of values 1/λ1(R0)=ρmin<ρ<ρmax, and runs optimization routine of the resulting mean burden
=σf(ρ).
In our model environment (Fig. 2), we stratified the population into 12 age-bins (with step Δa=5 years), and adopted the population data, contact patterns ω, and contamination rates β (Table 1), by the continuous model of Chan & Bundy (1997). Chan & Bundy suggested functional form:

,

with properly adjusted coefficients Ai, Bi. Their estimates are derived, initially, from data of the long-term study of S. mansoni transmission in St Lucia (Jordan, 1985), and validated against data from field studies of S. mansoni control in Kenya (Butterworth et al. 1991).
Based on these inputs, we computed and compared the age burden distribution (averaged over the entire community) without treatment and with optimal treatment at a fixed level of cost allocation, C0/c0=0·2, or 20 of the cost of total population coverage, and two distinct values of (untreated) B.R.S.: low values ρ=5ρmin (left panel of Fig. 6), and relatively high value ρ=20ρmin (right panel). Here ρmin=1/λ1(R0) is the minimal (bifurcation) value of B.R.S. required for the establishment of endemic infection equilibria. Although relatively low in the allocated cost ratio, such age-based optimized treatment would still allow a significant reduction of worm burden across all ages, but most significantly for the younger groups. The corresponding optimal treatment intervals {τa} for the first 6 age bins are shown in Table 2 for low and high B.R.S., ρ=5ρmin and 20ρmin. The optimization scheme here was applied only to the 6 youngest groups (below 30 years old), leaving older groups untreated.

Fig. 6. Comparison of age distributed equilibrium worm burdens {wa} wihout treatment (grey), and with optimal frequency age-specific treatment (black), at allocated/full treatment-cost ratio: C0/c0=0·2, for two values of basic reproduction scalar (B.R.S.), ρλ1=5 (low), and ρ=20ρmin (high).
Table 2. Optimal treatment periods (in years) for the first 6 age bins, at 20 allocation of full population coverage, at two values of the area-wide basic reproduction scalar (B.R.S., (1.16) ρ=5ρmin and 20ρmin. The last column shows the residual fraction of the community mean worm burden, , after implementation of drug-based control for those two settings.)

The next plot (Fig. 7) shows the optimally reduced community worm burden
of the entire population (solid black), and the corresponding treatment frequencies {τa} of the first 6 age groups (dashed curves of increasing dashing). We plot them over a range of the relative cost allocation parameter ξ=C0/c0, namely, 0·15<ξ<0·5 – for low B.R.S. ρ=5ρmin, and 0·2<ξ<0·95 for high B.R.S., ρ=20ρmin.

Fig. 7. Effect of optimized treatment on community mean worm burden (solid black). The optimal therapy frequencies {τa} for the 6 youngest age groups (dashed curves), are shown as functions of available funding, in terms of the ratio (allocated cost/cost of total population coverage) ξ=C0/c0, shown on the ordinate. In the setting where only 50 or fewer can be covered, then annual treatment of 6–15 year age groups (τ=1), combined with treatment every 4–10 years for younger and older age groups (τ=0·25 to 0·1), provides the maximal possible reduction in community worm burdens.
Let us note, that the optimization procedure must be terminated when the community mean burden

falls to a low (near eradication) level. So the former case (low B.R.S.) is terminated at about ξ=0·5, which means 50 population coverage could practically eradicate the infection. In the latter case (high B.R.S.) it would take a substantially higher value ξ>0·9. In either case, we see a significant reduction of

at moderate values of ξ.
Next we turn to control strategies targeting high risk sites, such as Site 4 on Fig. 2, having the greatest mean untreated worm burden (w-level, Fig. 5). Note that extreme intervention at selected locales will set a lower bound (on worm burden) for any other control strategy, including mixed age- and site-specific optimal control. Fig. 8 compares the community mean burdens
, as functions of the natural (pre-treatment) B.R.S. ρ, in two cases: (i) untreated population (thick line), which corresponds to ri=si=1, and (ii) ‘extremely treated’ site 4 (thin curve), i.e. r4=s4=0 in (1.29). The overall reduction is marginal, about 5–10 of the total mean burden, in curing the same proportion of the human population. The impact is reduced in the setting of increased ρ, and does not appear to offer any special leverage for effecting control.

Fig. 8. Community mean worm burden as a function of the basic reproduction scalar ρ0 in two cases: (a) untreated population (thick curve), and (b) location-specific treatment with village site 4 infections removed through eradication τa→∞ (thin curve). The difference between the two curves shows the best possible gain in overall area worm burden (about 10 reduction) attainable through the targeted treatment of site 4 alone. The dashed curve shows the relative overall gain in area worm burden between the two cases. It falls rapidly with ρ, so the targeted treatment of site 4 alone gives <10 reduction at moderate or higher values of reproduction scalar ρ (>30).
Fig. 9 compares site burden distribution

in two cases: ‘extreme control’ at sites i=4, 10, 11 (light gray) vs. ‘untreated populations’ (dark), for two values of the B.R.S. ρ. Again the gain at all sites (excepting 4, 10, 11) is marginal (far less than 50 reduction in worm burden), and becomes even less pronounced at larger ρ.

Fig. 9. Site distribution of worm burden for pre-treatment human populations (light bars), and the effect of extreme treatment for sites 4, 10 and 11 on the remaining untreated sites (dark bars). Left panel indicates overall impact under low transmission potential (ρ=7ρmin). Right panel indicates the lesser impact for untreated sites under conditions of high transmission potential (ρ=20ρmin).
We propose a plausible explanation for apparent inefficiency of the site-targeted control in our setup. This has to do with an overall connectivity of the snail-human system, that links (with nonzero contact probability ηia,j>0) any human site i and snail site j. By selectively suppressing sites i=4, 10, 11, but leaving other transmission channels open, the system can effectively restore the pre-treated high levels of infection. For comparison, the age control strategy, in particular, an optimal one applied across the entire region, appears far more efficient.
DISCUSSION
In our analysis, we examined the potential impact of area-wide strategies for control of spatially-distributed endemic schistosome infection, using a distributed Macdonald-type model created by matrix formulation. The modelling approach was tested in a hypothetical model environment developed using population and physical parameter estimates taken from multi-village field studies. Our first analyses of drug-based treatment strategies suggest an optimal, treatment-based control strategy for the entire meta-population via repeated (cyclic) chemotherapy that is targeted to the highest-risk age groups. With some differences in assigned treatment intervals, this approach is analogous to the current WHO recommendations for control of schistosomiasis (WHO, 2002). For a wide range of conditions, the computed optimal distribution of treatment predicts significant reduction of the community-wide mean worm burden at a relatively low cost, as reflected by significant reductions in the treated area's ‘basic reproduction matrix’ and ‘scalar’.
Previous authors' work has emphasized the importance of behavioural and spatial heterogeneities in enhancing transmission potential (R0) at specific locations (Chan et al. 1995; Woolhouse et al. 1998). One implication of their work is that an affordable means to identify high-risk features among subpopulations or subregions would offer potentially strong leverage in controlling transmission. This would be particularly true for larger areas having interconnected networks of transmission among human habitation clusters and multiple snail sites (Woolhouse et al. 1998). Given that praziquantel therapy has become the predominant mode of community-based schistosomiasis control (WHO, 2002), and the paucity of treatment alternatives, concern arises over the inevitable emergence of drug-resistant parasite strains (Brindley, 1994). An integrated management strategy, combining environmental controls (e.g. habitat modification, mollusciciding) and selective treatment targeted to high-risk human subjects, may prove more efficacious in reducing transmission and preventing disease over the long-term. Initial design of such programs will require an evaluation of the size and scope of each arm of the control programme, and the extent of interaction by humans with the transmission sites in the target area. Given that resources are limited for study of the many possible designs for such an integrated programme, a modelling effort, such as ours, may prove useful in choosing the most promising to test. Our programmed model attempts to incorporate both environmental and behavioural factors, but other important features, such as seasonal variation of snail populations, are not presently included. Future research will address non-steady dynamics of schistosome transmission, and the relevant issue of its impact on single or combined use of chemotherapy and molluscicide. In revealing the explicit relation between worm-burden distribution in human hosts and their water contact patterns, our analysis has further application in the identification of high/low risk assessment criteria based on geography of human habitation and snail sites (accessible by geographical information system (GIS) analysis), and the readily observable patterns of human exposure behaviour.
Other present limitations of the matrix model include the omission of long-term acquired immunity, of a ‘mating probability’ factor that limits reproductive potential of the mature dioecious parasites, and of external density (bottleneck) effects, which result in nonlinear force of snail infection. The net result may be that our model system underestimates the reproductive potential of the networked system, and that our estimates of treatment effects are too optimistic. For this reason, we have re-examined the outcomes of the different intervention strategies at differing levels of estimated transmission potential. While the site-specific strategy is seen to lose its impact on area-wide transmission at high levels of transmission potential, an optimally allocated age-targeted treatment strategy appears to maintain its effectiveness, even where overall transmission is high. One can accommodate acquired immunity by augmenting the basic ‘burden-prevalence’ model with additional immuno-effector variables and equations (see Chan et al. (1996)). The analysis of such extended systems in a distributed heterogeneous environment becomes more involved, and will be addressed in the future work. A further issue concerns the robustness of our predicted control strategies (exemplified in Figs 6 and 7) for a typical environment of Fig. 2. Our preliminary tests with randomly varying environment and behaviour (location of human and snail clusters, population densities, hurdle factors, contact rates, etc.) show the predicted age-based treatment frequencies {τa} fall within a fairly narrow range. This work is in progress now and will be reported elsewhere.
Lastly, let us comment on the scale of the system and its linking/hurdle patterns. The model example, assumes a fully linked human–snail environment, appropriate for relatively small scales (several to several dozen kilometers wide). While our methodology does not impose any constraints on the possible scale of the study region, clearly, larger regions, with continously distributed populations, may require a better representation of hurdle patterns and population densities.
Barbour (1978) originally proposed using an extended system of matrix modelling to capture the effects of individual and spatial heterogeneities in schistosomiasis transmission. As he indicated, such systems do not allow an explicit analytical solution, but as we have shown, they have now become amenable to numeric solution by desktop computation. Given the potential need for area-specific optimization of large-scale control programmes, further development and validation of such model systems appears warranted.
This work is supported by Fogarty International Center/NSF Ecology of Infectious Disease Program grant TW/ES01543, ‘Human Population Growth Impact on S. haematobium Transmission’. We are indebted to our co-investigators, Eric Muchiri, John Ouma, and Curtis Kariuki at the Division of Vector Borne Diseases/KEMRI in Nairobi, Kenya; Joseph Hamburger and Orit Hoffmann at the Hebrew University of Jerusalem, Israel; and Uriel Kitron and Julie Clennon at the University of Illinois, Urbana-Champaign, Illinois, for their helpful discussions of this analysis. We also thank the anonymous referees for thoughtful comments and constructive suggestions that helped to improve the contents and presentation of the paper.
APPENDIX 1. MODEL FOR SITE-SPECIFIC CONTROL
Site-specific control augments worm attrition matrix Γ with treatment matrices: Γi=Γ+Θi, at site i. It will formally break the strict independence of ‘behaviour vs environment,’ and confound the structure of the basic reproduction matrix. It is convenient to write the basic model (1.8) for vector variables:

– age burden distribution at site i, and ŷ=(yj), as

where P×L matrices Ai and L×P matrices Bi have entries

i.e., products of establishment/contamination rates, contact frequencies, population densities and environmental hurdles. The resulting basic reproduction matrix takes on the form

Note, that Case 1 (uniform community-wide treatment) would make all matrices Θi=Θ, hence factorization formula R=ρR0 with ‘behavioural’ scalar

and environmental matrix R0, (1.15)–(1.17). The new matrix R(A1) has entries

Hence its ŷ – equilibria will depend on several (independent variables

. As any treatment can only lower the value of B.R.S. (1.16), we can rescale all variables ρi relative to the maximal (untreated) value ρ, and write R=ρR0(r1,…). The equilibrium y – vector, becomes a function of ρ and ‘treated’ ratios

; (0<ri[les ]1). Hence the worm burden vector at each site i,

The resulting community mean burden, formerly

, acquires a new set of variables ri, and similarly defined

(1.22),

Note that for an untreated population all extra variables {ri,si} collapse to 1, and
restores its original form (1.21). A targeted chemotherapy would render each variable ri; si dependent on treatment frequency array

, hence yielding

amenable for analysis and control.
APPENDIX 2. DETAILS OF THE MODEL TRANSMISSION ENVIRONMENT
Our model environment consists of 12 human clusters (labelled by numerals 1, 2,…) and 10 snail sites (labelled by letters A, B,…) shown on the map (Fig. 2), with randomly chosen population fractions and snail densities. We subdivide each local population Hi into age-behavioural strata {ha*}, and assigned each one a contact frequency pattern (risk factor ωa) and contamination factor βa of Table 1. We can then set local stratified populations Hi,a=Hiha*, and write the water contact frequency pattern, ηi,a;j=ωaχij as products of ‘universal’ ωa, and ‘geographic’ hurdle factors, depending on distance between the i and j sites χij=χ(dij). For the present analysis, we use an ‘inverse square law’ for

. While Haynes & Fotheringham (1984) provided some justification for this choice, further field studies will determine the proper geographical hurdles associated with water use in different schistosomiasis transmission areas. Clearly, any hurdle function, deemed a natural choice, could be easily accommodated in our scheme.
Equilibria patterns for the model environment
The endemic equilibria of such a system depend on the largest eigenvalues of matrix R (see equation (1.11), which are λ1(R)=ρλ1(R0). In our geographical setup with population densities of Fig. 2 and hurdle factors
, the largest eigenvalue of matrix R0 is λ1=0·14. It has stable zero equilibrium (eradication), as long as the largest eigenvalue of λ1(R)=ρ λ1(R0) is less than 1. Therefore, eradication would require treatment or other control measures to bring reproduction scalar ρ below 1/λ1≈6·5. Above this critical value, system (1.8) undergoes the so-called transcritical bifurcation, whereby zero becomes unstable, and a nonzero stable (endemic) equilibrium (1.12) takes over.
Fig. 4 illustrates the normalized burden

=σf(ρ) of the meta-population as a function of the normalized parameter ρ/λ1, while Fig. 5 shows equilibrium worm burden distributions across the different villages and the corresponding snail infection prevalence values at the different snail sites for several increasing estimates of ρ/λ1. For comparison, the estimated values of the ‘basic reproduction numbers’ in highly endemic areas of Kenya and Uganda are probably much higher. The results clearly indicate high risk at human sites i=4, 10, 11, and 12, and at high prevalence snail sites j=H and I, that, together, lie in close proximity on the map (Fig. 2) in terms of geographical distance.
References
REFERENCES
AGWANDA, R. O. (
1997).
The epidemiology of Schistosoma mansoni in Machakos/Makueni Districts of Kenya: Exploratory analysis of factors affecting transmission of the parasite. Ph.D. thesis,
Department of Medical Parasitology, London School of Hygiene and Tropical Medicine,
London.
ANDERSON, R. M. &
MAY, R. M. (
1991 a).
The basic model: statics. In
Infectious Diseases of Humans. Dynamics and Control, pp.
467–496.
Oxford University Press,
New York.
ANDERSON, R. M. &
MAY, R. M. (
1991 b).
The basic model: dynamics. In
Infectious Diseases of Humans. Dynamics and Control, pp.
507–520.
Oxford University Press,
New York.
BARBOUR, A. D. (
1978).
Macdonald's model and the transmission of bilharzia.
Transactions of the Royal Society of Tropical Medicine and Hygiene
72,
6–15.CrossRefGoogle Scholar
BARBOUR, A. D. (
1996).
Modeling the transmission of schistosomiasis: an introductory view.
American Journal of Tropical Medicine and Hygiene
55,
135–143.CrossRefGoogle Scholar
BAVIA, M. E.,
HALE, L. F.,
MALONE, J. B.,
BRAUD, D. H. &
SHANE, S. M. (
1999).
Geographic information systems and the environmental risk of schistosomiasis in Bahia, Brazil.
American Journal of Tropical Medicine and Hygiene
60,
566–572.CrossRefGoogle Scholar
BRINDLEY, P. J. (
1994).
Drug resistance to schistosomicides and other anthelmintics of medical significance.
Acta Tropica
56,
213–231.CrossRefGoogle Scholar
BUTTERWORTH, A. E.,
DUNNE, D. W.,
FULFORD, A. J.,
OUMA, J. H. &
STURROCK, R. F. (
1996).
Immunity and morbidity in Schistosoma mansoni infection: quantitative aspects.
American Journal of Tropical Medicine and Hygiene
55,
109–115.CrossRefGoogle Scholar
BUTTERWORTH, A. E.,
STURROCK, R. F.,
OUMA, J. H.,
MBUGUA, G. G.,
FULFORD, A. J.,
KARIUKI, H. C. &
KOECH, D. (
1991).
Comparison of different chemotherapy strategies against Schistosoma mansoni in Machakos District, Kenya: effects on human infection and morbidity.
Parasitology
103,
339–355.CrossRefGoogle Scholar
CHAN, M. S.,
ANDERSON, R. M.,
MEDLEY, G. F. &
BUNDY, D. A. (
1996).
Dynamic aspects of morbidity and acquired immunity in schistosomiasis control.
Acta Tropica
62,
105–117.CrossRefGoogle Scholar
CHAN, M. S. &
BUNDY, D. A. (
1997).
Modelling the dynamic effects of community chemotherapy on patterns of morbidity due to Schistosoma mansoni.
Transactions of the Royal Society of Tropical Medicine and Hygiene
91,
216–220.CrossRefGoogle Scholar
CHAN, M. S.,
GUYATT, H. L.,
BUNDY, D. A.,
BOOTH, M.,
FULFORD, A. J. &
MEDLEY, G. F. (
1995).
The development of an age structured model for schistosomiasis transmission dynamics and control and its validation for Schistosoma mansoni.
Epidemiology and Infection
115,
325–344.CrossRefGoogle Scholar
CLENNON, J. A.,
KING, C. H.,
MUCHIRI, E. M.,
KARIUKI, H. C.,
OUMA, J. H.,
MUNGAI, P. &
KITRON, U. (
2004).
Spatial patterns of urinary schistosomiasis infection in a highly-endemic area of coastal Kenya.
American Journal of Tropical Medicine and Hygiene
70,
443–448.Google Scholar
EL KHOLY, H.,
ARAP SIONGOK, T. K.,
KOECH, D.,
STURROCK, R. F.,
HOUSER, H.,
KING, C. H. &
MAHMOUD, A. A. (
1989).
Effects of borehole wells on water utilization in Schistosoma haematobium endemic communities in Coast Province, Kenya.
American Journal of Tropical Medicine and Hygiene
41,
212–219.CrossRefGoogle Scholar
GRYSEELS, B. (
1996).
Uncertainties in the epidemiology and control of schistosomiasis.
American Journal of Tropical Medicine and Hygiene
55 (Suppl.),
103–108.CrossRefGoogle Scholar
GUYATT, H. L. &
TANNER, M. (
1996).
Different approaches to modeling the cost-effectiveness of schistosomiasis control.
American Journal of Tropical Medicine and Hygiene
55,
159–164.CrossRefGoogle Scholar
HAYNES, K. E. &
FOTHERINGHAM, A. S. (
1984).
Gravity and Spatial Interaction Models.
SAGE Publications,
Inc., Beverly Hills, CA.
JORDAN, P. (
1985).
Schistosomiasis: The St. Lucia Project.
Cambridge University Press,
Cambridge.
KARIUKI, H. C.,
CLENNON, J. A.,
BRADY, M.,
KITRON, U.,
STURROCK, R. F.,
OUMA, J. H.,
TOSHA, S.,
NDZOVHU, M.,
MUNGAI, P.,
HAMBURGER, J.,
HOFFMAN, O.,
PELLEGRINI, C.,
MUCHIRI, E. M. &
KING, C. H. (
2004).
Distribution patterns and cercarial shedding of Bulinus nasutus and other snails in Msambweni area, Coast Province, Kenya.
American Journal of Tropical Medicine and Hygiene
70,
449–456.Google Scholar
KING, C. H.,
BLANTON, R. E.,
MUCHIRI, E. M.,
OUMA, J. H.,
KARIUKI, H. C.,
MUNGAI, P.,
MAGAK, P.,
KADZO, H.,
IRERI, E. &
KOECH, D. (
2004).
Low heritable component of risk for infection intensity and infection-associated disease in urinary schistosomiasis among Wadigo village populations in Coast Province, Kenya.
American Journal of Tropical Medicine and Hygiene
70,
57–62.Google Scholar
KING, C. H.,
LOMBARDI, G.,
LOMBARDI, C.,
GREENBLATT, R.,
HODDER, S.,
KINYANJUI, H.,
OUMA, J.,
ODIAMBO, O.,
BRYAN, P. J.,
MURUKA, J.,
MAGAK, P.,
WEINERT, D.,
MACKAY, W.,
RANSOHOFF, D.,
HOUSER, H.,
KOECH, D.,
SIONGOK, T. K. &
MAHMOUD, A. A. F. (
1988).
Chemotherapy-based control of schistosomiasis haematobia. I. Metrifonate versus praziquantel in control of intensity and prevalence of infection.
American Journal of Tropical Medicine and Hygiene
39,
295–305.Google Scholar
KING, C. H. &
MAHMOUD, A. A. (
1989).
Drugs five years later: praziquantel.
Annals of Internal Medicine
110,
290–296.CrossRefGoogle Scholar
KING, C. H.,
MUCHIRI, E. M. &
OUMA, J. H. (
1992).
Age-targeted chemotherapy for control of urinary schistosomiasis in endemic populations.
Memorias do Instituto Oswaldo Cruz
87,
203–210.CrossRefGoogle Scholar
MacDONALD, G. (
1965).
The dynamics of helminth infections, with special reference to schistosomes.
Transactions of the Royal Society of Tropical Medicine and Hygiene
59,
489–506.CrossRefGoogle Scholar
MALONE, J. B.,
HUH, O. K.,
FEHLER, D. P.,
WILSON, P. A.,
WILENSKY, D. E.,
HOLMES, R. A. &
ELMAGDOUB, A. I. (
1994).
Temperature data from satellite imagery and the distribution of schistosomiasis in Egypt.
American Journal of Tropical Medicine and Hygiene
50,
714–722.CrossRefGoogle Scholar
MEDLEY, G. E. &
BUNDY, D. A. (
1996).
Dynamic modeling of epidemiologic patterns of schistosomiasis morbidity.
American Journal of Tropical Medicine and Hygiene
55, (Suppl.)
149–158.CrossRefGoogle Scholar
MIGUEL, E. &
KREMER, M. (
2004).
Worms: identifying impacts on education and health in the presence of treatment externalities.
Econometrica
72,
159–217.CrossRefGoogle Scholar
MUCHIRI, E. M. (
1991).
Association of water contact activities and risk of reinfection for S. haematobium after drug treatment in the Msambweni Area, Kenya. M.S. thesis,
Epidemiology and Biostatistics. Case Western Reserve University,
Cleveland.
MUCHIRI, E. M.,
OUMA, J. H. &
KING, C. H. (
1996).
Dynamics and control of Schistosoma haematobium transmission in Kenya: an overview of the Msambweni Project.
American Journal of Tropical Medicine and Hygiene
55 (Suppl.),
127–134.CrossRefGoogle Scholar
WEBSTER, J. P.,
DAVIES, C. M.,
NDAMBA, J.,
NOBLE, L. R.,
JONES, C. S. &
WOOLHOUSE, M. E. (
2001).
Spatio-temporal genetic variability in the schistosome intermediate host Biomphalaria pfeifferi.
Annals of Tropical Medicine and Parasitology
95,
515–527.CrossRefGoogle Scholar
WORLD HEALTH ORGANIZATION (
2002).
Prevention and control of schistosomiasis and soil-transmitted helminthiasis.
Report of a WHO Expert Committee, pp. 34–35.
WHO,
Geneva.
WOOLHOUSE, M. E. (
1991).
On the application of mathematical models of schistosome transmission dynamics. I. Natural transmission.
Acta Tropica
49,
241–270.Google Scholar
WOOLHOUSE, M. E. (
1992).
On the application of mathematical models of schistosome transmission dynamics. II. Control.
Acta Tropica
50,
189–204.CrossRefGoogle Scholar
WOOLHOUSE, M. E.,
DYE, C.,
ETARD, J. F.,
SMITH, T.,
CHARLWOOD, J. D.,
GARNETT, G. P.,
HAGAN, P.,
HII, J. L.,
NDHLOVU, P. D.,
QUINNELL, R. J.,
WATTS, C. H.,
CHANDIWANA, S. K. &
ANDERSON, R. M. (
1997).
Heterogeneities in the transmission of infectious agents: implications for the design of control programs.
Proceedings of the National Academy of Sciences, USA
94,
338–342.CrossRefGoogle Scholar
WOOLHOUSE, M. E.,
ETARD, J. F.,
DIETZ, K.,
NDHLOVU, P. D. &
CHANDIWANA, S. K. (
1998).
Heterogeneities in schistosome transmission dynamics and control.
Parasitology
117,
475–482.CrossRefGoogle Scholar
ZHOU, X.,
DANDAN, L.,
HUIMING, Y.,
HONGGEN, C.,
LEPING, S.,
GUOJING, Y.,
QINGBIAO, H.,
BROWN, L. &
MALONE, J. B. (
2002).
Use of landsat TM satellite surveillance data to measure the impact of the 1998 flood on snail intermediate host dispersal in the lower Yangtze River Basin.
Acta Tropica
82,
199–205.CrossRefGoogle Scholar
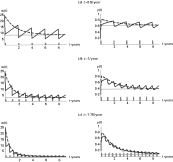
Fig. 1. Solid and dashed curves show solutions for mean worm burden (w(t), left panels) and prevalence of infected snails (y(t), right panels) of the exact system (Equation 1.4, solid lines) and its ‘averaged’, effective attrition system (Equation 1.5, dashed lines), for three increasing values of treatment frequency, τ. Grey bars indicate individual treatment events. Grey lines in the left panel indicate ultimate equilibrium values of mean worm burden for the conditions shown.
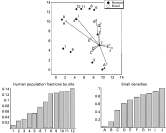
Fig. 2. Model environment made of 12 human clusters and 10 snail sites with selected marked distances (top), along with their assigned population fractions (bottom left) and snail densities (bottom right).
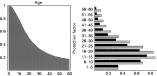
Fig. 3. The effect of an age-related protection factor {αa*} (left panel) that limits the rate of new infection on the mean worm burden age-distribution {wa} for fixed population fractions {ha*}, and contact rates {ωa*} of Table 1. In the right panel, grey bars indicate age-specific mean worm burden in the setting without age-related protection factors vs the setting where age-related protection is included (black bars).
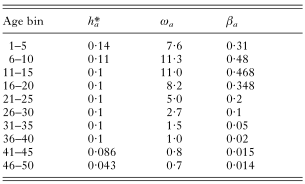
Table 1. Age groups, population fractions, and contamination factors for the model system (the values of ω and β) are computed from exposure and contamination age-functions of Chan & Bundy (1997)
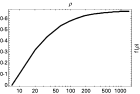
Fig. 4. Infection potential f(ρ) (1.20), as a function of the basic reproduction scalar ρ, for model environment of Fig. 2.
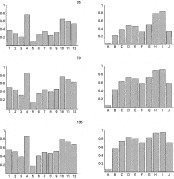
Fig. 5. Site distribution of relative infection levels at equilibrium for different model locations, based on area transmission potential: mean worm burden (left column), and snail infection prevalence (right column) at selected values of normalized reproduction scalar ρλ1=3 (top panel); 5·5 (middle panel); and 8 (bottom panel).
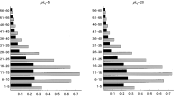
Fig. 6. Comparison of age distributed equilibrium worm burdens {wa} wihout treatment (grey), and with optimal frequency age-specific treatment (black), at allocated/full treatment-cost ratio: C0/c0=0·2, for two values of basic reproduction scalar (B.R.S.), ρλ1=5 (low), and ρ=20ρmin (high).
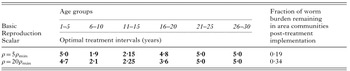
Table 2. Optimal treatment periods (in years) for the first 6 age bins, at 20 allocation of full population coverage, at two values of the area-wide basic reproduction scalar
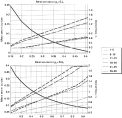
Fig. 7. Effect of optimized treatment on community mean worm burden (solid black). The optimal therapy frequencies {τa} for the 6 youngest age groups (dashed curves), are shown as functions of available funding, in terms of the ratio (allocated cost/cost of total population coverage) ξ=C0/c0, shown on the ordinate. In the setting where only 50 or fewer can be covered, then annual treatment of 6–15 year age groups (τ=1), combined with treatment every 4–10 years for younger and older age groups (τ=0·25 to 0·1), provides the maximal possible reduction in community worm burdens.
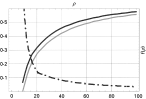
Fig. 8. Community mean worm burden as a function of the basic reproduction scalar ρ0 in two cases: (a) untreated population (thick curve), and (b) location-specific treatment with village site 4 infections removed through eradication τa→∞ (thin curve). The difference between the two curves shows the best possible gain in overall area worm burden (about 10 reduction) attainable through the targeted treatment of site 4 alone. The dashed curve shows the relative overall gain in area worm burden between the two cases. It falls rapidly with ρ, so the targeted treatment of site 4 alone gives <10 reduction at moderate or higher values of reproduction scalar ρ (>30).
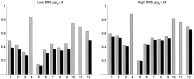
Fig. 9. Site distribution of worm burden for pre-treatment human populations (light bars), and the effect of extreme treatment for sites 4, 10 and 11 on the remaining untreated sites (dark bars). Left panel indicates overall impact under low transmission potential (ρ=7ρmin). Right panel indicates the lesser impact for untreated sites under conditions of high transmission potential (ρ=20ρmin).
 You have
Access
- 35
- Cited by