Introduction
Understanding the first 2 weeks of cattle embryonic development is of scientific as well as commercial relevance as during this period the greatest rate of conceptus loss is seen (Ayalon, Reference Ayalon1978; Sartori et al., Reference Sartori, Bastos and Wiltbank2010; Diskin et al., Reference Diskin, Parr and Morris2011). The problem is equally apparent in embryo transfer experiments. Growing embryos in culture to the blastocyst stage and then transferring into recipients revealed losses of 24% in the second week of development (Berg et al., Reference Berg, van Leeuwen, Beaumont, Berg and Pfeffer2010).
Such losses may not be surprising, considering the critical developmental events that occur during this week (Pfeffer, Reference Pfeffer, Juengel, Miyamoto and Webb2014; van Leeuwen et al., Reference van Leeuwen, Berg and Pfeffer2015). At the end of the first week, the successful embryo has undergone the first lineage specification event resulting in two distinct lineages, namely the inner cell mass (ICM) and the outer trophectoderm. The trophectoderm becomes committed to the trophoblast fate during the second week (Berg et al., Reference Berg, Smith, Pearton, Wells, Broadhurst, Donnison and Pfeffer2011), then gradually starts to form a subpopulation (20%) of interspersed terminally differentiated binucleate cells (Wooding, Reference Wooding1992). Towards the end of the second week, the trophoblast overlying the epiblast (termed Rauber's layer or polar trophoblast) has disappeared, exposing the outer surface of the ICM/epiblast to the maternal environment (van Leeuwen et al., Reference van Leeuwen, Berg and Pfeffer2015). The inner cell mass forms two layers by embryonic day 9 (day 0 corresponds to fertilization), namely the epiblast and underlying hypoblast (Maddox-Hyttel et al., Reference Maddox-Hyttel, Alexopoulos, Vajta, Lewis, Rogers, Cann, Callesen, Tveden-Nyborg and Trounson2003). The hypoblast (also termed primitive endoderm) migrates to line the entire blastocyst cavity thus underlying both the epiblast and the trophoblast. The hypoblast under the epiblast is now at Stage 2, (see van Leeuwen et al., Reference van Leeuwen, Berg and Pfeffer2015, for staging used here) termed the visceral hypoblast, whereas that underlying the ‘mural’ trophoblast is the ‘parietal’ hypoblast (mural and parietal are derived from Latin: ‘belonging to walls’ to indicate their structurally supportive function for the embryo proper). From approximately 12 days after fertilization (Stage 3), one end of the visceral hypoblast changes morphology, becoming thicker, with projections to the epiblast. This thickened area is termed the anterior visceral hypoblast (AVH) and is presumed to be homologous to the anterior visceral endoderm (AVE) of the mouse and the anterior marginal crescent of the rabbit by virtue of expressing NODAL signalling inhibitors (van Leeuwen et al., Reference van Leeuwen, Berg and Pfeffer2015). The mouse AVE has been shown to direct gastrulation (which requires NODAL) to the opposite end of the epiblast (Lu et al., Reference Lu, Brennan and Robertson2001).
After the overlying trophoblast has disappeared, the epiblast − during Stage 4 − transitions into a one- to two-cell layered epithelium, known as the embryonic ectoderm (EmE). By Stage 5, cells accumulate at the posterior margin of the EmE and then will translocate in a medial anterior direction, forming a groove (the primitive streak) with the funnel-shaped node at its anterior end. Some cells at the posterior margin and along the primitive streak and node will undergo an epithelial−mesenchymal transition and migrate out of the plane of the EmE. Endoderm cells will integrate into the underlying visceral hypoblast layer, displacing these cells in an anterior direction. Mesoderm cells will populate the space between the EmE and hypoblast/endoderm. Mesoderm cells migrating beyond the borders of the EmE will come to line the trophoblast and parietal hypoblast and thus form extraembryonic mesoderm. Mesoderm cells underlying the EmE form the (embryonic) mesoderm layer. At this stage AVH markers are no longer detectable (van Leeuwen et al., Reference van Leeuwen, Berg and Pfeffer2015). The epiblast or EmE and underlying layers are easily identifiable by dissecting microscope and are collectively termed the embryonic disc.
While we have recently described the morphology of, and expression of, select genes in the various tissues seen at these embryonic stages (van Leeuwen et al., Reference van Leeuwen, Berg and Pfeffer2015), little information is known about the global transcriptome at the tissue level. Whole embryo gene expression profiling has been reported (Mamo et al., Reference Mamo, Mehta, McGettigan, Fair, Spencer, Bazer and Lonergan2011), however such studies would predominantly capture the trophoblast tissue as the parietal hypoblast to trophoblast cell ratio is only about 1 to 10 and the embryonic disc represents an even smaller part of the whole conceptus during this period. We have here exploited the power and accuracy of RNA-seq combined with an isothermal amplification procedure to allow us to capture the gene expression profile of all four separable tissues of a single cattle early gastrulation (Stage 5) embryo. To allow a better developmental understanding of the complex embryonic disc tissue, we additionally included the analysis of a Stage 4 disc.
Materials and Methods
Embryo collection and dissection
All animal work was approved by the Ruakura Animal Ethics committee RAEC 12025 (Hamilton, New Zealand) and all efforts were made to minimize suffering. In vitro produced embryos were generated as previously described (Berg et al., Reference Berg, van Leeuwen, Beaumont, Berg and Pfeffer2010), using oocytes from uncharacterised dairy cows and sperm from a Friesian bull. On day 7 following IVF, Grade 1 and Grade 2 blastocysts were transferred to recipient animals and recovered on day 14 or 15 after fertilization, as previously described in detail (van Leeuwen et al., Reference van Leeuwen, Berg and Pfeffer2015). Reagents were from Sigma if not indicated otherwise. After collection in ePBS (enriched phosphate-buffered medium: Ca-/Mg-free PBS tablets with 0.0132 g/l CaCl2.2H2O, 0.010 g/l MgCl2.6H2O, 0.036 g/l sodium pyruvate, 1 g/l glucose, penicillin/streptomycin and 10% FCS), embryos were split into TB and embryonic disc-containing parts, then washed three times for 5 min in DMEM. The embryonic disc was cut away from surrounding tissue using microknives (Ultra Sharpe Splitting Blades, Bioniche Animal Health Asia, Australia), then digested for 3 min on ice with pancreatin/trypsin (2.5% w/v pancreatin; 0.5% trypsin; 0.5% polyvinylpyrrolidone) in Ca-/Mg-free Tyrodes−Ringers saline (per litre 8.0g NaCl, 0.30 g KCl, 0.093 g NaH2PO4.5H2O, 0.025g KH2PO4, 1.0 g NaHCO3, 2.0 g glucose). The disc was transferred to cold DMEM with 10% FCS and the underlying endoderm/mesoderm/visceral hypoblast layer carefully peeled off the embryonic ectoderm using watchmaker's tweezers (Dumont #5 biologie, ProSciTech, Australia). Both tissues were rinsed in cold PBS before transferral in 1 μl volume to 0.6 ml microcentrifuge tubes and freezing in liquid nitrogen before storage at −80°C. TB and parietal hypoblast required a 5 to 6 min enzymatic digestion period. For this work, all four tissues, from a single day 15 embryo, were used for RNA sequencing. Additionally a whole embryonic disc from a day 14 embryo was analysed. At that developmental stage we were unable to cleanly separate the embryonic ectoderm and underlying visceral hypoblast. Physical characteristics of these two embryos are shown in Table 1.
Embryo characteristics

RNA sequencing
RNA was isolated using Trizol, followed by DNase I digestion and ethanol precipitation as previously described (Smith et al., Reference Smith, Berg, Beaumont, Standley, Wells and Pfeffer2007). RNA was amplified by isothermal strand displacement using the Ovation RNA-seq V2 system (NuGEN; Millennium Science, Wellington, NZ), which enriches for poly-A-containing mRNA. Yields of amplified cDNA were between 6.6 and 11 μg. Amplified DNA was sent to Macrogen (Seoul, Korea) for Illumina library construction (RNA TruSeq) and sequencing (Illumina HiSeq2000). Both ends of fragments (average length between 441 and 501 bp) at a sequencing depth of 46 to 74 million per sample (Table 2). Illumina 1.9 encoding indicated excellent sequencing quality (scores >28) of reads up to 100 bp. Regions of low quality sequence and Illumina primers and adapters remaining from the sequencing process were removed from the reads using Flexbar (Dodt et al., Reference Dodt, Roehr, Ahmed and Dieterich2012). The trimmed reads were then mapped against the Bos taurus UMD3.1 genome using TopHat software (Trapnell et al., Reference Trapnell, Pachter and Salzberg2009), and against the NCBI Bos taurus RefSeq mRNA using BWA (Li & Durbin, Reference Li and Durbin2009). The percentages mapped are shown in Table 1. Reads mapping to the RefSeq database were normalised for transcript length (FPK, Fragment reads Per Kilobase of exon) then adjusted using negative binomial modelling and the edgeR program (Robinson et al., Reference Robinson, McCarthy and Smyth2010) within R (R Core Team, 2014). Total numbers of adjusted FPK for the five samples ranged from 8.3 to 8.6 million and were converted to FPKM (FPK per million reads). The data are available as Supporting Information (Table S1).
Overview of RNA-seq results

a Percentage uniquely mapped to RefSeq database (NCBI) RNA sequences.
b Number of fragments (excluding those already mapped to RefSeq) uniquely mapped to Bos taurus UMD3.1 genome.
Disc, embryonic disc; EmE, embryonic ectoderm; MEH, mesoderm, endoderm and visceral hypoblast; PH, parietal hypoblast; TB, trophoblast.
Data analysis
An FPKM of one for a RefSeq (NCBI) transcript (subsequently referred to as ‘gene’) corresponds to approximately one mRNA molecule per cell (Mortazavi et al., Reference Mortazavi, Williams, McCue, Schaeffer and Wold2008). Samples exhibiting an FPKM for a gene of less than one were set to equal 1 (‘cut-off’). Genes for which FPKM = 1 for all five samples were ignored. All analyses were done on log (base two) transformed values. For differential expression analyses, expression levels were classified into 10 log base 2 ‘bins’ (0 to 11), with bin ‘x’ containing values where x ≤ log2 (FPKM) < (x + 1) for x = 1 to 10. For bin 11 (x = 11), x was ≤ log2 (FPKM), with no upper limit, to capture all highly expressed genes. Binary patterns were derived following the concept of Yanai et al. (Reference Yanai, Benjamin, Shmoish, Chalifa-Caspi, Shklar, Ophir, Bar-Even, Horn-Saban, Safran, Domany, Lancet and Shmueli2005). For this calculation, a ‘gap’ index was assigned to each gene by sorting the bin values of the five samples and determining the maximum difference (‘gap’) between neighbouring values. For profiles with a gap of at least 3 (corresponding to a greater than four-fold difference in expression), expression above the gap was classified as over-expressed (= 1), below as under-expressed (0) (Yanai et al., Reference Yanai, Benjamin, Shmoish, Chalifa-Caspi, Shklar, Ophir, Bar-Even, Horn-Saban, Safran, Domany, Lancet and Shmueli2005). Where two gaps were found for one gene, the lower bin value was used. Where no gap was found, expression was set to 1 (expressed) for all samples with an FPKM value above the cut-off. The binary expression values for each gene were assembled into a five digit pattern, e.g. DEMHT = 01010 means that this gene in: Stage 4 embryonic disc (= D) is not expressed, EmE (= E) is expressed, MEH (= M) is not expressed, PH (= H) is expressed and TB (= T) is not expressed. The binary codes were used to exclude ‘common’ genes expressed in all (code 11111) or all-but-one samples (01111, 10111, 11011, 11101, 11110), and for generating (using Microsoft Excel) the data in the Venn diagram (Fig. 1E). The Venn diagram was populated manually using a graphics program (Adobe Illustrator). The principal component analysis was generated using the pca.srbct function in R (R Core Team, 2014), using all genes for which expression was evident in at least one sample. Our gene expression data and assembled lists of genes (genes associated with mouse embryonic stages and tissues; genes expressed in cattle blastocyst lineages) were uploaded and analysed via the Ingenuity Core program (Qiagen, Dusseldorf, Germany). For creating the cattle blastocyst lists, the published gene sets (Nagatomo et al., Reference Nagatomo, Kagawa, Kishi, Takuma, Sada, Yamanaka, Abe, Wada, Takahashi, Kono and Kawahara2013; Ozawa et al., Reference Ozawa, Sakatani, Yao, Shanker, Yu, Yamashita, Wakabayashi, Nakai, Dobbs, Sudano, Farmerie and Hansen2012) for each lineage (ICM and TE) were compared and genes expressed in both datasets were used. P-values for analyses of Pathways, Biological functions and curated gene list comparisons were calculated within Ingenuity using the right-tailed Fisher's Exact Test.
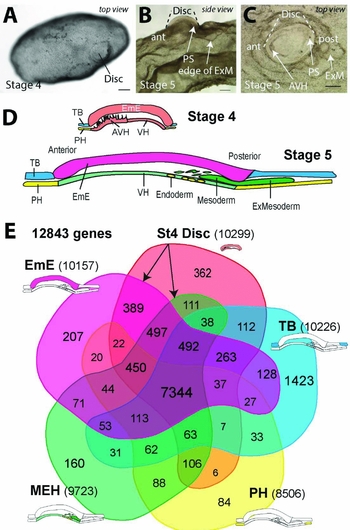
Differential expression of genes. (A−C) Features of Stage 4 and Stage 5 embryos as seen before dissection. Scale bars are 200 μm. (D) Embryonic regions are graphically depicted (cross-section through embryo, colour coded) with nomenclature as previously defined (van Leeuwen et al., Reference van Leeuwen, Berg and Pfeffer2015). (E) Venn diagrams of differentially expressed genes with insets showing origin of tissues. Arrows indicate that EmE and MEH are descendant tissues of Stage 4 embryonic disc. AVH, anterior visceral hypoblast; disc, embryonic disc; E, endoderm; EmE, embryonic ectoderm; ExM, extraembryonic mesoderm; PH, parietal hypoblast; PS, primitive streak region; TB, trophoblast; VH, visceral hypoblast.

Results
Sample characteristics and gene expression
Four tissue types were analysed from an embryo, which was generated by in vitro embryo production, then transferred as an expanded blastocyst into a synchronised recipient cow and retrieved 14 days after fertilization. Using embryo size and epiblast size (Table 1 and Fig. 1), the embryo was classified as Stage 5, early gastrulation (van Leeuwen et al., Reference van Leeuwen, Berg and Pfeffer2015). The four tissues included the upper layer of the embryonic disc, which is composed of the embryonic ectoderm (EmE), wherein the primitive streak and node form; the cells underlying the embryonic ectoderm composed of a mixture of visceral hypoblast cells, endoderm and mesoderm (MEH); parietal hypoblast (PH) and trophoblast (TB).
PH and TB were taken well away from the embryonic disc to remove the possibility of contamination with extraembryonic mesoderm, which at this stage migrates out from the edges of the embryonic disc in-between the TB and PH and was evident under the dissecting microscope (Fig. 1 B, C). The position of these tissues are indicated (Fig. 1 D, E). Lastly, an embryonic disc of a Stage 4 embryo was analysed (Table 1 and Fig. 1 A). In total, 50 million to 70 million reads were obtained for each tissue. Mapping revealed that a quarter of reads could be assigned to known reference sequences, except for the TB tissue, for which only an eighth could be assigned. The overall fraction of sequence that could be matched to the bovine genome was between 70 and 81% (Table 2). It is unclear whether the lower reference sequence recognition rate for the TB tissue is caused by an experimental artefact such as increased DNA contamination in the RNA preparation or has a biological reason such as differential splicing or increased transcription of non-reference genes.
In total, 12,843 genes were found to be expressed. For analysing differential expression among the figures tissues we used an algorithm that incorporated relative expression levels in addition to a more simple lower threshold level (Yanai et al., Reference Yanai, Benjamin, Shmoish, Chalifa-Caspi, Shklar, Ophir, Bar-Even, Horn-Saban, Safran, Domany, Lancet and Shmueli2005). Thus greater than four- to eight-fold jumps (or ‘gaps’, see Materials and methods) in expression levels were also considered in scoring expression, with only tissues above this gap scored as over-expressing a gene. Using this scheme and representing the results in a five-fold Venn diagram (Fig. 1 E), revealed the following:
-
• The early disc has more uniquely expressed genes (362) than either of its descendant tissues (EmE, 207; MEH, 160).
-
• The Stage 5 EmE is much more closely related to the Stage 4 embryonic disc than is the Stage 5 MEH tissue (389 versus 111).
-
• The parietal hypoblast is most closely related to the MEH tissue.
-
• The trophoblast shows the most divergent gene expression profile with a large number of genes (14% of TB genes) uniquely expressed. The other tissues only contain 1 to 4% unique genes.
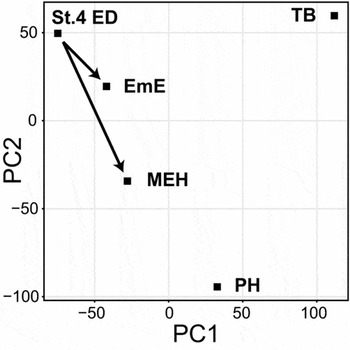
We further compared the relatedness of the five tissues using principal component analysis without scoring for differential expression (Fig. 2). This comparison again revealed the close relationship of the Stage 5 EmE to the Stage 4 disc, a greater divergence of the MEH and the large divergence of the Stage 5 PH and TB tissues form the early disc. Notably the Stage 5 parietal hypoblast is most similar to the MEH (mesendoderm and visceral hypoblast) presumably as both share hypoblast-derived tissue.
Principal component analysis of gene expression. Arrows indicate developmental resolution of Stage 4 embryonic disc into the Stage 5 derivatives of embryonic ectoderm and underlying visceral hypoblast/mesendoderm. Principal component variable 1 (PC1) explained 42% of the variation, PC2 32%. ED, embryonic disc; EmE, embryonic ectoderm; MEH, mesoderm, endoderm, visceral hypoblast; PH, parietal hypoblast; TB, trophoblast.

Comparison of bovine to mouse embryonic gene expression profiles
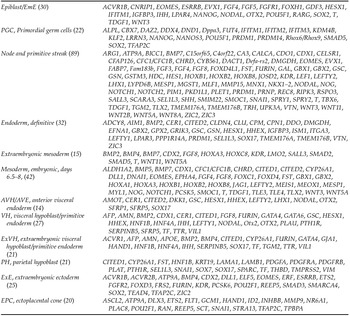
We next asked how similar the tissues that we isolated were to mouse embryonic tissues. Lists of genes expressed in particular embryonic tissues and cells were compiled based on published whole mount in situ expression patterns from embryonic day 5.5 to 8 pre- to post-gastrulation mouse embryos (Table 3).
List of mouse gene sets and domains they are expressed in

Sourced data from: EMAGE gene expression database (http://www.emouseatlas.org/emage/) and Familari (Reference Familari2006); Rielland et al. (Reference Rielland, Hue, Renard and Alice2008); Brown et al. (Reference Brown, Legros, Artus, Doss, Khanin, Hadjantonakis and Foley2010); Ewen & Koopman (Reference Ewen and Koopman2010); Roberts & Fisher (Reference Roberts and Fisher2011); Pfeffer & Pearton (Reference Pfeffer and Pearton2012); Magnúsdóttir et al. (Reference Magnúsdóttir, Gillich, Grabole and Surani2012, Reference Magnúsdóttir, Dietmann, Murakami, Günesdogan, Tang, Bao, Diamanti, Lao, Gottgens and Azim Surani2013); Pearton et al. (Reference Pearton, Smith, Redgate, van Leeuwen, Donnison and Pfeffer2014); and Richardson et al. (Reference Richardson, Venkataraman, Stevenson, Yang, Moss, Graham, Burton, Hill, Rao, Baldock and Armit2014).
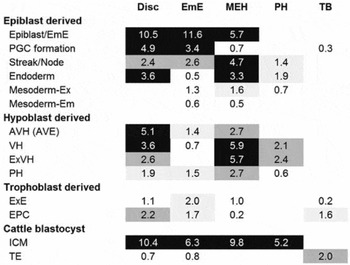
Only genes represented in four or less of the 12 mouse tissues were used. These lists were compared with our bovine tissue lists compiled by excluding common genes (expressed in more than three of the five samples) and including, for each tissue, only the genes scored as (over)-expressed according to our algorithm. As whole mount in situ hybridization is not as sensitive as RNA-seq, a higher cut-off of FPKM = 2 was used. The significance of the overlaps between the bovine and mouse lists is shown in Fig. 3.
Comparison to marker genes. For each tissue all genes differentially expressed above a FPKM cut-off of 2 but excluding those common to at least four of the five tissues, were compared to curated sets of mouse tissue-specific genes (Table 3), listing the −log(P-value) of the dataset overlaps. Shading indicates the significance levels visually: black, P < 0.001; dark grey, P < 0.01; light grey, P < 0.05 (e.g. 1.3 = −log(0.05)). AVE, anterior visceral primitive endoderm; EPC, ectoplacental cone (mouse); Em, embryonic; Ex, extraembryonic; ExE, extraembryonic ectoderm; PGC, primordial germ cells; PH, parietal endoderm/hypoblast; VH, visceral endoderm/hypoblast.

Key observations are:
-
• Stage 4 Embryonic disc is most similar to mouse epiblast/embryonic ectoderm tissue, anterior visceral endoderm (hypoblast) and primordial germ cells.
-
• Stage 5 EmE tissue closely resembles the mouse EmE tissue and also matches mouse primordial germ cell gene markers.
-
• MEH tissue is heterogeneous in its gene expression profile matches. On the one hand, the nascent endomesodermal cells reflect their embryonic ectodermal origin, and show highly significant matches to mouse primitive streak and node markers, definitive endoderm and extraembryonic mesoderm. Of note, no similarity to embryonic mesoderm is seen at this stage. On the other hand, the hypoblast component of the MEH expression profile matches mouse visceral as well as extraembryonic visceral endoderm/hypoblast. The tissue exhibits weaker similarity to mouse AVE markers and parietal endoderm/hypoblast.
-
• Cattle PH expression most resembles mouse visceral endoderm/hypoblast genes but notably shows little similarity to mouse parietal endoderm/hypoblast.
-
• Cattle TB shows some similarity (P < 0.05) only to genes expressed in mouse ectoplacental cone trophoblast tissue.
The five cattle tissues were also compared with lineage-specific cattle embryo datasets. Two published gene expression lists (Nagatomo et al., Reference Nagatomo, Kagawa, Kishi, Takuma, Sada, Yamanaka, Abe, Wada, Takahashi, Kono and Kawahara2013; Ozawa et al., Reference Ozawa, Sakatani, Yao, Shanker, Yu, Yamashita, Wakabayashi, Nakai, Dobbs, Sudano, Farmerie and Hansen2012) of cattle day 8 ICM (embryonic disc precursor) and trophectoderm were compared with the day 15 tissues (Fig. 3). As expected, all four ICM-derived tissues correlated well with the cattle ICM gene sets but not with the day 8 TE, whereas the converse was true for the trophoblastic tissues.
Pathway analyses
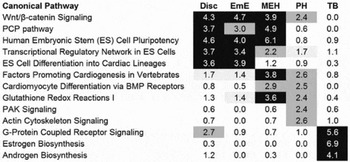
We next analysed the differentially expressed genes using Ingenuity pathway analysis (FPKM > 1, excluding common genes). The Stage 4 embryonic disc and its developmental derivatives, Stage 5 EmE and MEH, all scored highest for two categories of pathway (Fig. 4). One involves WNT signalling including both the canonical (β-CATENIN dependent) and non-canonical WNT/PCP (planar cell polarity) pathways. The other category is based on embryonic stem (ES) cell networks. MEH and PH tissues scored for cardiogenesis. Among the top hits for PH were PAK and actin cytoskeleton signalling. These are related as PAK mediates actin cytoskeletal rearrangements. TB scored highly for G-protein coupled receptor signalling and steroidogenic pathways with this tissue expressing all genes required for ADHE (dehydroepiandrosterone) to 5α-dihydro-testosterone or to estradiol-17β conversion.
Canonical pathway analysis, Ingenuity pathway analysis, excluding genes co-expressed in more than four tissues, displaying the −log(P-value) of the highest scoring pathways for each tissue. Shading indicates the significance levels visually: black, P < 0.001; dark grey, P < 0.01; light grey.

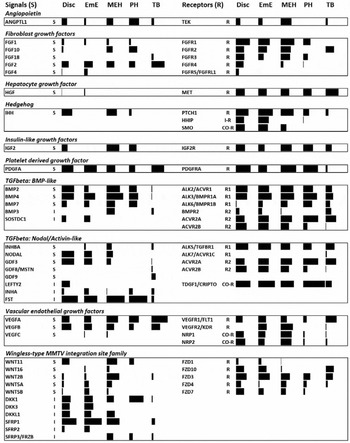
Signalling pathways were analysed in terms of receptor and ligand transcription, using all expressed genes and a curated list (Fig. S1) of 131 growth factors/cytokines and their 69 receptors/receptor co-factors derived from Ingenuity and KEGG databases. All ligand families, for which at least one signal and matching receptor was expressed, are depicted in Fig. 5. ANGIOPOIETIN-LIKE 1 is produced in large quantities by PH, though this tissue has no receptor for it, suggesting it acts on the adjacent TB tissue, which does express TEK. Of the growth factors that predominantly act through the RAS-RAF-Classical MAPK pathway, the ERBB (EGF) family was not detected. However, FGFs and PDGFs were found to be well represented. FGF2 is widely expressed at high levels, with hypoblast-containing tissues additionally expressing FGF10, and the EmE co-expressing FGF4. All tissues expressed a range of FGF receptors, except TB which only expressed FGFR2. PDGFA and its receptor were expressed in all tissues, albeit at highly variable levels with hypoblast-containing tissues (PH, MEH) containing abundant receptors, while the overlying epithelia (TB and EmE, respectively) expressing the most ligand, suggesting a paracrine interaction. VEGFA and B, which act via numerous intracellular pathways, were ubiquitously expressed, with the VEGFA receptor transcribed at the highest level in TB, whereas the B receptor and NRP co-receptors were exclusive to the EmE and MEH tissues. INSULIN-like signalling (IGF2) emanated predominantly from hypoblast-containing tissue, while receptors were ubiquitous. INDIAN HEDGEHOG was transcribed in the Stage 4 disc and Stage 5 MEH, with abundant receptor and co-receptors in disc, MEH and EmE, although disc and EmE also expressed high amounts of the inhibitory membrane protein HHIP. The BMP-branch of TGFβ signalling was well represented via BMP2, 4 and 7 expression in all tissues except TB, and ubiquitous expression of the receptors (Type 1: ALK2, ALK3, Type 2: ACVR2A). Few of the large array of BMP inhibitors were expressed. Of the TGFβ/NODAL/ACTIVIN-like ligands, TGFβ ligands were detected at less than 2 FPKM (not shown in Fig. 5), however, NODAL and GDF3 were robustly transcribed at Stage 4 and at Stage 5 in the EmE and MEH. The widespread and extensive transcription of the ACTIVIN inhibitor FOLLISTATIN would suggest that the modest amount of INHBA (ACTIVIN A subunit) made in MEH would have little effect. Curiously, the NODAL/GDF3 type 1 receptors ALK4 and ALK7 were absent in all tissues, whereas the TGFβ-specific ALK5 receptor was detected, as was the NODAL co-receptor CRIPTO. Lastly, WNT signalling, in concurrence with the pathway analyses, was prominent in the embryonic disc-related tissues (disc/EmE/MEH), while the receptor FRIZZLED-3 was expressed in all tissues at high levels. The main ligands were WNT11 (disc, EmE), WNT2B (MEH) and WNT5A and B (EmE, MEH). Notably, WNT inhibitors are also expressed at very high levels, in particular SFRP1 in the disc-related tissues, and DKK1 in PH.
Expression levels of genes coding for secreted signalling factors (S), inhibitors (I), receptors (R) and co-receptors (CO-R) in embryonic tissues. The size of the black bars is proportional to the log of the expression level.

Discussion
The pre-gastrulation Stage 4 embryonic disc
The Stage 4 disc is a heterogeneous structure, characterised by a 2-cell layered epithelium that is the embryonic ectoderm (EmE) and the visceral hypoblast layer beneath it. Both are derived from the ICM and the transcriptome of the disc showed the greatest resemblance of all five tissues to ICM gene sets. One important developmental event occurring as embryos transit from Stage 3 to Stage 4 is the expansion of the anterior visceral hypoblast (AVH) signalling centre and indeed the mouse AVE-specific markers LEFTY2, GSC, SFRP1 and HHEX were detected in the Stage 4 embryonic disc. CER1, a cattle AVH marker detectable by in situ hybridization (van Leeuwen et al., Reference van Leeuwen, Berg and Pfeffer2015), lay below our cut-off, possibly because of a combination of low expression and a limited expression domain. In terms of signalling pathways, at this stage NODAL becomes progressively restricted to the posterior end of the EmE, where it induces the process of gastrulation (van Leeuwen et al., Reference van Leeuwen, Berg and Pfeffer2015). We noted the disc to express the highest levels of NODAL, as well as GDF3, which can also signal via the NODAL pathway (Andersson et al., Reference Andersson, Bertolino and Ibanez2007). Surprisingly though, while type 2 NODAL/GDF3 receptors and the essential NODAL signalling cofactor CRIPTO were robustly expressed, neither of the required type 1 receptors (ALK4, ALK7) known to mediate NODAL signalling in mouse embryos (Moustakas & Heldin, Reference Moustakas and Heldin2009) could be detected. Potentially the strongly expressed ALK5 receptor, known to mediate signalling for other members of this branch of TGFβ ligands (such as TGFβ1–3, GDF1, 3, 8, 9) (Moustakas & Heldin, Reference Moustakas and Heldin2009), is used at these cattle embryonic stages to transmit NODAL signalling. Alternatively, in cattle, GDF3 could be mediating the effects attributed to NODAL in the mouse. This issue merits further investigation. WNT signalling was evidenced by WNT11 and receptors FZD3, 4, 7 and 10 expression. Significantly, WNT11 signals via the PCP non-canonical pathway and this pathway has been linked in amniotes to medio-lateral cell intercalations in the embryonic ectoderm preceding and during gastrulation (Voiculescu et al., Reference Voiculescu, Bertocchini, Wolpert, Keller and Stern2007). FGF signalling is represented by FGF2 and transcription of all known FGF receptors. The exclusive expression of FGF2 differs from mouse embryos, which do not express FGF2 until mid-gastrulation stages (Wordinger et al., Reference Wordinger, Smith, Bell and Chang1994; Taniguchi et al., Reference Taniguchi, Harada, Yoshida, Iwabe, Onohara, Tanikawa and Terakawa1998), but express the closely related FGF4 and FGF8 instead (Niswander & Martin, Reference Niswander and Martin1992; Crossley & Martin, Reference Crossley and Martin1995).
The Stage 5 extraembryonic ectoderm (EmE)
The Stage 5 EmE and Stage 4 disc are remarkably similar in terms of: (i) their transcriptomes, uniquely sharing 389 genes; (ii) their transcriptomes plot closely together upon PCA analysis; (iii) these tissues sharing the same top five canonical pathways; and (iv) scoring similarly highly in comparisons with the mouse epiblast/embryonic ectoderm gene set. The Stage 5 EmE as well as Stage 4 disc expressed all three master regulators of stemness/pluripotency, namely POU5F1 (OCT4), SOX2 and NANOG (Boyer et al., Reference Boyer, Lee, Cole, Johnstone, Levine, Zucker, Guenther, Kumar, Murray, Jenner, Gifford, Melton, Jaenisch and Young2005; Wang et al., Reference Wang, Oron, Nelson, Razis and Ivanova2012) as well as KLF4, OTX2, PRDM14, SALL4, STAT3 and ZIC3 (Tsubooka et al., Reference Tsubooka, Ichisaka, Okita, Takahashi, Nakagawa and Yamanaka2009; Acampora et al., Reference Acampora, Di Giovannantonio and Simeone2013; Dunn et al., Reference Dunn, Martello, Yordanov, Emmott and Smith2014). The function of the Oct4−SOX2−NANOG (OSN) network is to keep cells in an undifferentiated state primed for differentiation and thus the continued expression of the OSN network is likely to explain the overall similarity of gene expression in the EmE tissues of Stages 4 and 5. Interestingly, these tissues also displayed a high similarity to the list of mouse primordial germ cell (PGC) markers. In mouse embryos, PGC are specified in the embryonic ectoderm from embryonic day 6.25, just before gastrulation starts (Magnúsdóttir et al., Reference Magnúsdóttir, Gillich, Grabole and Surani2012). While the first PGC-specifying gene, PRDM1 (BLIMP1) and the PGC marker DDX4 are transcribed only early on, at Stage 4, the downstream cascade represented by PRDM14, which is essential for PGC development, TFAP2C, DND1, and the requisite pluripotency OSN triumvirate (Youngren et al., Reference Youngren, Coveney, Peng, Bhattacharya, Schmidt, Nickerson, Lamb, Deng, Behringer, Capel, Rubin, Nadeau and Matin2005; Yamaji et al., Reference Yamaji, Seki, Kurimoto, Yabuta, Yuasa, Shigeta, Yamanaka, Ohinata and Saitou2008; Magnúsdóttir et al., Reference Magnúsdóttir, Dietmann, Murakami, Günesdogan, Tang, Bao, Diamanti, Lao, Gottgens and Azim Surani2013), are all expressed at both stages. We conclude that in cattle, PGCs originate around Stage 4 and are found in the embryonic ectoderm layer at Stage 5, when gastrulation starts.
In mice, gastrulation is preceded by NODAL signals switching on canonical WNT signalling in the embryonic ectoderm and BMP signals in the adjacent trophoblast, with all three signals then required for inducing prospective endoderm and mesoderm [reviewed in (Arnold & Robertson, Reference Arnold and Robertson2009)]. NODAL/GDF3 and WNT signal/receptor transcription was also seen in the cattle embryonic ectoderm, however, unlike the mouse, BMP2/4/7 ligands were not expressed in the trophoblast but induced in the EmE itself, as well as in the subjacent layer of hypoblast/mesendoderm (the MEH). This situation makes sense in that, in cattle, no trophoblast tissue overlies the EmE at these stages, due to the different morphology of the cattle and mouse early gastrula. A second difference lies in the specific WNT ligand expressed: mice require WNT3 for gastrulation (Liu et al., Reference Liu, Wakamiya, Shea, Albrecht, Behringer and Bradley1999), but in cattle WNT5B is expressed instead. Molecularly, NODAL/WNT/BMP signalling switches on three key genes that drive mesendoderm generation in vertebrates, namely EOMESODERMIN, BRACHYURY and MIXL1 (Arnold et al., Reference Arnold, Stappert, Bauer, Kispert, Herrmann and Kemler2000; Hart et al., Reference Hart, Hartley, Sourris, Stadler, Li, Stanley, Tam, Elefanty and Robb2002; Hart et al., Reference Hart, Willson, Wong, Parker and Robb2005; Robertson, Reference Robertson2014). The cattle homologues are all expressed in the Stage 5 embryonic ectoderm (Table S1). In mice, prospective mesendodermal cells in the embryonic ectoderm are induced to undergo a epithelial−mesenchymal transition and to migrate out of this layer under the influence of FGF signalling, as shown by FGF8 (with concomitant loss of FGF4 expression) and FGFR1 knock-outs (Sun et al., Reference Sun, Meyers, Lewandoski and Martin1999; Brewer et al., Reference Brewer, Molotkov, Mazot, Hoch and Soriano2015). Notably, FGF8 expression was not detected in cattle embryos, however the ubiquitous FGF2 transcription was boosted in Stage 5 EmE by FGF4 expression. As FGF2/4/8 all activate the same receptor isoforms (Ornitz et al., Reference Ornitz, Xu, Colvin, McEwen, MacArthur, Coulier, Gao and Goldfarb1996), the change in the cattle versus mouse transcriptional networks may be without phenotypic consequence.
The lower layer of the Stage 5 embryonic disc
Gene expression comparisons of the MEH with the mouse lists indicated the expression of node and primitive streak markers pointing to nascent mesendoderm formation. Interestingly the ingressing cells exhibited mainly extraembryonic mesoderm and endoderm characteristics, whereas embryonic mesoderm markers were not expressed. We conclude that in cattle, cells giving rise to definitive endoderm and mesodermal cells of extraembryonic fate are the first to migrate out of the EmE. Extraembryonic mesoderm cells are those that subsequently line the trophoblast, yolk sac and amnion and presumably also give rise to the allantois (Maddox-Hyttel et al., Reference Maddox-Hyttel, Alexopoulos, Vajta, Lewis, Rogers, Cann, Callesen, Tveden-Nyborg and Trounson2003; Vejlsted et al., Reference Vejlsted, Du, Vajta and Maddox-Hyttel2006).
In mice the (embryonic) visceral hypoblast/endoderm lines the EmE (Kaufman, Reference Kaufman1995). In this species the cup-shaped EmE abuts along its rim a distinct type of proliferative trophoblast, termed the extraembryonic ectoderm (ExE). At the implantation end of the egg cylinder the ExE then merges into the ectoplacental cone (EPC) and the rest of the mural trophoblast. The hypoblast that lines the ExE is the extraembryonic visceral hypoblast and that covering the EPC and rest of the mural trophoblast is the parietal hypoblast. This distinction between embryonic and extraembryonic visceral hypoblast cannot be made in cattle embryos based on morphological criteria, as no anatomical homologue to the ExE exists in this species. Similarly, the MEH gene expression data comparisons with the mouse tissues allow no molecular distinction to be made between these two types of visceral hypoblast tissue in cattle.
In comparison with the EmE, the MEH layer exhibited a distinctly different signalling transcriptome:
-
(i). TGFβ signalling was shifted from a NODAL-like to a BMP-like dominant program. This is likely related to the formation of the extraembryonic mesoderm as BMPs have been shown to be essential for the development of this tissue (Zhang & Bradley, Reference Zhang and Bradley1996).
-
(ii). WNT ligands were transcribed at greater levels with the appearance of WNT11 and WNT2B as well as WNT5A transcription. The overall much lower levels of receptors (FRIZZLED 1 and 10 were switched off) points to a MEH-derived WNT role predominantly in the overlying EmE. The high levels of WNT2A in the MEH may aid in canonical WNT signalling in the EmE as previously discussed, whereas WNT5A and WNT11 have been associated with planar cell polarity (PCP) mediated convergence extension movements required, at this stage, for the lengthening of the primitive streak (Andre et al., Reference Andre, Song, Kim, Kispert and Yang2015).
-
(iii). The appearance of FGF10 in MEH (and PH) may be cattle-specific as FGF10 is seen in mouse embryos only at late gastrulation stages (Tagashira et al., Reference Tagashira, Harada, Katsumata, Itoh and Nakatsuka1997).
-
(iv). HEDGEHOG signalling ligands and receptors (IHH, PTCH1, SMO) were detected in the EmE/VH tissues of the Stage 4 disc and this signalling is continued at Stage 5 with the signal, INDIAN HEDGEHOG (IHH), being exclusively transcribed in the visceral hypoblast-containing MEH layer. During mouse embryogenesis, IHH is expressed only in the VH, but required for the differentiation of the adjacent EmE into neuroectoderm as gastrulation commences (Maye et al., Reference Maye, Becker, Siemen, Thorne, Byrd, Carpentino and Grabel2004). The expression of IHH receptor and co-receptor (PTCH1 and SMO) in the EmE (SMO is transcribed at three-fold lower levels in the MEH) supports a similar vertical signalling role for IHH in cattle EmE specification.
-
(v). Similarly, IGF2 is expressed in MEH, but not EmE, whereas the receptor is ubiquitous.
Parietal hypoblast
The cattle parietal hypoblast underlying the trophoblast is destined, together with a lining of extraembryonic mesoderm, to form the yolk sac (Betteridge & Flechon, Reference Betteridge and Flechon1988). The overlap with the mouse parietal hypoblast marker list was not significant. Instead a high significance was seen with mouse embryonic and extraembryonic visceral hypoblast, suggesting that the differentiation of hypoblast into the visceral and parietal lineages is dissimilar in mice and cattle. Pathway analyses gave few clues as to the function of this tissue with relatively low significant hits of a more general nature, including two matches for pathways involving the actin cytoskeleton.
The PH transcribes few growth factors and a more limited range of receptors than the previously discussed tissues. In particular NODAL-like and WNT signals are not transcribed and receptors for FGF, VEGF, HEDGEHOG, WNT and ANGEIOPOIETIN signalling are absent or transcribed at low levels. However, PDGF receptor A is expressed at very high levels and the overlying TB produces the ligand at very high levels. Indeed in mouse embryos roles for PDGFRA in the expansion of the hypoblast and formation of the yolk sac has been shown (Ogura et al., Reference Ogura, Takakura, Yoshida and Nishikawa1998; Artus et al., Reference Artus, Panthier and Hadjantonakis2010). This role is likely to be conserved in cattle with the likely source being trophoblastic.
The high expression of ANGIOPOIETIN-LIKE-1, but not its receptor, may relate to the paracrine induction of blood vessels in the extraembryonic mesoderm, which will line this layer at later stages.
Trophoblast
The Stage 5 trophoblast exhibited the most unique transcriptome of those investigated, as seen in the principal component analysis and the large set of uniquely expressed genes. This uniqueness ties in with the fact that the trophoblast is the first lineage to be specified and that by day 14, TB is committed to its fate (Berg et al., Reference Berg, Smith, Pearton, Wells, Broadhurst, Donnison and Pfeffer2011). This situation is corroborated by the switching on of steroidogenic enzyme transcription (pathway analyses), characteristic of steroid-hormone producing mature trophoblast. Unexpectedly, the mouse trophoblast-specific gene lists aligned slightly more significantly to the cattle EmE than TB. The mouse gene lists were assembled from genes expressed either in the extraembryonic ectoderm (ExE) or the ectoplacental cone (EPC). The ExE, from which mouse trophoblast stem cells can be derived, harbours predominantly undifferentiated trophoblast cells some of which will give rise to syncytiotrophoblast cells, while the EPC contains more differentiated cells, destined to become either spongiotrophoblast or various types of secondary giant cells (Pfeffer & Pearton, Reference Pfeffer and Pearton2012). Cattle do not appear to contain cells equivalent to syncytio- or spongiotrophoblast thus explaining the low concordance with the mouse trophoblast lists. More fundamentally, the trophoblast differences highlight that this tissue, which gives rise to the placenta, is evolutionarily speaking relatively new, its origin lying near the start of the divergence of eutherian mammals. Different species of mammals have elaborated on the requirements of gestation in radically different ways (such as the cattle minimally invasive synepitheliochorial versus the mouse invasive hemochorial modes of placentation), requiring large adaptive changes in the trophoblast which would be reflected in distinct transcriptomes.
In spite of these differences, two key trophoblast aspects appear to have been at least partly conserved. The first is lineage specification. In mice the trophoblast lineage specification and determination network involves the key genes Cdx2, Gata3, Tfap2a, Tfap2c, Elf5, Eomes and Ets2 with Ascl2 appearing in slightly more differentiated cells (Pfeffer & Pearton, Reference Pfeffer and Pearton2012). Except for Eomes, these genes were also detected in Stage 5 TB. The absence of EOMES from cattle TB has been noted previously using real-time PCR (Smith et al., Reference Smith, Berg, Berg and Pfeffer2010). The second commonality involves FGF signalling, which appears to be involved in both species although with a distinct variation in signal source. Mouse proliferative trophoblast and trophoblast stem cells exhibit a requirement for FGF signalling believed to emanate in vivo predominantly from the mouse EmE in the form of FGF4 (Tanaka et al., Reference Tanaka, Kunath, Hadjantonakis, Nagy and Rossant1998). We found here that Stage 5 TB contains FGFR2 and synthesises FGF2 itself. Further FGF signalling may be delivered in a paracrine fashion in the form of FGF10 transcribed in the subjacent PH. Due to the different topology of the mouse and cattle conceptuses, cattle embryos cannot rely on the EmE as a FGF source, because unlike in the mouse, most of the cattle trophoblast is simply physically to distant from this EmE. Hence an autocrine production of this signal and/or a supply from the hypoblast may be adaptations to meet a conserved TB requirement for FGF signalling.
This analysis of the transcriptome of all four major tissues of the same embryo at a single moment of developmental time allowed unique insights into the different events occurring at the start of gastrulation. While focussing on tissues of a single embryo ensures consistency in terms of developmental stage, it does not address issues of consistency of expression across similarly staged embryos. Such expression may vary for some genes such as those exhibiting oscillatory behaviour (Phillips et al., Reference Phillips, Manning, Pettini, Biga, Marinopoulou, Stanley, Boyd, Bagnall, Paszek, Spiller, White, Goodfellow, Galla, Rattray and Papalopulu2016). As more studies of all tissues of individual embryo transcriptomes are analysed a full and detailed transcriptional atlas will be able to be mapped out, paving the way for assembling the gene regulatory networks that need to be understood so as to alleviate early embryo mortality.
Acknowledgements
This work was supported by CORE funding from the Ministry of Business and Innovation, New Zealand, to AgResearch, and by the 2014 Agresearch Science Prize, New Zealand. We thank Martyn Donnison for help and advice with embryo dissections and Dr Diane Ormsby for critical reading of the manuscript.
Supporting information
Supporting information is available for this article online at the publisher's website. Figure S1 and Table S1
Supplementary material
To view supplementary material for this article, please visit https://doi.org/10.1017/S0967199417000090