





Introduction
Since the mid-20th century, many Western democracies have undergone significant changes to their party systems. One of the most notable changes is the rise of parties with no governmental experience. In the mid-1950s, less than 10 % of voters chose these so-called challenger parties, whereas by the mid-2010s, that number had increased to around 25 % (De Vries and Hobolt Reference De Vries and Hobolt2020). Simultaneously with this development, voters have become more distrustful of political institutions, prompting researchers to question whether modern democracies are experiencing a legitimacy crisis (Merkel Reference Merkel2014; Valgarðsson, Jennings, Stoker et al. Reference Valgarðsson, Jennings, Stoker, Bunting, Devine, McKay and Klassen2025; van der Meer Reference van der Meer and Hannah2016). Evidently, this high political distrust shows up in voters’ perceptions of election promises. A large majority of the electorate perceives politicians as promise-breakers (Naurin Reference Naurin and Naurin2011), even though parties fulfill most of their promises (Naurin, Royed and Thomson Reference Naurin, Royed and Thomson2019; Thomson, Royed, Naurin et al. Reference Thomson, Royed, Naurin, Artés, Costello, Ennser-Jedenastik, Ferguson, Kostadinova, Moury, Pétry and Praprotnik2017).
The rise of challenger parties and increasing distrust in politics are two co-occurring phenomena that might be related. One reading of the literature on challenger parties suggests that these parties are primarily populist and attack the establishment without taking responsibility themselves (Kollberg Reference Kollberg2025; Licht, Abou-Chadi, Barbera et al. Reference Licht, Abou-Chadi, Barbera and Hua2025). They may simply make a lot of promises since they are not held accountable for them, unlike governmental parties, who are punished by voters for broken promises (see Matthieß Reference Matthieß2020, Reference Matthieß2022, Reference Matthieß2024; Naurin, Soroka and Markwat Reference Naurin, Soroka and Markwat2019). In a similar vein, Piccirilli (Reference Piccirilli2025) develops theoretical models showing that new parties will be compelled to make more excessive campaign promises to signal competence compared to their more experienced competitors. If emerging challenger parties make promises they never fulfill, they might not resolve the trust crisis in modern democracies; rather, they may accelerate it – thereby speaking to the broader debate in the literature on populism as a threat to democracy (e.g., Mudde and Rovira Kaltwasser Reference Mudde and Rovira Kaltwasser2012b; Plattner Reference Plattner2010; Rummens Reference Rummens, Kaltwasser, Taggart, Espejo and Ostiguy2017; Ruth-Lovell and Grahn Reference Ruth-Lovell and Grahn2023). However, it is unclear whether this is a valid concern. Therefore, this paper asks: Do challenger parties make more or fewer election promises than established parties?
While the straightforward expectation, as described above, would be that non-accountable challenger parties make more promises than established parties, this paper presents three sets of arguments for the exact opposite. First, challenger parties have never held formal power, so their pre-electoral promises are less credible to voters than those coming from parties regularly in office. Second, challenger parties have never participated in the policymaking process as governmental actors. Therefore, they have weaker ties to interest organizations and are less obligated to make promises that satisfy specific groups. Third, challenger parties have never been in government and therefore have not experienced the value of promises as a guiding tool in policymaking. For these reasons, this paper hypothesizes that challenger parties will make fewer election promises than mainstream parties. If the lack of governmental experience is the key driver behind challenger parties’ limited promise-making and not other characteristics typically associated with these parties, such as their niche focus and populist rhetoric, then this expected difference should remain consistent across issues with different levels of saliency. Furthermore, the use of promises should increase after challenger parties enter government for the first time. Finally, the paper hypothesizes that challenger and mainstream parties will not differ in other forms of political communication (e.g., references to the past or present). In other words, the electoral, corporatist, and governmental arguments outlined above should not affect challenger parties’ willingness to make other types of policy statements apart from promises.
To test these expectations, I use a novel dataset of parties’ communications, with a particular focus on their use of election promises (see also Vestergaard Reference Vestergaard2025; Vestergaard Reference Vestergaard2026a, Reference Vestergaard2026b). I developed the dataset by manually categorizing 65,630 quasi-sentences. Then, I trained a large language model on this text data to predict over one million quasi-sentences from 949 election manifestos written by 336 parties in 32 countries between 1946 and 2019. This dataset contributes to two separate but growing literatures on election promises and challenger parties and makes it possible to expand our knowledge of challenger parties’ distinctive communication styles (beyond their anti-establishment rhetoric; see Kollberg Reference Kollberg2025; Licht, Abou-Chadi, Barbera et al. Reference Licht, Abou-Chadi, Barbera and Hua2025).
Using this extensive dataset, I demonstrate that challenger parties make significantly fewer election promises than mainstream parties. On average, challenger parties make 20–27% fewer promises in their election manifestos than government parties and opposition parties with former government experience. The analysis also shows that challenger parties make fewer promises on their most salient issues than the mainstream, suggesting that the findings are not merely the result of challenger parties focusing on a few niche issues. Another test shows that the increase in promise-making occurs after entering government for the first time. Finally, the paper shows that challenger parties do not systematically differ from mainstream parties in other types of campaign statements, which highlights the uniqueness of election promises.
These results suggest that the perception of challenger parties as overpromising populists does not align with reality. In fact, these parties make fewer promises than their more established counterparts. Although the rise of challenger parties has coincided with an increase in political distrust over time, this paper does not support the idea that these parties are the main drivers of this development. While populist parties, understood as a type of challenger party, may be at odds with the principles and institutions of liberal democracy (e.g., Mudde and Rovira Kaltwasser Reference Mudde, Rovira Kaltwasser, Mudde and Rovira Kaltwasser2012a; Plattner Reference Plattner2010; Rummens Reference Rummens, Kaltwasser, Taggart, Espejo and Ostiguy2017), they do not appear to fuel distrust by filling the electoral debate with cheap talk. Instead, taken together with other findings in the literature (De Vries and Hobolt Reference De Vries and Hobolt2020; Hobolt and De Vries Reference Hobolt and De Vries2015), challenger parties introduce new ideas into political debates without making excessive promises. At first glance, this interpretation aligns with the alternative view raised in the literature on populism that these parties can be a corrective to democracy (e.g., Canovan Reference Canovan1999; Mudde and Rovira Kaltwasser Reference Mudde and Rovira Kaltwasser2012b; Rovira Kaltwasser Reference Rovira Kaltwasser2012). These parties channel neglected demands into democratic competition. However, it is important to note that from the perspective of the mandate logic and promissory representation, the lack of promises might also become problematic in the long term when challenger parties eventually enter government. Promises ensure that voters keep some control over policymaking (Mansbridge Reference Mansbridge2003; Schedler Reference Schedler1998; Thomson, Royed, Naurin et al. Reference Thomson, Royed, Naurin, Artés, Costello, Ennser-Jedenastik, Ferguson, Kostadinova, Moury, Pétry and Praprotnik2017; Vestergaard, Jensen and Bøggild Reference Vestergaard, Jensen and Bøggild2026), so when challenger parties begin to mainstream, their vague electoral programs may lead to disappointment and broken expectations among the electorate (Van Spanje Reference Van Spanje2011).
Theory
Although challenger parties are often considered similar to populist and niche parties, they actually consist of various types, including extreme and moderate; single-issue and multi-issue; new and old; small and large (De Vries and Hobolt Reference De Vries and Hobolt2020; Larsen, Nyrup and Hjorth Reference Larsen, Nyrup and Hjorth2024). The primary definitional difference between challenger and mainstream parties is that challenger parties have never had government experience (De Vries and Hobolt Reference De Vries and Hobolt2012).
Main expectation: challenger parties versus mainstream parties
The following three arguments explain why challenger parties should make fewer promises than mainstream parties: an electoral argument, a corporatist argument, and a governmental argument. These arguments are presented to develop the main hypothesis of this paper.
First, challenger parties have not had experience in government, so voters should find their promises less credible. For example, if a party says, ‘We promise to lower taxes’, this claim is less trustworthy when it comes from a party that has never had the formal power to implement its promises than when it comes from a party that is regularly in government. In other words, voters will need to believe that the party will have the opportunity to fulfill its policy proposals (Bonilla Reference Bonilla2022; Dupont, Bytzek, Steffens et al. Reference Dupont, Bytzek, Steffens and Schneider2019). Research on political parties has often noted that parties are limited in the statements they can make. These limitations focus on parties’ issue ownership (Petrocik Reference Petrocik1996; Seeberg Reference Seeberg2017), party family (Fernandez-Vazquez Reference Fernandez-Vazquez2020), leadership (Wagner and Meyer Reference Wagner and Meyer2014), and electoral success (Abou-Chadi, Green-Pedersen and Mortensen Reference Abou-Chadi, Green-Pedersen and Mortensen2020; Abou-Chadi and Stoetzer Reference Abou-Chadi and Stoetzer2020; Wagner and Meyer Reference Wagner and Meyer2014). Similarly, a party trait such as previous government experience should influence the ability of parties to credibly make future promises, as ‘governing parties […] can make stronger claims on being able to act on [their] messages’ (Stiers and Dassonneville Reference Stiers and Dassonneville2024: 1099). Rather than emphasizing their own visions, challenger parties primarily use the critique of mainstream parties as their rhetorical weapon (De Vries and Hobolt Reference De Vries and Hobolt2020: 147; Kollberg Reference Kollberg2025; Licht, Abou-Chadi, Barbera et al. Reference Licht, Abou-Chadi, Barbera and Hua2025; Nai Reference Nai2021). Just as criticizing established parties becomes less legitimate when parties themselves become mainstream, the credibility of pledges should depend on a party’s governmental experience. This is the electoral argument.
Second, challenger parties are less embedded in the corporative system because they have not had the experience of being in government. Parties without government experience have weaker ties with interest organizations (Allern, Hansen, Marshall et al. Reference Allern, Hansen, Marshall and Otjes2024). With weaker connections, parties and interest organizations are less likely to influence each other (Røed, Allern and Hansen Reference Røed, Allern and Hansen2023). Parties tightly connected to various interest organizations become responsive to their specialized interests and may make election promises to satisfy the demands of these groups and to win financial support from their organizations (Dolezal, Ennser-Jedenastik, Müller et al. Reference Dolezal, Ennser-Jedenastik, Müller and Winkler2012; Däubler Reference Däubler2012). Political parties make hundreds of election promises at each election (Thomson, Royed, Naurin et al. Reference Thomson, Royed, Naurin, Artés, Costello, Ennser-Jedenastik, Ferguson, Kostadinova, Moury, Pétry and Praprotnik2017), but only a few matter to voters (Bøggild and Jensen Reference Bøggild and Jensen2023; Vestergaard, Jensen and Bøggild Reference Vestergaard, Jensen and Bøggild2026). The rest may be made to reach specific interests rather than the broad electorate (Dobber and de Vreese Reference Dobber and de Vreese2022). Since challenger parties have never participated in governmental and ministerial processes of policy preparation and implementation, they have weaker ties with interest organizations, rely less on their resources, and may feel less obligated to make promises that are targeted at specific groups (Allern, Hansen, Marshall et al. Reference Allern, Hansen, Marshall and Otjes2024). This is the corporatist argument.
Third, since challenger parties have no experience in government, they have never tried to lead the post-electoral policymaking process and witnessed the importance of election promises in this context. Election promises – and the policy program in general – guide the government party’s policies after the election (Kavanagh Reference Kavanagh1981; Osterloh Reference Osterloh2012; Thomson, Royed, Naurin et al. Reference Thomson, Royed, Naurin, Artés, Costello, Ennser-Jedenastik, Ferguson, Kostadinova, Moury, Pétry and Praprotnik2017). The policy ideas, proposals, and promises written in election manifestos play a key role in government negotiations and subsequent coalition agreements (Dolezal, Ennser-Jedenastik, Müller et al. Reference Dolezal, Ennser-Jedenastik, Müller and Winkler2012; Eichorst Reference Eichorst2014; Klüver, Bäck and Krauss Reference Klüver, Bäck and Krauss2023). Since challenger parties lack experience in government, including forming coalitions, drafting policies, leading negotiation processes, and implementing policies, they may not prioritize election promises as much as mainstream parties do. This is the governmental argument.
Based on these different reasons, the following hypothesis is made:
H1: Challenger parties make fewer election promises than mainstream parties.
In addition to this main hypothesis, the paper also develops three additional hypotheses. The next two hypotheses focus on parties’ use of promises across issues and across different levels of governmental experience, while the final hypothesis concerns parties’ use of other types of policy statements. All three hypotheses draw, to different extents, on the arguments presented above.
Differences across issues
Although challenger parties are diverse and consist of many different types, they often act as issue entrepreneurs, focusing on a few key issues (De Vries and Hobolt Reference De Vries and Hobolt2012, Reference De Vries and Hobolt2020; Hobolt and De Vries Reference Hobolt and De Vries2015; Van Heck Reference Van Heck2018). For example, green parties primarily focus on environmental issues, while radical right parties primarily focus on immigration. If challenger parties make fewer promises, a possible reason is that these parties have one primary issue to which they are strongly committed and downplay other issues (e.g., Bergman and Flatt Reference Bergman and Flatt2020; Bischof Reference Bischof2017; Wagner Reference Wagner2012; Wagner and Meyer Reference Wagner and Meyer2017). As such, challenger parties may prioritize making promises on issues they care most about, such as immigration for nationalist parties and climate for green parties. However, if the defining feature of challenger parties is a lack of governmental experience, they should make fewer promises across different issues, including salient ones. Following the electoral argument presented above, for example, voters should find parties without power to be less trustworthy when they make explicit promises, even on highly prioritized issues (e.g., a radical right party promising to limit the number of incoming immigrants despite having no prior government experience). Following this logic, the second hypothesis then becomes:
H2: Challenger parties make fewer election promises than mainstream parties across issues with varying levels of saliency.
Governmental experience
Assuming that a lack of governmental experience causes challenger parties to commit less, then one might expect the main increase in election promises to occur after a party’s first experience in government. According to the electoral argument, parties should be able to increase the credibility of their promises when they have been in government because voters can see that the party has had the opportunity to implement policies and might have that opportunity again. Similarly, according to the corporatist argument, a party’s interactions with interest organizations in the policymaking process should increase its links to them after it has been in government once. Thus, the party may have begun relying on the resources of interest organizations (Allern, Hansen, Marshall et al. Reference Allern, Hansen, Marshall and Otjes2024), and promises targeted toward these organizations can serve to maintain these relationships. Finally, according to the governmental argument, a single term in office should make parties realize the usefulness of promises as a steering tool in coalition formation and policymaking after the election (Dolezal, Ennser-Jedenastik, Müller et al. Reference Dolezal, Ennser-Jedenastik, Müller and Winkler2012; Eichorst Reference Eichorst2014; Kavanagh Reference Kavanagh1981; Klüver, Bäck and Krauss Reference Klüver, Bäck and Krauss2023; Osterloh Reference Osterloh2012; Thomson, Royed, Naurin et al. Reference Thomson, Royed, Naurin, Artés, Costello, Ennser-Jedenastik, Ferguson, Kostadinova, Moury, Pétry and Praprotnik2017). An alternative expectation would be that the number of promises increases further with more governmental experience. However, the arguments presented here suggest that the largest increase should happen after only one term in office. The third hypothesis then becomes:
H3: Parties’ promise-making increases after one term in government, and the level remains higher regardless of how many terms parties have served.
Other types of policy statements
Rather than testing the importance of governmental experience across challenger and mainstream parties and issues using different levels of prior office holding as a measure, a fourth possibility is to test variations in other types of political statements. If election promises are special in some respects, causing challenger parties to produce fewer of them than mainstream parties, then we should not see major differences in rhetorical style across other political statements. For example, challenger parties’ lack of government experience should not lead them to talk less about the future in general (e.g., using less committing language like ‘We think there should be’, using scare campaigns like ‘The established parties will ruin the economy if they stay in power’, or trying to predict the future like ‘In ten years, we will need hundreds of nurses’) or less about the present (e.g., ‘The economy is not doing well’). Compared to promises, voters should not disregard these statements as untrustworthy to the same extent, nor should they have the same ability to guide policymaking after elections. There is also no reason to expect challenger parties to make fewer references to the past. Government parties generally write more about the past to take credit for policy achievements, but mainstream opposition parties do this to a lesser extent (Müller Reference Müller2022). As such, there is no reason why the lack of governmental experience – the defining characteristic of challenger parties – should lead to fewer statements oriented toward the future, past, or present. The same goes for statements about policies that do not have a clear temporal orientation (e.g., causal claims such as ‘A healthy economy is a prerequisite for a thriving society’). The final hypothesis is as follows:
H4: Challenger parties do not differ from mainstream parties in their references to future-, past-, or present-oriented policy statements or policy statements without any direction in time.
Method
Dependent variables
Election promises
To properly test the different hypotheses, this study required a cross-national dataset identifying election promises made by challenger and mainstream political parties. Although Thomson, Royed, Naurin et al. (Reference Thomson, Royed, Naurin, Artés, Costello, Ennser-Jedenastik, Ferguson, Kostadinova, Moury, Pétry and Praprotnik2017) collected an impressive amount of election promises from various national contexts, they excluded several countries often used in research on challenger parties (e.g., Belgium, Denmark, France, Norway, and Switzerland). Even among the included countries, the dataset does not include more recent elections. These limitations mean the dataset includes relatively few challenger parties and excludes successful ones from recent decades. Among the excluded challenger parties are important green parties (e.g., Grüne from Switzerland and the Greens from New Zealand), anti-immigration parties (e.g., Alternative für Deutschland from Germany, Front National from France, Vox from Spain, UKIP from the United Kingdom, and Dansk Folkeparti from Denmark), liberal parties (e.g., NEOS from Austria), and socialist parties (e.g., Socialistische Partij from the Netherlands and Vänsterpartiet from Sweden). Furthermore, the dataset lacks detailed information about the issues on which parties base their election promises. Therefore, it is impossible to test the second hypothesis (i.e., whether potential patterns in mainstream and challenger parties’ use of election promises are restricted to some issues).
Instead, I use a new dataset in which I collected election promises from 336 political parties from 32 democracies (including Australia, Austria, Belgium, Bulgaria, Canada, Croatia, the Czech Republic, Denmark, Estonia, Finland, France, Germany, Greece, Hungary, Iceland, Ireland, Latvia, Lithuania, Luxembourg, the Netherlands, New Zealand, Norway, Poland, Portugal, Romania, Slovakia, Slovenia, Spain, Sweden, Switzerland, the United Kingdom, and the United States). The dataset covers manifestos from 1946 to 2019. In this dataset, I identified promises from the election manifestos of political parties (collected by the Comparative Manifesto Project and split by so-called quasi-sentences; see Volkens, Burst, Kraus et al. Reference Volkens, Burst, Krause, Lehmann, Matthieß, Merz, Regel, Weßels and Zehnter2020). These political documents offer a thorough overview of the parties’ election promises and have been the primary source in other studies on this topic (Müller Reference Müller2022; Naurin, Royed and Thomson Reference Naurin, Royed and Thomson2019; Thomson, Royed, Naurin et al. Reference Thomson, Royed, Naurin, Artés, Costello, Ennser-Jedenastik, Ferguson, Kostadinova, Moury, Pétry and Praprotnik2017). Unlike party communication in traditional media and social media, election manifestos provide a more coordinated and less fragmented presentation of parties’ viewpoints and serve as authoritative party documents (Klingemann, Volkens, Bara et al. Reference Klingemann, Volkens, Bara, Budge and McDonald2006: 164). Manifestos are also available from several decades ago, so the Comparative Manifesto Project’s dataset includes a period during which many challenger parties emerged and gained electoral success. Even though this new dataset cannot disentangle the three arguments presented in the theory section, its main advantage is that it enables, for the first time, an examination of whether promise-making differs between challenger and mainstream parties.
Election promises were labeled based on two key elements of political statements. First, whether the party mentions a future policy. Second, whether the party takes high responsibility for this policy (using phrases such as ‘We will’ and ‘We promise’).Footnote 1 In that sense, political parties must explicitly mention themselves as the providers of a future policy before a statement is considered an election promise (which aligns well with how the public defines them; see Dupont, Bytzek, Steffens et al. Reference Dupont, Bytzek, Steffens and Schneider2019; Krishnarajan and Jensen Reference Krishnarajan and Jensen2021). In terms of responsibility-taking, this definition is narrower than previous measures of election pledges, which usually include statements with less committing language (e.g., ‘we support’, see Royed, Naurin and Thomson Reference Royed, Naurin, Thomson, Naurin, Royed and Thomson2019: 24). In terms of policy specificity, however, the definition used in this paper is broader than the one used in most previous studies (including Naurin, Royed and Thomson Reference Naurin, Royed and Thomson2019; Thomson, Royed, Naurin et al. Reference Thomson, Royed, Naurin, Artés, Costello, Ennser-Jedenastik, Ferguson, Kostadinova, Moury, Pétry and Praprotnik2017). Because these researchers’ definition was developed to study pledge fulfillment, promises had to be sufficiently specific to allow the researcher to evaluate their fulfillment later. Given that the purpose of this paper is not to study fulfillment but to examine parties’ strategic use of promises, it makes theoretical sense to adopt a definition that is broader on this dimension (especially since voters understand promises in a similar way). Beyond this theoretical consideration, a practical advantage is that this definition makes it easier to train a large language model to code hundreds of thousands of quasi-sentences (since coding the testability of a given promise would often require extensive human judgment, as also discussed in the appendix to Thomson, Royed, Naurin et al. Reference Thomson, Royed, Naurin, Artés, Costello, Ennser-Jedenastik, Ferguson, Kostadinova, Moury, Pétry and Praprotnik2017). Including a large corpus of text is necessary to study systematic differences in pledge-making in election manifestos across hundreds of mainstream and challenger parties (and, as noted above, previous pledge research includes only a small number of this latter type of parties). In online Appendix B, I elaborate further on the distinctions between this paper’s definition of promises and previous definitions and compare the measure in this dataset with the existing cross-national database of election promises.
Focusing on these two elements, future-reference and responsibility-taking, 65,630 so-called quasi-sentencesFootnote 2 were coded from election manifestos produced by political parties in different countries and written in different languages (these included all manifestos from the United States, the United Kingdom, and Denmark in the corpus of the Comparative Manifesto Project; see Burst, Krause, Lehmann et al. Reference Burst, Krause, Lehmann, Lewandowski, Matthieß, Merz, Regel and Zehnter2020). In total, eight coders were involved in this process. Coding was conducted in R, where each coder was shown the primary quasi-sentence that had to be coded on several dimensions (e.g., time orientation of a mentioned policy, responsibility-taking toward a policy). Additionally, each coder was shown the four preceding and four subsequent quasi-sentences to provide context for the individual quasi-sentence. Each quasi-sentence was coded by one human coder, and quasi-sentences were randomly distributed to the human coders within each manifesto to avoid any individual biases transferring to the manifesto level. Before the final human coding, coders participated in several weeks of training, including weekly meetings where any uncertainties could be resolved. Coders used a detailed coding scheme, which was clarified, revised, and polished during the training phase. The coding scheme included elaborate decision rules and illustrative examples of the different coding categories (in online Appendix C, full descriptions of each code are provided). The future-related code had two categories (either one or more future policies were present in the quasi-sentence or not). The responsibility-related code was considered by the human coder only if a future policy was present in the quasi-sentence. The human coder then had to consider if and to what extent the party took responsibility for this future policy. In total, this code had five categories: No responsibility (e.g., ‘Economic growth will increase in the coming years’), low responsibility (e.g., ‘Economic growth needs to increase in the coming years’), medium responsibility (e.g., ‘We will try to increase economic growth in the coming years’), high responsibility (e.g., ‘We will increase economic growth in the coming years’), and very high responsibility (e.g., ‘We promise to increase economic growth in the coming years’). As mentioned, a promise is defined here as a statement in which political parties explicitly mention themselves as the providers of this future policy. This means that the party needs to take high or very high responsibility for the future policy to qualify as an election promise. In the reliability and performance tests, categories are therefore grouped into two (no/low/medium responsibility-taking versus high/very high).
Intercoder reliability between the human coders was continuously tested, and when it reached sufficiently high levels, human coders began to code the full corpus of American, British, and Danish manifestos. Table 1 presents the final reliability values (Krippendorff’s alpha and Cohen’s kappa) for the two promise-related codes (future orientation and responsibility-taking). For these tests, each text unit was independently coded by two human coders, varying the specific coder pair across text units.
Agreement and reliability (Krippendorf’s α, Cohen’s κ) across promise-related codes

Table 1. Long description
A table with two rows and five columns. The columns are labeled Code, N, Agreement, Krippendorff’s alpha, and Cohen’s kappa. The first row under Code is Future policy with values 797, 0.90, 0.81, and 0.81 under the respective columns. The second row under Code is Responsibility taking for future policy (no/low/medium versus high/very high) with values 346, 0.92, 0.82, and 0.82 under the respective columns.
Next, a large language model called ELECTRA (Clark, Luong, Le et al. Reference Clark, Luong, Le and Manning2020)Footnote 3 was trained on a subset of the human coded quasi-sentences and then tested on another subset of quasi-sentences (in a random 80/20 split of the English-speaking quasi-sentences). These performance tests focused on the large language model’s ability to classify quasi-sentences in a manner similar to human coders (trained and tested on the American and British manifestos) and generally yielded high F1 scores, as shown in Tables 2 and 3.
Performance of language model on the future dimension (American/British)

Table 2. Long description
A table comparing the performance of a language model on the future dimension classification task. The table has four rows and five columns. Column headers are Future policy, Precision, Recall, F1, and Support. Row labels are No, Yes, Macro average, and Weighted average. Row 1: No, 0.89, 0.81, 0.85, 3474. Row 2: Yes, 0.89, 0.94, 0.92, 5864. Row 3: Macro average, 0.89, 0.88, 0.88, 9338. Row 4: Weighted average, 0.89, 0.89, 0.89, 9338.
Performance of language model on the responsibility dimension (American/British)

Table 3. Long description
The table presents the performance metrics of a language model on the responsibility dimension, comparing its performance on American and British manifestos. It has five rows and five columns. The columns are labeled Responsibility, Precision, Recall, F1, and Support. The rows are labeled as follows: No, low, or medium; High or very high; Macro average; Weighted average. The values in the table are: Row 1: No, low, or medium; Precision, 0.87; Recall, 0.91; F1, 0.89; Support, 3094. Row 2: High or very high; Precision, 0.88; Recall, 0.83; F1, 0.86; Support, 2543. Row 3: Macro average; Precision, 0.88; Recall, 0.87; F1, 0.87; Support, 5637. Row 4: Weighted average; Precision, 0.88; Recall, 0.87; F1, 0.88; Support, 5637.
Finally, the model predicted on the full dataset of 1,143,109 quasi-sentences from all 32 countries. Before making these predictions, manifestos written in languages other than English were first machine translated using Google Translate (which is often used in political science research; see Courtney, Breen, McMenamin et al. Reference Courtney, Breen, McMenamin and McNulty2020; De Vries, Schoonvelde, and Schumacher Reference De Vries, Schoonvelde and Schumacher2018; Müller and Proksch Reference Müller and Proksch2023). This may introduce some loss of reliability, as the large language model was trained on manifestos originally in English. To estimate the degree of this reliability loss, the model’s performance was tested on the Danish manifestos. As mentioned above, all Danish manifestos from the Comparative Manifesto Project’s corpus were human coded. This provides an ideal opportunity to estimate the degree of reliability loss, when using the large language model on manifestos written in languages other than English. Denmark also differs politically from the United States and the United Kingdom, and Danish is a much smaller language than high-resource languages such as Spanish and German (Joshi, Santy, Budhiraja et al. Reference Joshi, Santy, Budhiraja, Bali and Choudhury2020; Pauli, Barrett, Lacroix et al. Reference Pauli, Barrett, Lacroix and Hvingelby2021). If the language model performs relatively well here, it should likely do this in other languages.
I performed validation tests on both the future dimension and the responsibility dimension, comparing the machine annotations of Danish quasi-sentences (which had been machine translated into English) with the human coding of these quasi-sentences (in Danish). Regarding the future dimension, the F1 score was 0.84 (weighted average) and 0.83 (macro average), while it was 0.89 (weighted average) and 0.81 (macro average) on the responsibility dimension. These scores are at the high end (and only slightly lower than the model’s performance on English texts as shown above), suggesting that the large language model transfers well to other languages. All F1 scores are comparable to or even higher than those found in other political science studies (e.g., Licht Reference Licht2022; Licht, Abou-Chadi, Barbera Reference Licht, Abou-Chadi, Barbera and Hua2025; Lind, Heidenreich, Kralj et al. Reference Lind, Heidenreich, Kralj and Boomgaarden2021; Müller Reference Müller2022; Müller and Proksch Reference Müller and Proksch2023; Widmann and Wich Reference Widmann and Wich2022). These findings are also consistent with recent research showing that machine translation can be used reliably in quantitative analyses of multilingual political texts (Licht, Sczepanski, Laurer et al. Reference Licht, Sczepanski, Laurer and Bekmuratovna2026). In Appendix C, I present the full tables with all performance metrics from these tests.
After identifying election promises at the quasi-sentence level, the share of these statements was calculated within manifestos (Hypotheses 1 and 3) and within issues (Hypothesis 2). Since challenger parties typically write shorter documents,Footnote 4 the final measure was calculated as parties’ promise-making relative to the whole election manifesto (or relative to each issue for Hypothesis 2). On average, 15.2% of quasi-sentences in manifestos contain election promises (SD: 15.49; min: 0%; max: 87.7%).
Future, past, present, and no time orientation
In addition to identifying election promises, quasi-sentences were categorized based on other dimensions of party communication (to test Hypothesis 4). This approach was similar to the one described above, involving human coding and machine predictions. Thus, the dataset includes information on whether a party talks about a future policy that is not necessarily a promise (e.g., ‘In the future, Sweden will compete with knowledge, not low wages’), a past policy (e.g., ‘For over thirty years, the environmental party The Greens has been fighting for an environmentally friendly, socially just, and sustainable Sweden’), or a present policy (e.g., ‘Today, most special support is given in the ninth grade’), or whether a party talks about a policy without any clear temporal orientation (e.g., ‘Special investments are needed to reduce mental illness’). Again, the final measure is relative to the whole manifesto (i.e., the share of quasi-sentences belonging to a given category). The average share of quasi-sentences with future-oriented policy statements, which also include election promises, is 63.5% (SD: 14.6; min: 0%; max: 100%), while the average share of past-oriented policy statements is 7.5% (SD: 7.0; min: 0%; max: 45.5%). For the present-oriented statements and statements without any specific time orientation, the average shares are 23.7% (SD: 13.2; min: 0%; max: 67.2%) and 43.1% (SD: 15.6; min: 0.4%; max: 91.7%), respectively. Note that the sum of average shares exceeds 100% because one quasi-sentence can include more than one type of policy statement (e.g., the following example includes both a reference to the past and to the future: ‘In recent years, the government has cut funding for vocational education, but in the next electoral term, we will invest more in apprenticeships and improve the quality of teaching’.). Further details on the coding process as well as validation tests for these communication categories are provided in Appendix C.
Independent variables
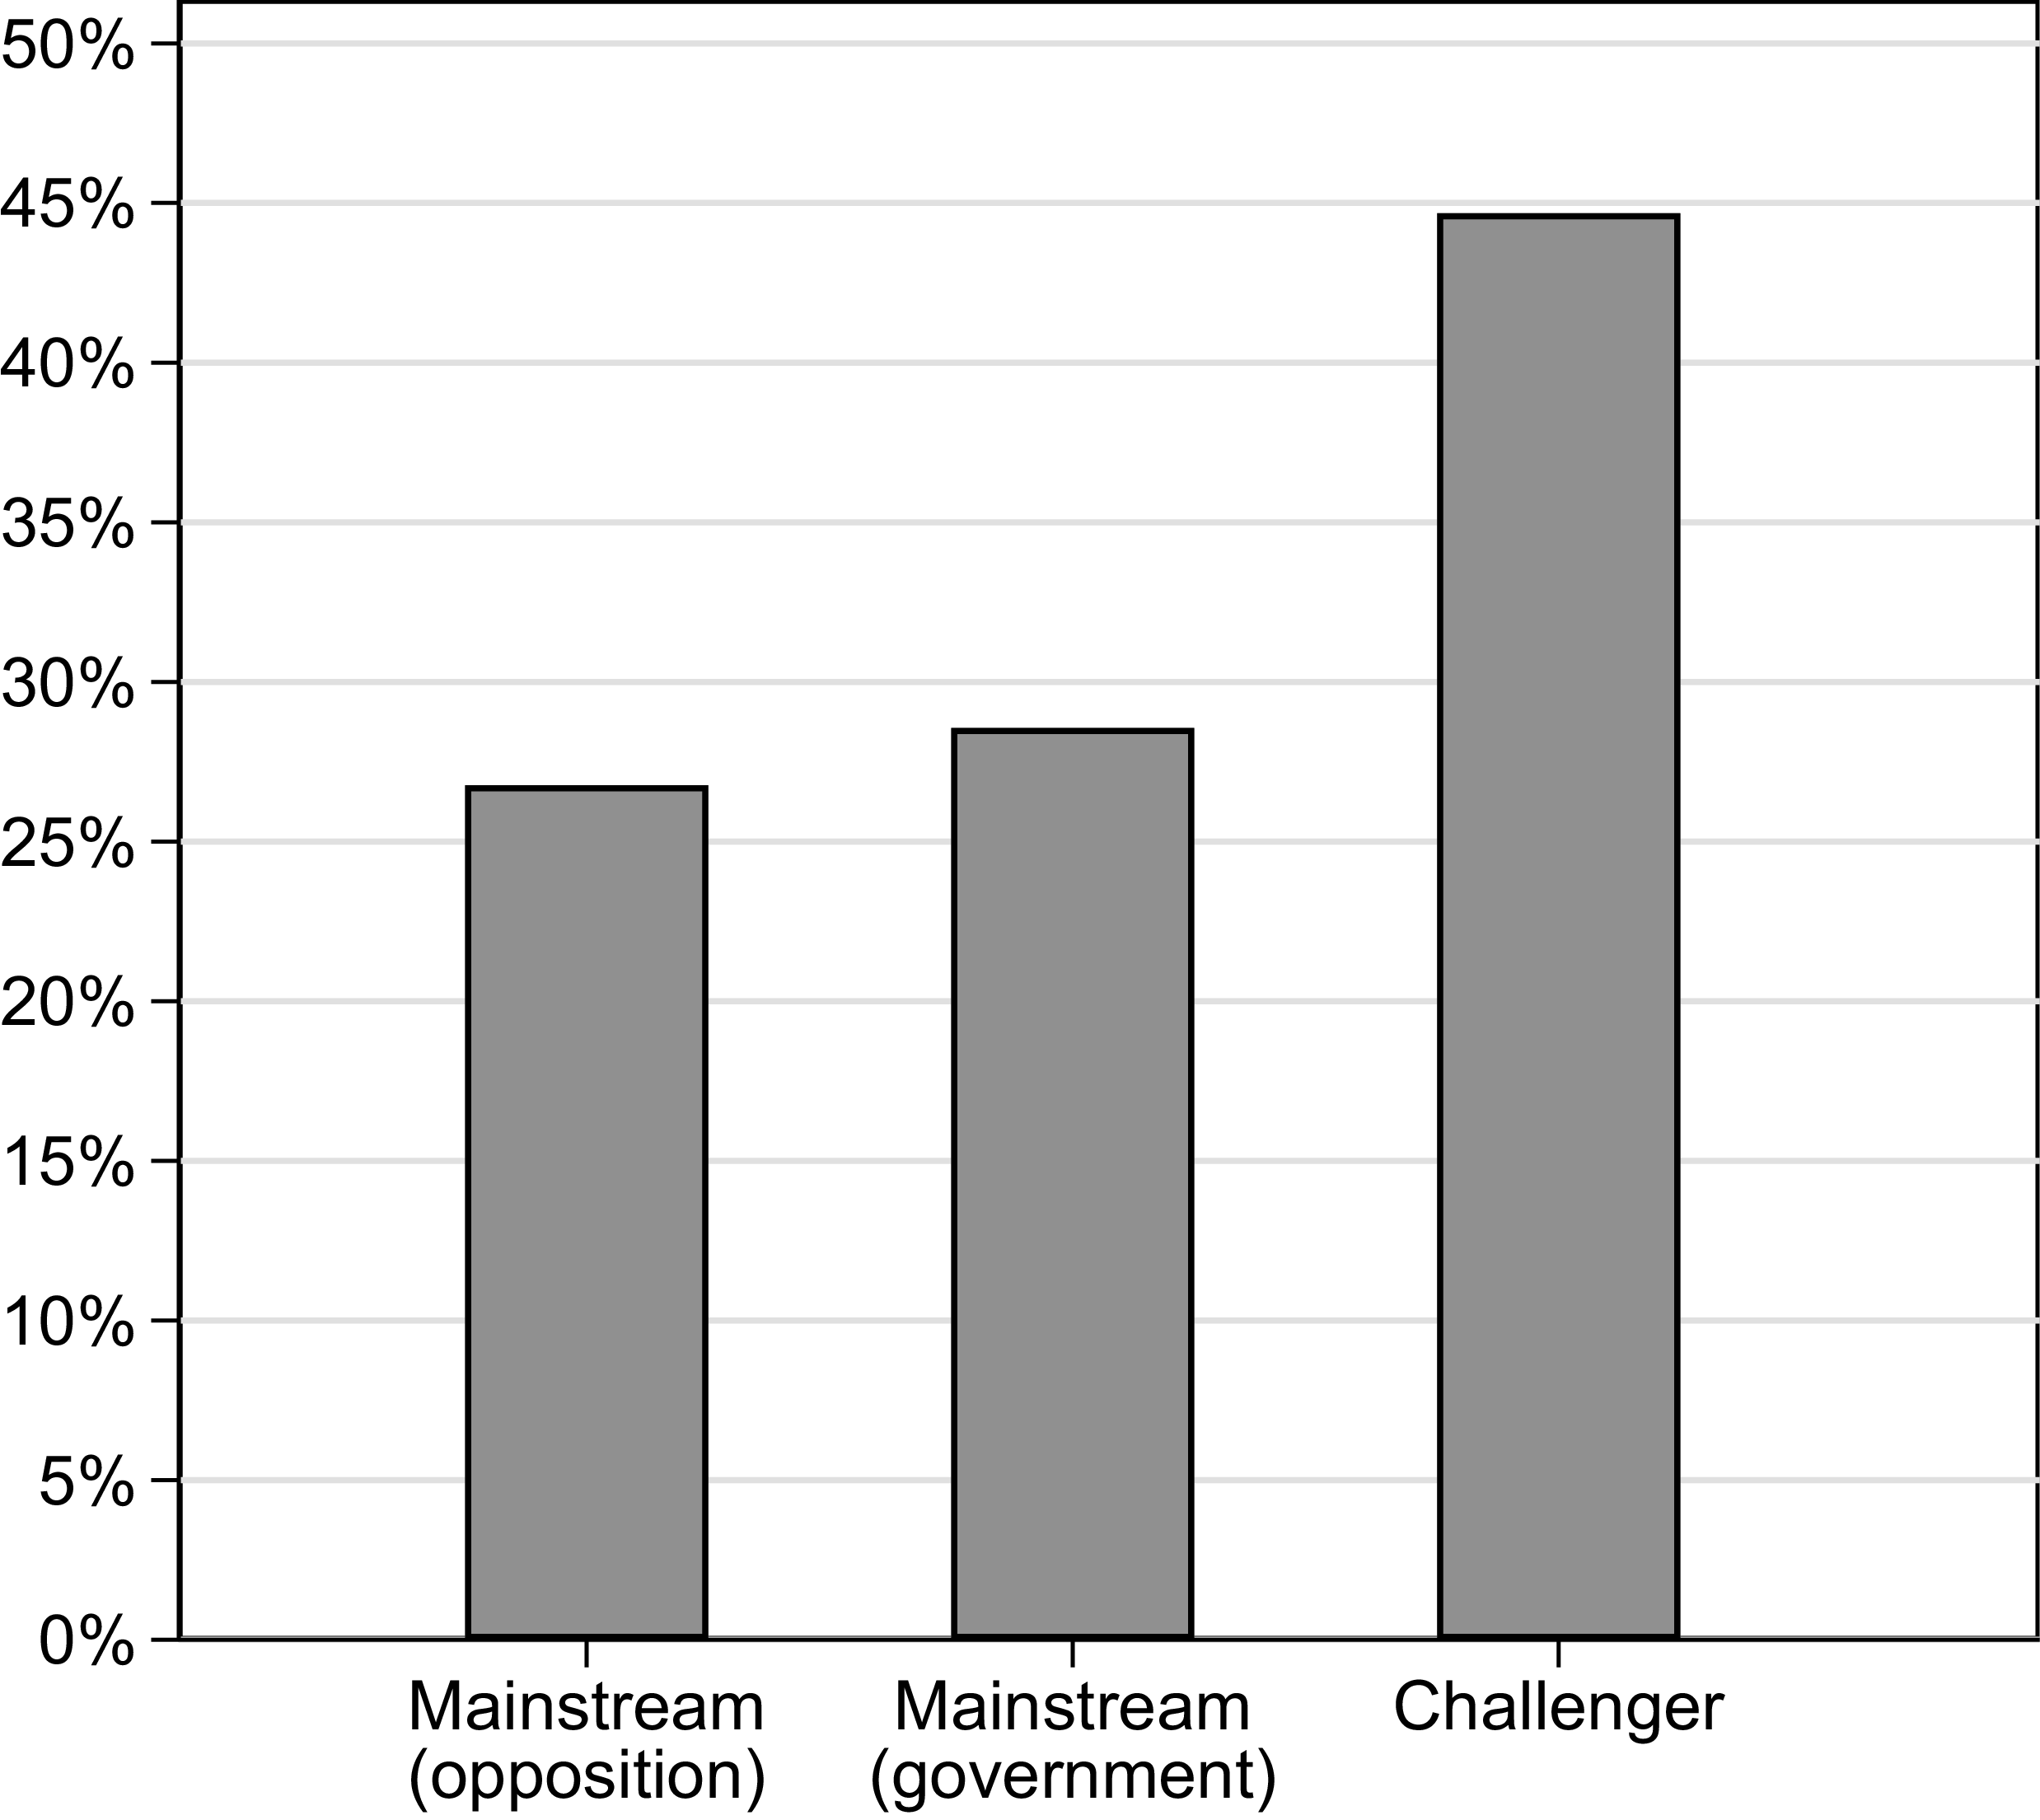
Using the dataset from ParlGov (Döring and Manow Reference Döring and Manow2024), parties were separated into mainstream and challenger categories. First, the parties were classified as either government or opposition. Since governments are sometimes formed and dissolved more than once during an electoral cycle (e.g., when a party joins or leaves a coalition government), the most recent government before the election is used. Within the opposition category, parties are classified as challengers if they have never historically been part of any government (based on the available data from the ParlGov dataset). This variable then contains three categories: mainstream government, mainstream opposition, and challenger parties. The hypotheses deal with the differences between mainstream parties and challenger parties. However, the mainstream category is split into government and opposition because these parties communicate differently (e.g., Castanho Silva, Schürmann, and Proksch Reference Castanho Silva, Schürmann and Proksch2023; Crabtree, Golder, Gschwend et al. Reference Crabtree, Golder, Gschwend and Indriđason2020; Green-Pedersen and Mortensen Reference Green-Pedersen and Mortensen2010; Müller Reference Müller2022). Appendix A provides a list of included challenger parties. Figure 1 shows the distribution of this categorical variable.
Distribution of mainstream and challenger parties.
Notes: N = 949. The figure shows the share of observations across government, mainstream opposition, and challenger parties.

Figure 1 shows that there are more observations of challenger parties than of government and mainstream opposition parties. This suggests that challenger parties are prevalent in Western democracies (see also Larsen, Nyrup and Hjorth Reference Larsen, Nyrup and Hjorth2024) and that the challenger category encompasses various types of parties, not just populist ones (which is also emphasized by De Vries and Hobolt Reference De Vries and Hobolt2020). After developing this key independent variable, I tested whether the accuracy of the language model’s annotations of election promises varied depending on whether election manifestos came from a government party, an opposition party, or a challenger party. The macro and weighted F1 scores were all high.Footnote 5
As challenger parties are internally diverse and differ from mainstream parties in many ways, additional analyses were conducted to determine whether a lack of governmental experience is the primary factor influencing these parties’ promise-making. First, the challenger parties were divided into sub-groups based on their parliamentary experience, ideological extremity, and issue diversity. In terms of parliamentary experience, challenger parties were distinguished by whether or not they had been in parliament at least once before. In terms of ideological extremity, challenger parties were divided based on their distance from the 0 value on the RILE-index (which ranges from −100 to +100; see Volkens, Burst, Kraus et al. Reference Volkens, Burst, Krause, Lehmann, Matthieß, Merz, Regel, Weßels and Zehnter2020). Challenger parties were considered ideologically center if their distance was less than 20 percentage points from the 0 value and extreme if their distance was equal to or more than 20 percentage points from the 0 value. In terms of issue diversity, challenger parties were divided based on whether their issue agenda was niche. Issue diversity was measured using the formula on the effective number of manifesto issues from Greene (Reference Greene2016),Footnote 6 and challenger parties were considered niche if they had an entropy score below the median and diverse if the score was equal to or greater than the median.
Second, to test Hypothesis 2, the variation in promise-making between mainstream and challenger parties was examined at the issue level. Then, the share of commitments was measured within issues using the same categories as described in footnote 6. Specifically, I aimed to determine whether any differences observed in the main analysis remained consistent when examining different issues depending on the parties’ priorities. Each issue was assigned a priority based on its saliency in the party’s manifesto (compared to the saliency of other issues).
Third, to test Hypothesis 3, governmental experience was measured as the number of election periods a party had previously been in government, including the current election period. Parties were divided into the following groups based on their previous government experience (no government experience, one term in office, two to three terms in office, four to five terms in office, six to seven terms in office, and eight or more terms in office).
Analytical design
A pooled OLS regression model was used to analyze differences in communication across mainstream and challenger parties. This model included country and year dummies to control for time-invariant, context-specific factors related to each country’s individual election and issue dummies in the issue-level analysis of Hypothesis 2. In Appendix E, I instead use party fixed effects, which does not alter the results substantially. Further analyses in Appendix E show that substantial results also hold when different control variables are included, such as party size, parliamentary experience, ideological position, issue diversity, the effective number of parties in parliament, the number of days since the last time in opposition, the number of days since the last election, and the presence of future, past, present, and timeless policy statements in the manifesto. In Appendix E, I also replicate all analyses in the main manuscript using the Design-based Supervised Learning framework (Egami, Hinck, Stewart et al. Reference Egami, Hinck, Stewart and Wei2026) with substantially similar results.
Analysis
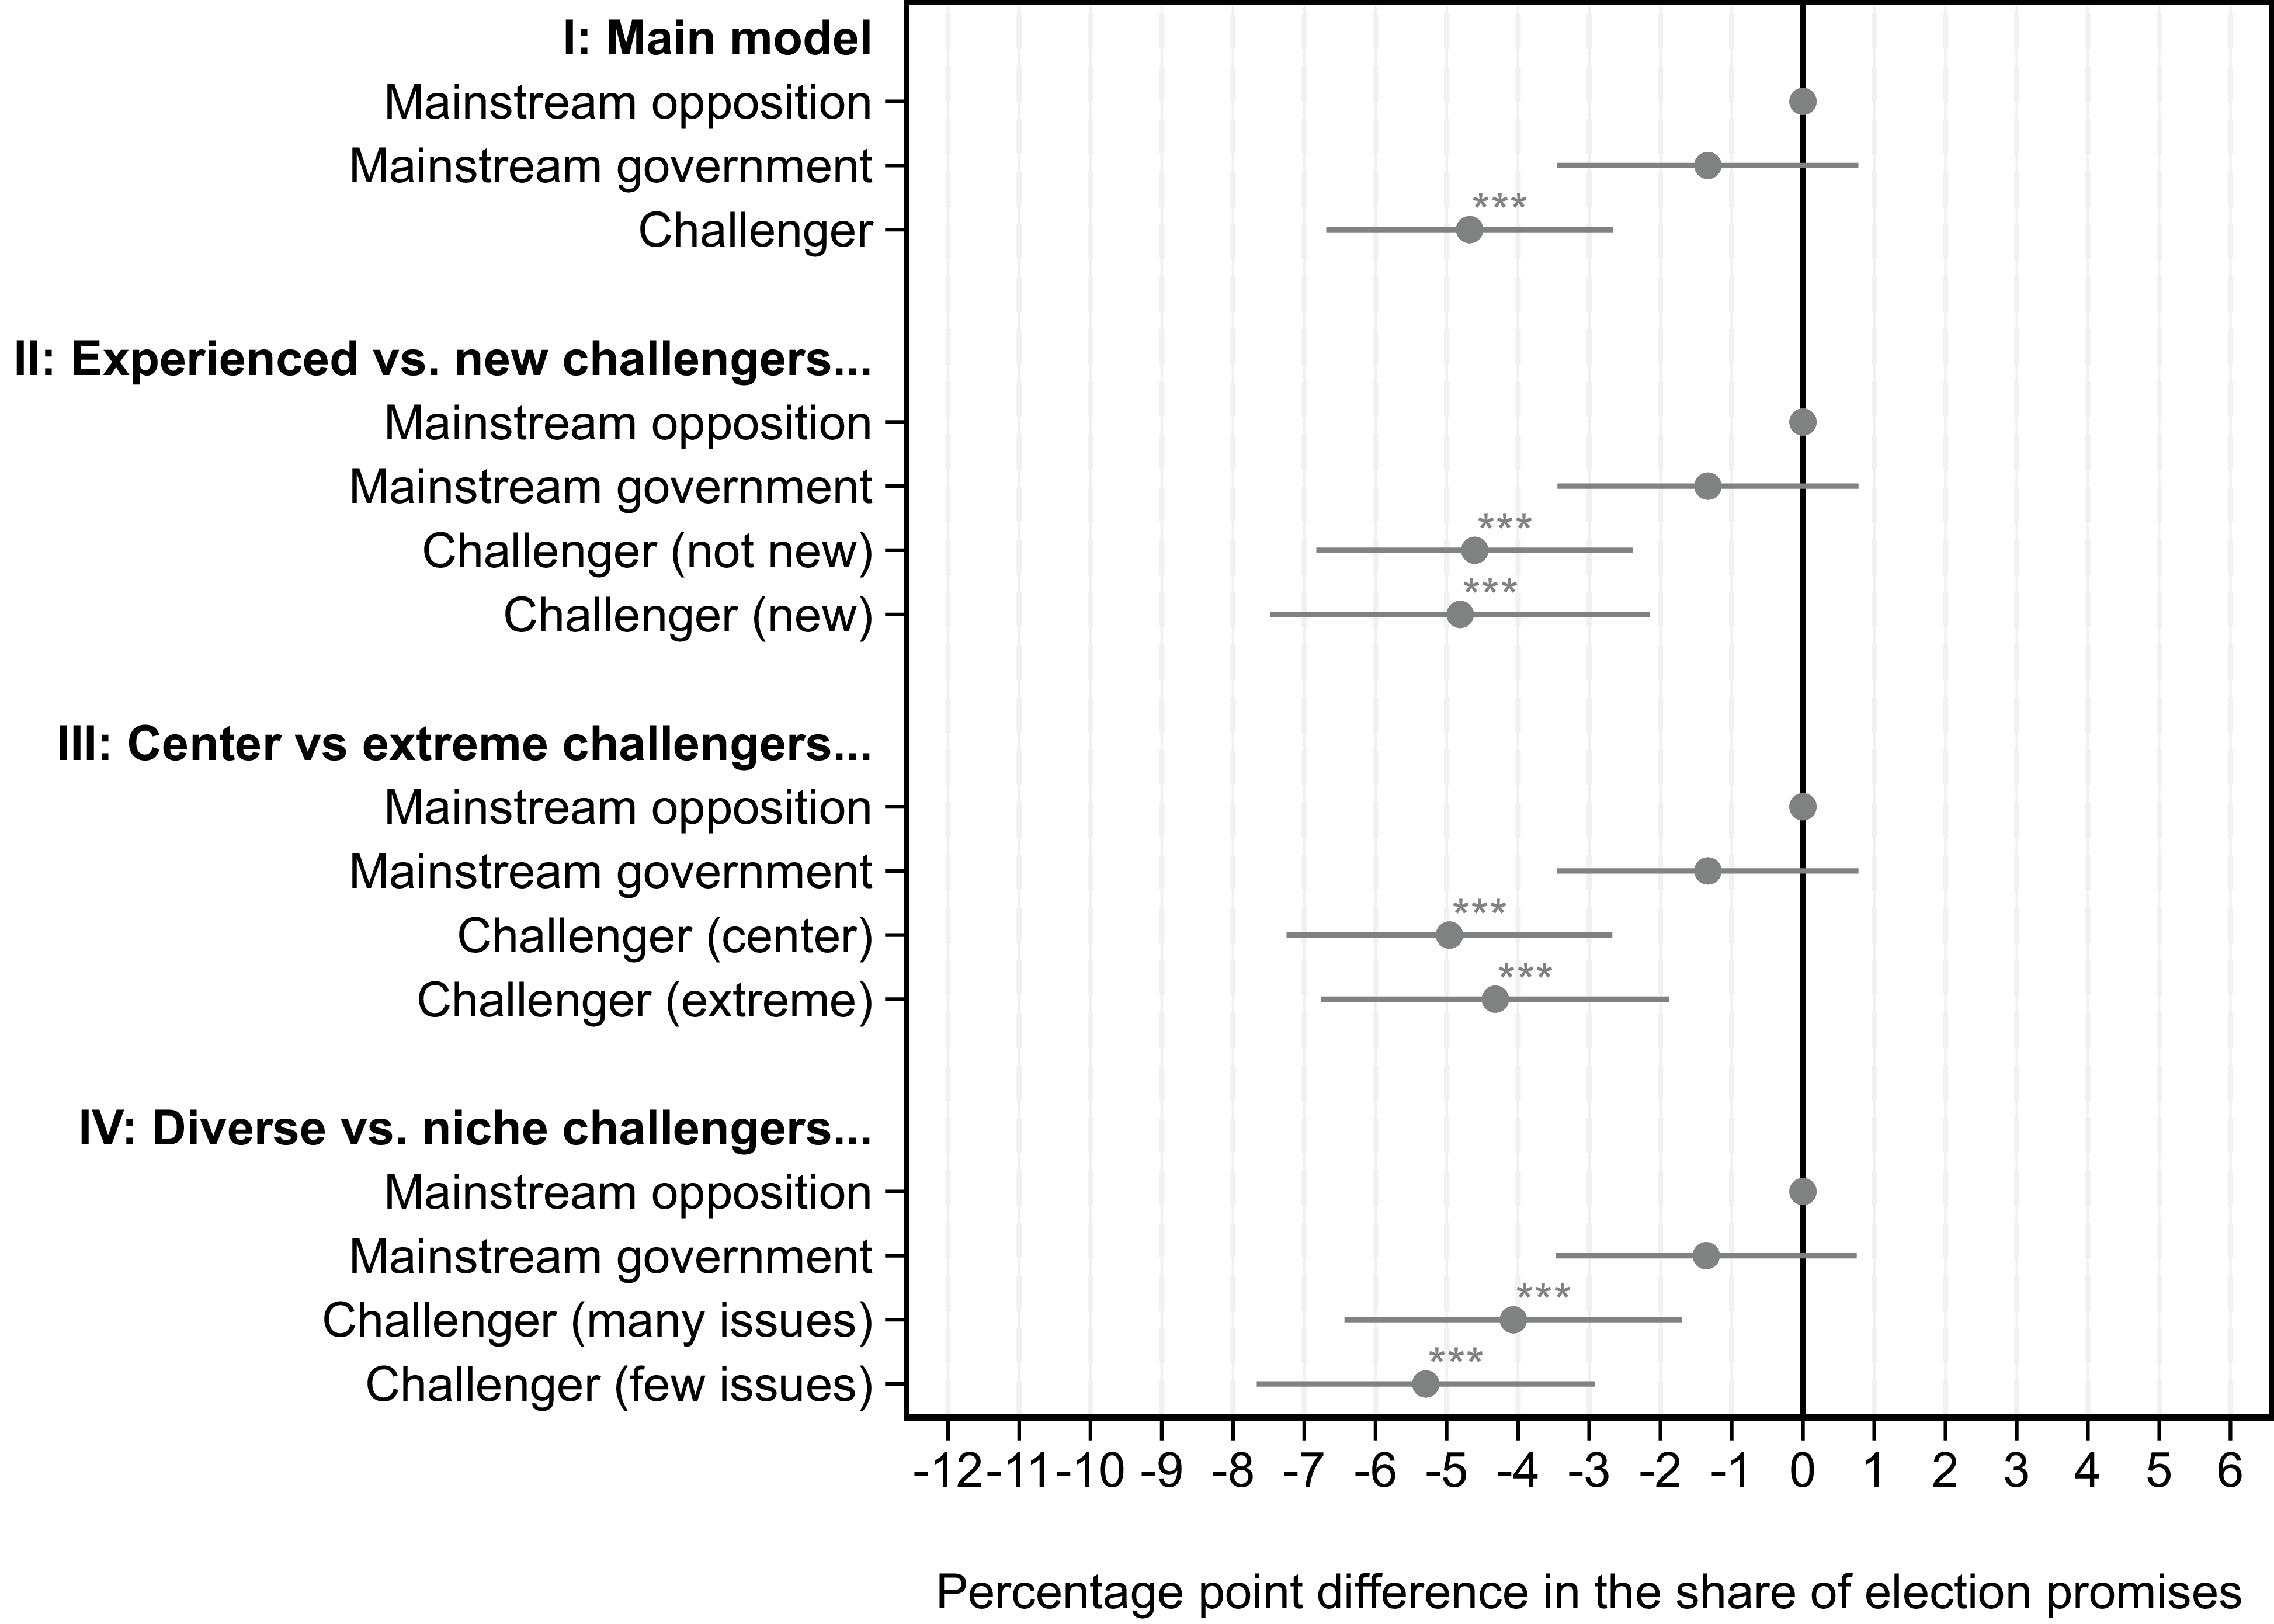
The analysis will test the four hypotheses. The test of Hypothesis 1 is shown in the upper part of Figure 2 (I: Main model). In this model, the main independent variable consists of three categories: mainstream opposition, mainstream government, and challenger party. As expected, challenger parties clearly make fewer election promises than government and mainstream opposition parties. In fact, challenger parties make 4.7 percentage points (26.5%) fewer promises than mainstream opposition parties. Similarly, the difference between challengers and government parties is 3.3 percentage points (20.5%), and while this difference is smaller, it is still substantial. Both differences are statistically significant (p < 0.001). Since the dependent variable accounts for the fact that challenger parties tend to write shorter manifestos than mainstream parties, these differences can be considered substantial and clearly support Hypothesis 1.
Election promises across mainstream parties (government and opposition) and different types of challenger parties.
Notes: N = 949. *** p < .001; Capped lines represent 95% CIs. Each of the four models uses OLS and includes country and year dummies. The x-axis shows the percentage point difference in the share of election promises (in manifestos) for a category on the main independent variable (see left side of figure) compared to the reference category. Mainstream opposition is the reference category in all models. Regression table with all models is in Appendix E.

To what extent can we observe the three arguments (electoral, governmental, and corporatist) in the data? Overall, it is difficult to systematically test the prevalence and comparative strength of each of these arguments with the aggregate measure of promise-making developed for this paper. Yet illustrative examples show how all three arguments play a role in the overall finding. The following part of the analysis focuses on the promises made by parties that make their debut in government.
In 1998, the German Greens had entered government for the first time, and the share of promises in their election manifestos almost doubled at the next election in 2002. However, the Green Party did not only intensify its promise-making but also made promises in a substantially different way. Specifically, after the Green Party’s time in office, several of its promises emphasized how they had achieved policy advances as part of the government and sought to continue this progress (e.g., ‘We will consistently continue the ecological financial reform’, ‘We will further increase the funds for education and research’.). Both statements signal to voters that its promises are credible; the party had already influenced policy as part of government and now wanted to continue this work. Furthermore, in the 2002 manifesto, the party mostly referred to itself by the pronoun ‘we’ (which could both be interpreted as ‘we, the government’ or ‘we, the party’), while they more often referred to themselves by its party name/alliance name in 1998. Generally, the Green Party was able to present its promises in a more credible way in 2002, as they had had the experience of being part of a government (and would likely enter one again, as they in fact did after the election in 2002). Thus, this example provides suggestive evidence of the electoral argument.
The second argument on the corporatist link is evident for the Czech ANO, which entered government for the first time in 2014 (after the parliamentary election in October 2013). At the next election in 2017, the party mentioned different groups as co-producers of policy in their promises (e.g., ‘In cooperation with universities and employers, we will introduce a functional system for evaluating the quality of graduates […]’, and ‘[I]n cooperation with sports associations, we will introduce a system of continuity of organized sports activities for students […]’). This shows how the party sought to signal to organized interests and other societal stakeholders that they are willing to cooperate with them in the policymaking process. It is important to note that these examples do not show to what extent the substantive content of the ANO’s promises aligns with the wishes of specific interest organizations in the Czech Republic, but they do show, in a more procedural way, ANO’s willingness to involve organized interests and other stakeholders in policymaking.
Finally, the governmental steering function of promises is evident in the Polish liberal party Civic Platform’s move from challenger party to government party after the 2007 election. At the next election in 2011, the party increased its share of promises from 11.1% to 19.6%. More importantly, the party changed the rhetorical style of its promises; from relatively vague in 2007 (e.g., ‘We will decentralize management and decision-making, simplify procedures, reduce bureaucracy’.) to much more specific promises that together formed a clear timeline (e.g., ‘In 2012, we will establish the Polish Innovation Fund for Research and Development in enterprises’., ‘By 2015, we will gradually introduce e-textbooks in schools’, ‘In 2014, we will complete work on the full computerization of health care’, ‘We will reduce the basic VAT rate to 22% in 2014 […]’). These examples illustrate how Civic Platform’s promises in 2011 had a steering function, illustrated by references to specific policy instruments and their expected implementation year.
These three examples have illustrated how the language of parties’ promises can change in ways that support the three arguments developed in the theoretical section. Yet it is important to note that this dataset cannot be used to establish which of the three arguments best explains the overall finding that was shown in the upper part of Figure 2.
Turning to the remaining results in Figure 2, Model II divides challenger parties into new and experienced ones. The results are essentially the same. Both new and experienced challenger parties make significantly fewer promises than the mainstream parties. As shown in the last two models in Figure 2 (Model III and Model IV), the results remain consistent when challenger parties are divided based on their programmatic profile (ideological extremity and issue diversity). In other words, ideologically extreme challenger parties make as many election promises as challenger parties at the center, and challenger parties that emphasize a few issues make as many promises as those with a broader issue profile.Footnote 7 All results in the analysis so far strongly support Hypothesis 1, which stated that challenger parties make significantly fewer promises than mainstream parties (and this difference remains after splitting challenger parties into different types).
To what extent is this finding driven by the fact that many challenger parties focus on a few niche issues? To test Hypothesis 2, promise-making was measured at the issue level (see footnote 6 for a list of the issues). The main independent variable, challenger status, was interacted with the priority that each party assigned to a given issue based on its saliency in the manifesto. As illustrated in Figure 3, challenger parties differ from mainstream parties (government and opposition) across issues, including those that these parties prioritize the most (i.e., that are most salient). In other words, the main differences observed in Figure 2 between different party types are not due to challenger parties making promises primarily on a few niche issues. Thus, this finding supports Hypothesis 2.
Election promises at the issue level (comparing differences across issue priorities).
Notes: N = 19,077. Capped lines represent 95% CIs. The model is based on OLS and includes country, year, and issue dummies with the interaction of party type (government, mainstream opposition, and challenger) and the priority of an issue (i.e., saliency in manifesto). The y-axis shows the predicted share of election promises within an issue (based on the regression estimates). Regression table is in Appendix E.

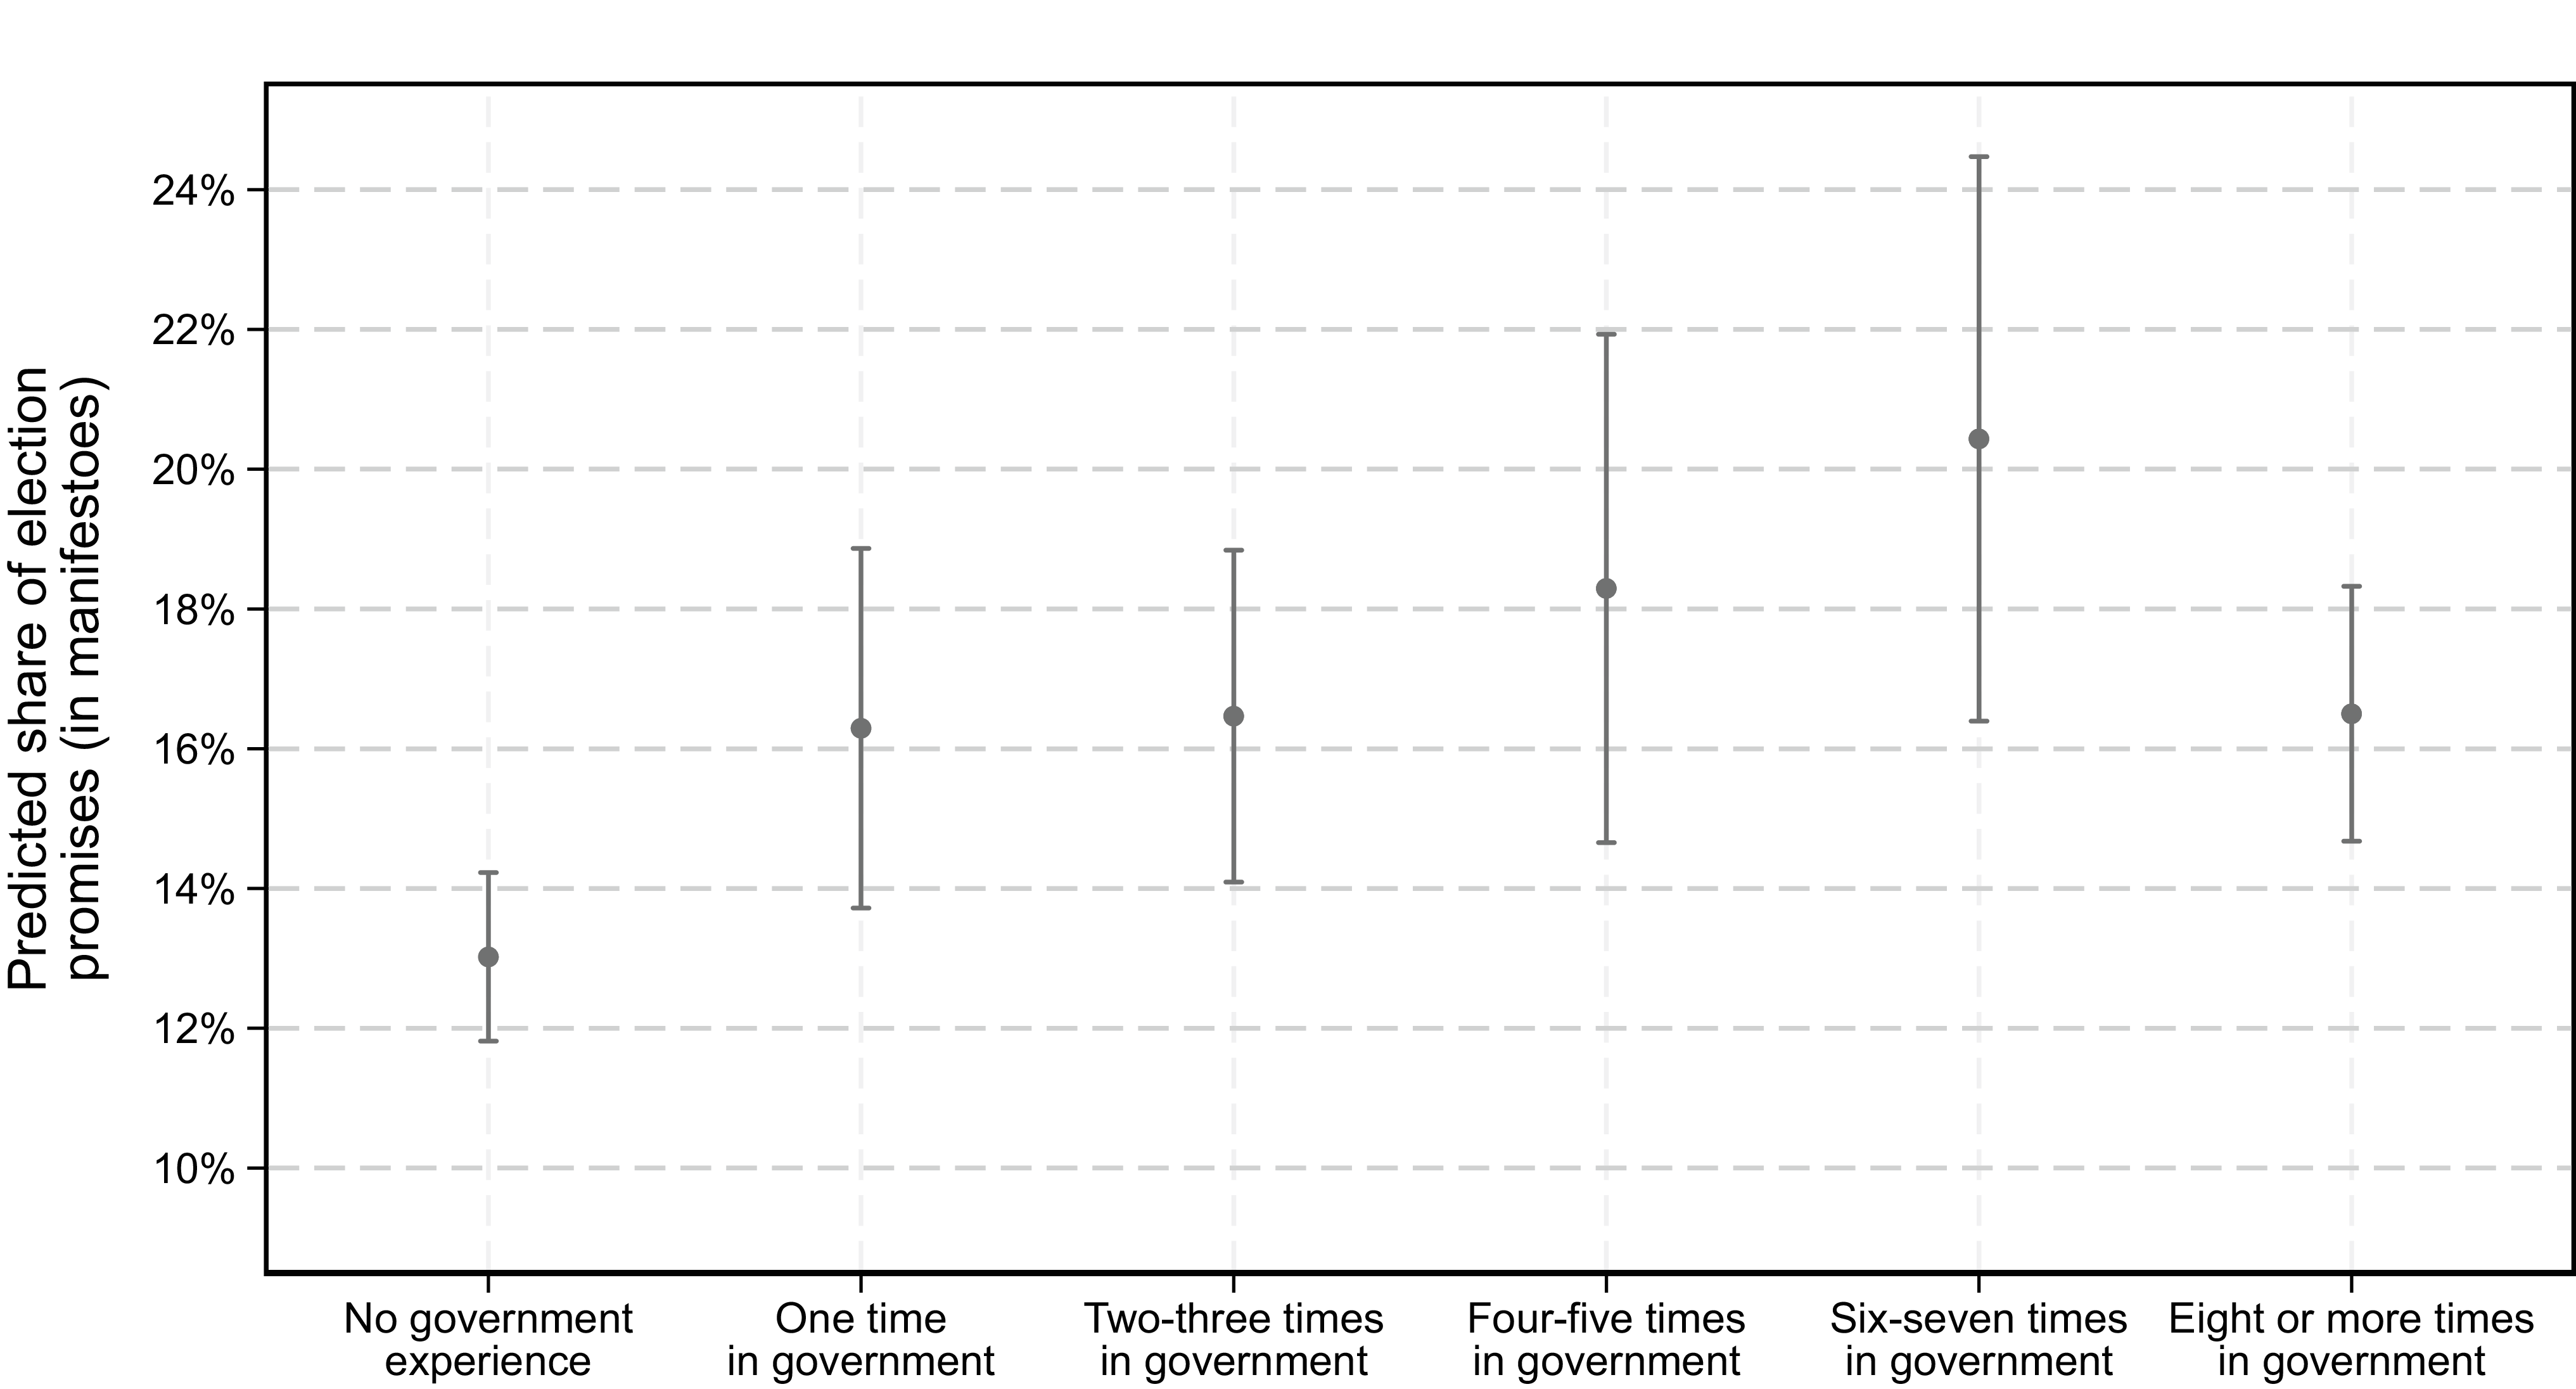
To what extent does the experience of entering government for the first time affect parties’ use of election promises? Figure 4 tests Hypothesis 3 by using the number of times a party has been in government as the main independent variable, split into different intervals. This variable is treated as categorical to detect when the number of election promises increases. As Figure 4 illustrates, a significant increase occurs between parties that have never been in government and those that have been in government for the first time. The difference between these two estimates is around three percentage points (increasing from an approximately 13% share of promises to an approximately 16% share of promises), which is statistically significant (p < 0.05). The share of election promises only increases marginally when parties have been in government two to three times (the difference is around half a percentage point, which is not statistically significant). Generally, the predicted share of promises is more similar when comparing parties with more than one period of government experience than when comparing them with parties with no experience. Thus, the largest increase in promise-making occurs between parties with no government experience and those with any government experience, whereas differences across higher levels of government experience are relatively small. This finding supports Hypothesis 3.
Election promises at different levels of governmental experience.
Notes: N = 949. Capped lines represent 95% CIs. The model is based on OLS and includes country and year dummies. The x-axis shows different categories of governmental experience. The y-axis shows the predicted share of election promises within a manifesto. The estimate of the share of election promises for parties with zero government experience is significantly different at the 0.95 level for all other categories of governmental experiences (the other estimates are not statistically significant from each other). A regression table is shown in Appendix E.

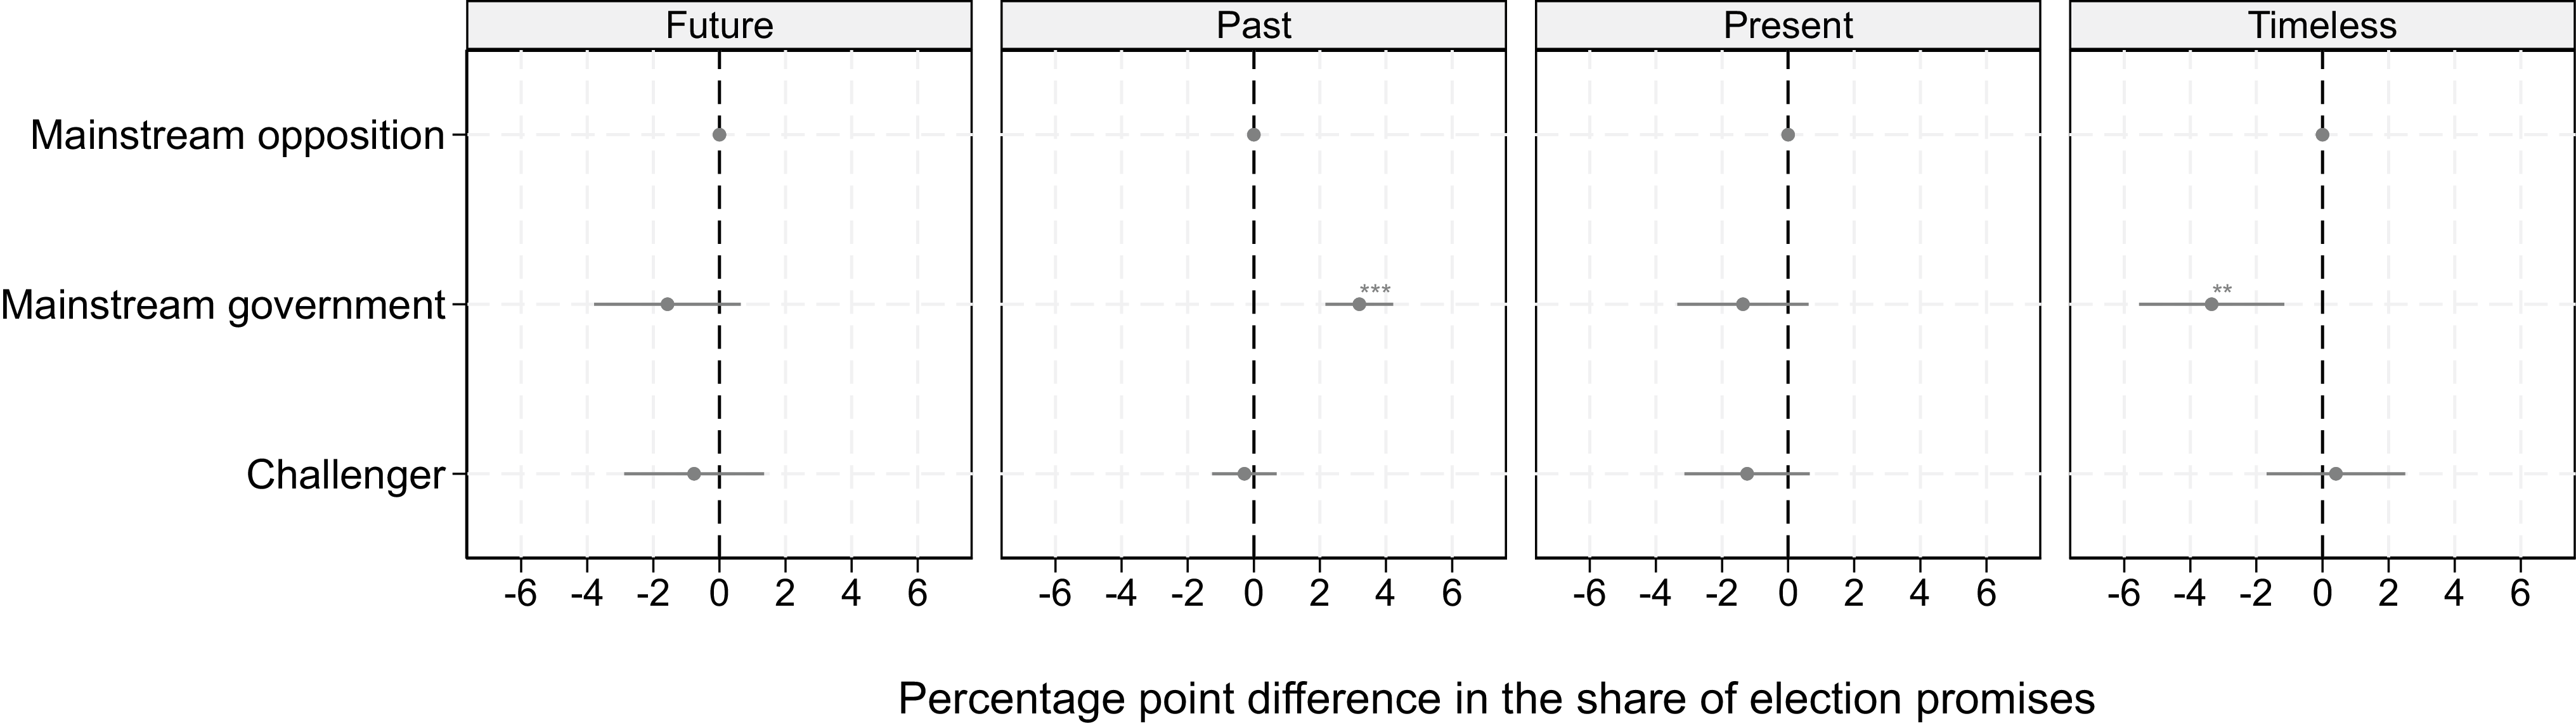
As a final step in the analysis, I tested Hypothesis 4 to determine whether the rhetorical differences between challenger parties and mainstream parties were unique to election promises or present in different types of party statements. The left plot of Figure 5 shows whether these parties differed in their degree of future orientation in their election programs. The plot shows that they did not, as challenger and mainstream parties refer to future policies to the same extent. This finding is interesting considering the main results related to promise-making. It suggests that parties are equally likely to discuss the future but that challenger parties are less willing to take responsibility for future policies than mainstream parties. This discrepancy may occur because challenger parties use less committing language when talking about future visions (e.g., ‘We think there should be’), because they make use of scare campaigns (e.g., ‘The established parties will ruin the economy if they stay in power’), or because they try to predict the future (e.g., ‘In ten years, we will need hundreds of nurses’).
The use of policy statements other than election promises.
Notes: N = 949. * p < .05, ** p < .01, *** p < .001. Capped lines represent 95% CIs. Each of the four models uses OLS and includes country and year dummies. Mainstream opposition is the reference category in all models. Future: Represents all quasi-sentences in which the party talks about a future policy. Past: Represents all quasi-sentences in which the party talks about a past policy. Present: Represents all quasi-sentences in which the party talks about a policy in the present. Timeless: Represents all quasi-sentences in which the party talks about a policy without any direction in time. Regression table with all models is in Appendix E.

Figure 5. Long description
The image contains four scatter plots arranged side by side, each representing different time frames: Future, Past, Present, and Timeless. Each plot compares the percentage point difference in the share of election promises among three political party types: Mainstream opposition, Mainstream government, and Challenger. The x-axis of each plot ranges from -6 to 6 percentage points, while the y-axis lists the three political party types. Each plot has a dashed vertical line at the 0 percentage point difference mark.
Plots two, three, and four of Figure 5 show that challenger and mainstream opposition parties communicate similarly about policies referring to the past or present or policies without any direction in time. However, mainstream government parties tend to talk significantly more about the past than opposition parties (mainstream as well as challenger opposition parties). This may be the government’s way of taking credit for its accomplishments while in office (Müller Reference Müller2022). In contrast, the government talks less about policies without direction in time than opposition parties (mainstream opposition as well as challenger parties). Overall, while challenger parties make relatively few promises compared to mainstream parties, comparable differences are not found for other types of policy statements. Hypothesis 4 is largely supported (even though mainstream governments make more references to past policies and fewer references to timeless policies compared to challenger parties). This suggests that election promises are a unique rhetorical phenomenon in the way challenger parties communicate about policies. These results are discussed more thoroughly in the concluding parts.
Discussion
Challenger parties, defined by their lack of governmental experience, make significantly fewer election promises than mainstream parties, especially the mainstream opposition. This is the paper’s key conclusion, based on three distinct theoretical arguments and broad empirical evidence. For instance, it would be a mistake to consider challenger parties as similar to the mainstream opposition even though both types of parties should provide an alternative to the current government according to voters (see Louwerse and Zorina Reference Louwerse and Zorina2026). Regardless of whether we focus on new or experienced challengers, extreme or center challengers, or issue-diverse or issue-niche challengers, these parties make significantly fewer promises than mainstream parties. The communicative differences between the mainstream opposition and challenger parties are not present in other types of policy statements, such as references to past or present policies. This highlights the uniqueness of promises as a rhetorical phenomenon.
Even among their most salient issues, challenger parties make fewer promises than mainstream parties, including both opposition and government parties. This suggests that differences in promise-making are not solely due to challenger parties’ narrow issue focus (De Vries and Hobolt Reference De Vries and Hobolt2020; Van Heck Reference Van Heck2018). The analysis also showed that most of the increase in promise-making occurs after entering government for the first time. This suggests that a lack of governmental experience is the main reason challenger parties make fewer promises.
Although the absence of previous office holding is introduced as the main explanatory factor, the theory section presented three arguments to explain why challenger parties make fewer promises than mainstream parties: electoral, corporatist, and governmental arguments. The analysis provided several examples that showed how these arguments can be observed in the way parties formulate their promises after gaining governmental experience for the first time. For instance, the electoral argument might reveal itself by the party emphasizing its own governing capacity (e.g., when the Swedish Green Party made the following promise in 2018 after its first entry into office: ‘During our time in government, we have hired more in welfare, and we will continue to do so’). The corporatist argument might appear by parties making explicit references to interest organizations in their promises (e.g., the Slovakia’s SDKU, which made the following promise in 2006 after its first term in office: ‘Therefore, in cooperation with employer organizations, we will first of all prepare and implement a system for assessing the effects on the business environment […]’) or by making promises that resemble policy proposals advanced by such organizations. The governmental argument might manifest itself by the party making promises with a specific time horizon (e.g., ‘Next year, we will reform the Climate Act’) or with a strong overlap with promises made by potential coalition partners. However, it is important to note that the three arguments might still play a role, even if they are not directly observable in the promises made by parties. All three arguments concern party motives; therefore, to better understand their presence and relative strength, future research may need to interview and follow politicians, strategists, and party leaders as they develop election promises (possibly drawing inspiration from research on parties’ manifesto development; see Dolezal, Ennser-Jedenastik, Müller et al. Reference Dolezal, Ennser-Jedenastik, Müller and Winkler2012; Däubler Reference Däubler2012). Ideally, researchers could follow a challenger party across several elections to examine how its strategic decisions in the pledge development process change as it becomes mainstream.
The findings of this paper have important implications for challenger and mainstream parties, as well as for voters in general. From the perspective of challenger parties, the results can potentially explain these parties’ limited and often delayed governmental success (Bäck, Debus and Imre Reference Bäck, Debus and Imre2024; Buelens and Hino Reference Buelens, Hino and Deschouwer2008; De Giorgi, Dias and Dolný Reference De Giorgi, Dias and Dolný2021; Dunphy and Bale Reference Dunphy and Bale2011; Grotz and Weber Reference Grotz and Weber2016; Heinze Reference Heinze2018; Larsen, Nyrup and Hjorth Reference Larsen, Nyrup and Hjorth2024; Minkenberg Reference Minkenberg2013; Van Spanje Reference Van Spanje2011, Reference Van Spanje2018). The less frequent use of election promises among challenger parties may have disadvantaged them since promises are an important tool for steering the policymaking process after elections. This creates a potential dilemma for challenger parties. On the one hand, these parties may be perceived as untrustworthy by the electorate if they make many promises, and they also risk losing voters after the election when it becomes clear that the party cannot fulfill its promises without formal power (unsurprisingly, opposition parties fulfil far fewer promises than government parties; see Thomson, Royed, Naurin et al. Reference Thomson, Royed, Naurin, Artés, Costello, Ennser-Jedenastik, Ferguson, Kostadinova, Moury, Pétry and Praprotnik2017).Footnote 8 On the other hand, making promises may be necessary for challenger parties to enter office for the first time and thereby implement their policy visions. One possible solution is for challenger parties to demonstrate strong commitment to specific issues or issue positions before the election without explicitly making promises. For instance, a party can repeatedly highlight problems on an issue, criticize the government’s policymaking on an issue, or maintain a consistent and unambiguous position over a longer period (on the difference between promise-making and unambiguous positions, see Praprotnik and Ennser-Jedenastik Reference Praprotnik and Ennser-Jedenastik2023). Immediately after the election, challenger parties might then translate this commitment into more specific policy proposals, allowing the more diffuse pre-election commitment to become a steering tool in coalition negotiations.
From the perspective of mainstream parties, and in relation to the points above, the less frequent use of election promises among challenger parties could make it easier to reach political compromises. Since challenger parties have only made limited commitments, this could provide them with more flexibility in political negotiations (Becker Reference Becker1960; Schelling Reference Schelling1960). Of course, challenger parties cannot do whatever they want, as they may have committed themselves to certain policy directions without making explicit promises. If a challenger party has consistently attacked the previous government over its lenient immigration policy, it may also be perceived as breaking its mandate after the election if it decides to support such a government without receiving any policy concessions in return (even if the party did not make any promises on this issue before the election). Regardless of how much flexibility a challenger party has after the election, mainstream parties are likely to find coalition negotiations more difficult without promises as a reference point (and if the issue is highly salient, mainstream parties may need to address it explicitly in the coalition agreement; see Eichorst Reference Eichorst2014). If a challenger party has only attacked the government without presenting any proposals itself, its policy vision may need to be clarified before meaningful negotiations can begin (preference uncertainty is a well-established cause of bargaining failures and delays in government formation; see Diermeier and Van Roozendaal Reference Diermeier and Van Roozendaal1998; Ecker and Meyer Reference Ecker and Meyer2020).
From the voters’ perspective, the lower levels of promise-making among challenger parties may have negative consequences. While it is positive that challenger parties do not fuel the electorate’s distrust by making promises they cannot easily fulfill while in the opposition, voters may find it more difficult to hold these parties accountable, especially when they enter the government for the first time (Mansbridge Reference Mansbridge2003; Matthieß Reference Matthieß2020, Reference Matthieß2022, Reference Matthieß2024; Naurin, Royed and Thomson Reference Naurin, Royed and Thomson2019; Schedler Reference Schedler1998). When challenger parties make few promises, voters can interpret what to expect in different ways. This creates bigger disappointments when these expectations are not met (Van Spanje Reference Van Spanje2011). Voters and the media cannot hold challenger parties accountable to the same extent as mainstream parties when the challenger parties have made fewer promises (Kostadinova Reference Kostadinova2019; Matthieß Reference Matthieß2020, Reference Matthieß2022; Müller Reference Müller2020; Naurin, Royed and Thomson Reference Naurin, Royed and Thomson2019). Ultimately, the lack of promise-making among challenger parties may frustrate voters who expected a change in direction from the established parties.
A final question is whether this paper’s results generalize to other parts of the world. Although the empirical analysis is based on parties from 32 Western democracies, the theoretical arguments developed in this paper are not necessarily limited to this context. The electoral, corporatist, and governmental arguments that explain why challenger parties make fewer promises should operate wherever parties compete in free and fair elections. Having a representative democracy is, of course, an important prerequisite for election promises to function properly, as the electorate must be able to select and sanction its representatives based on their promises (Mansbridge Reference Mansbridge2003; Schedler Reference Schedler1998). Furthermore, the corporatist argument is likely to be most relevant in democracies with institutionalized and effective interest organizations, yet such organizations are often less institutionalized in developing democracies (Thomas and Hrebenar Reference Thomas and Hrebenar2008). Otherwise, parties may care less about appealing to specific organizations when making promises. Finally, the governmental argument might be particularly strong where institutional settings create more complex negotiation environments. For instance, in Latin America, where multiparty presidentialism dominates (Pereira and Melo Reference Pereira and Melo2012), election promises may be particularly useful as a steering tool when the president tries to build a legislative majority (Arnold, Doyle and Wiesehomeier Reference Arnold, Doyle and Wiesehomeier2017). Future research should examine differences in promise-making between mainstream and challenger parties in other regions of the world.
Supplementary material
The supplementary material for this article can be found at https://doi.org/10.1017/S1475676526101716
Data availability statement
The dataset (polcommit_v3.0.csv) is available from Harvard Dataverse (Vestergaard Reference Vestergaard2026c). The replication do-file (Stata-version) and r-script (for the DSL-robustness tests) can be found on this Harvard Dataverse: ‘Vestergaard, M. B. (2026): Replication Data for: Vestergaard, M. B. (2026). Overpromising populists? Why challenger parties make fewer, not more, promises than established parties, https://doi.org/10.7910/DVN/QTXMQJ, Harvard Dataverse’.
Acknowledgements
The author would like to thank the editor of the European Journal of Political Research and three anonymous reviewers for their constructive and insightful comments. Special thanks are also due to Carsten Jensen for his valuable feedback throughout the writing of this manuscript. This paper further benefited from comments and suggestions received from colleagues in the Comparative Politics Section at the Department of Political Science, Aarhus University. Finally, the author is grateful to the team of human coders (Andreas, Asbjørn, Caroline, Christian, Marie, Mathilde, and Tobias) for their dedicated work.
Funding statement
ERC consolidator grant no. 817855.
Competing interests
The author declares no conflict of interest.
Use of AI
Generative AI tools were not used to generate any substantive part of this manuscript.






 Open access

