“When the battle comes in earnest … you will find an element of great weakness in our non-slaveholding population. Think you that 360,000 slaveholders, will dictate terms for 3,000,000 of non-slaveholders at the South—I fear not, I mistrust our own people more than I fear all of the efforts of the abolitionists.”
—Daniel H. Hamilton, U.S. Marshal for Charleston, SC, in private correspondence to Congressman William Porcher Miles, February 2, 1860 (Miles Letters, LC).Given the devastation that the American Civil War brought upon the South, the factors that drove most Southern states to secede despite the risks of armed conflict have long been debated. While the consensus is that secession was driven by slaveholders due to their fears over the future of slavery following Abraham Lincoln’s election,Footnote 1 there is relatively little systematic work on how this perceived threat translated into popular support for the movement. Economic historians tend to emphasize the centrality of slavery to the South’s economy, paying less attention to the potential conflict between slaveholders and non-slaveholders over secession.Footnote 2 As explained by Ransom (Reference Ransom2018, p. 374), “By itself, the accumulation of slave wealth goes a long way toward explaining why the South might be willing to take extreme measures—including secession and even war—to protect their property.”
This interpretation of Southern secession is puzzling in light of the antebellum South’s deep political and economic inequalities. Although slaveholders formed sizable minorities in a number of states, slaves were heavily concentrated in the hands of a small minority (10 percent of the adult white males (AWMs) owned nearly 90 percent of the slaves (Niemi Reference Niemi1977)). As a result, the average slaveholder in 1860 had approximately 14 times the wealth of the average non-slaveholder (Wright Reference Wright1978, p. 36).Footnote 3 In addition, large “uphill” areas with relatively few slaves were not highly integrated with the lowland plantation counties (Wright Reference Wright1978, p. 39). Given these divisions, was the threat to the property of slave owners sufficient to induce a majority among the Lower South electorate to support secession and risk a costly war?
The main evidence on the popularity of secession comes from the existing returns for the elections of delegates to different state conventions as well as a series of related referendums. In the Lower South states for which complete results exist for the election of convention delegates (Alabama (AL), Georgia (GA), and Louisiana (LA)), records show that secessionist candidates obtained narrow majorities of the total votes cast.Footnote 4 Based on these figures, some scholars have concluded that while these electorates were divided, a majority in the Lower South supported secession (e.g., Fogel Reference Fogel1994, pp. 412–13; McPherson Reference McPherson2003, p. 235).
In this paper, we reevaluate the popularity of Southern secession by examining these elections more closely. In each of the six original Confederate states, the decision to secede was made by delegates in specially convened conventions. These delegates were elected from existing state legislative districts by plurality voting, a system that is prone to reduce voter participation in lopsided races (e.g., Eggers Reference Eggers2015).Footnote 5 Given the economic geography of slavery, a large share of counties had either a high or low share of slaves in the population, and thus tended to be non-competitive with large majorities either in favor or opposed to secession. This lack of local competitiveness was associated with a low number of effective votes, a high proportion of wasted votes, as well as low turnout, particularly in high slave-share counties that overwhelmingly supported secessionist candidates.Footnote 6 As a result, the use of conventions reduced the share of the electorate whose support was necessary to achieve secession. In the Lower South states for which we have complete returns, we find that the effective number of votes from the counties electing secessionist candidates—which comprised more than 50 percent of the delegates to each convention—represented only 9 percent of the electorate of these states.
We also find support for the understudied role the conventions played in facilitating secession. Specifically, using a new dataset of representation in the conventions, which mirrored representation in the corresponding state legislature, we demonstrate that counties with more slaveholders and planters (defined as slaveholders owning 20 or more slaves) were systematically over-represented. Thus, the system of representation used favored counties in which a greater proportion of the voters were slaveholders. Under a fair representation benchmark, we also show that this bias alone was potentially decisive in the key conventions of AL and GA.Footnote 7
Historical works analyzing the role of conventions have suggested alternative mechanisms that could explain the success of the secessionists, despite significant opposition. While low slaveholder-share constituencies largely voted for candidates opposing secession, these could have changed their position once elected (see, e.g., Williams, Williams, and Carlson Reference Williams, Williams and Carlson2002). This agency problem is plausible given that voters did not possess the typical mechanism for holding representatives accountable; these were one-off elections with no reelection. We explore this possibility using a newly digitized dataset of roll-call votes in the different conventions and find that delegates largely followed the mandate given by their constituency. Specifically, most delegates elected as secessionist (cooperationist) supported (rejected) pro-secession motions, even after controlling for their personal slaveholdings. Hence, convention delegates effectively represented the economic interests of local constituencies.
Our findings complement recent work on the political determinants of Southern secession. Examining slave markets in New Orleans during the crisis, Calomiris and Pritchett (Reference Calomiris and Pritchett2016) find that the secession of the Lower South had little effect on slave prices, which they interpret as evidence that slaveholders underestimated the resolve of Lincoln to engage in a full-scale war. While problems of information asymmetries are certainly fundamental to why the sectional crisis resulted in war, we address a related but different question. Namely, we explore how the political and economic inequalities among whites influenced the success of the movement. As Calomiris and Pritchett argue, secessionists evaluated all contingencies and acted strategically under many uncertainties. We emphasize the level of opposition, mainly from low slaveholding constituencies, as an additional source of uncertainty. The decision to use conventions—and avoid statewide referendums—allowed secessionists to bypass this perceived opposition.
Last, we provide empirical support for historical studies on the representation of slave interests in the conventions (e.g., Wooster Reference Wooster1962; Johnson Reference Johnson1999) as well as works on the importance of conventions in explaining why a minority in favor of secession prevailed in the Lower South yet initially failed in the Upper South (e.g., Gary Reference Gary2004). To the best of our knowledge, no existing empirical study addresses the issue of how conventions influenced political behavior during the crisis or how they reduced the proportion of the electorate needed for secession. We are also not aware of previous studies measuring the political inequality in these conventions and analyzing its relationship with economic inequalities among whites in the seceding states.
THE SECESSION CRISIS OF 1860/61
While tensions between states over slavery had long existed, the issue was largely suppressed from the national debate during most of the Second Party System (1828–1854). This system broke down in the 1850s when disagreement over the spread of slavery led the Whig Party to split (Potter Reference Potter1976). Soon after the Whigs’ demise, the Republican Party, whose primary platform was to ban slavery in the Western territories, emerged in the non-slave states. Due to the much larger population of the Northern states, the Republican presidential nominee, Abraham Lincoln, was able to win a majority of electoral votes as a solely sectional candidate in November 1860.
Soon after Lincoln’s election, most slave states convened special sessions of their legislatures to determine their response to the new administration. By mid-December, six Lower South states separately passed legislation calling for a “convention of the people,” a special unicameral legislative body convened specifically to consider their position in the Union. In addition to specifying the apportionment of delegates to these conventions, each legislature empowered these delegations with the ability to decide any measure necessary to protect the state’s interests.Footnote 8
In the months between the passing of this legislation and the elections for delegates, two factions emerged. “Immediate secessionists” (hereafter, secessionists) advocated for their state to unilaterally secede. A separate faction, which became known as “cooperationists,” was a coalition of unionists, moderates, and pro-slavery supporters who, at a bare minimum, opposed unilateral secession.Footnote 9 Their primary platform was that Southern grievances should be addressed as a bloc, which would lower the chances of conflict and strengthen their bargaining position (Crofts Reference Crofts1989; Potter Reference Potter1976). Cooperationists also asserted that any decision by a convention would only take effect if voters ratified it via referendum (Freehling Reference Freehling2007, p. 464; Barney Reference Barney2004, p. 198).Footnote 10
Private correspondences between secessionist leaders reveal that they opposed a referendum on secession, harboring doubts about the popularity of their movement. This is candidly explained by Alfred Aldrich, member of the South Carolina (hereafter, SC) legislature in a letter to one of the state’s U.S. Senators, James H. Hammond, about the strategy secessionists should follow: “I do not want to see another attempt to vote a revolution. The thing is absurd & can’t be done … If the question must be referred back to the people … it will be an utter failure.” A month later he reiterated his concerns: “I do not believe the common people understand it, in fact, I know they will not understand it; But whoever waited for the common people when a great move was to be made?” (Hammond Papers, LC).
Alternative mechanisms, such as holding a regional convention, were also seen as harming the prospects of the movement. Anticipating that a Southern majority would probably oppose secession, William Gist, the secessionist governor of SC, wrote on the 8th of November, 1860, to Mississippi’s governor “do not ask for a Southern Council, as the Border non-acting States would out vote us & thereby defeat action. Let your State immediately assemble in Convention” (as cited in Freehling Reference Freehling2007, p. 446).
The creation of a convention and the later unilateral declaration of independence was the route followed by the first states to secede. For instance, the SC legislature voted on November 13, 1860, to hold elections for delegates on December 6 to a convention that would convene on the 17. This convention voted unanimously to secede from the Union on December 20. By the end of January 1861, five more Lower South states (Florida (FL), AL, Mississippi (MS), GA, and LA) had declared their independence following the same mechanism. These states later formed the Confederate States of America in early February 1861. Soon after, Texas (TX) approved a similar ordinance in a convention and joined the Confederacy in March 1861.Footnote 11
The path of the Upper South states to joining the Confederacy was crucially different. In particular, voters in each state were given the opportunity via referendum to either determine whether to hold a convention or subject any secession resolution to a posterior ratification. For example, in North Carolina (NC) and Tennessee (TN), voters initially rejected the holding of a convention. This electoral outcome was anticipated by a secessionist leader in NC in a letter to one of the state’s Congressmen by saying “You cannot unite the masses of any Southern state much less those of N.C. against the Union and in favor [of] slavery alone” (as cited in Crofts Reference Crofts1989, p. 132). In this case, holding such a referendum was a compromise reached when secessionists could not obtain the supermajority required by the state’s constitution to call a convention. This was seen as a defeat by those who hoped to rush the state “out of the Union without giving the people an opportunity to determine their fate” (Harris Reference Harris1988, p. 37).
In Virginia (VA), the legislature called for a convention but also held a referendum on whether a convention’s decision would require popular ratification. The inclusion of this provision caused a “heated debate” in the legislature (Wooster Reference Wooster1962, p. 141). Voters later approved the proposed posterior ratification by a wide margin. Although Missouri remained in the Union, the process was similar. According to Wooster (Reference Wooster1962, p. 225), “as originally proposed, the convention bill would have provided for a convention with unlimited power, but (anti-secessionists) … were able to secure adoption of an amendment providing that any action changing the relationship of Missouri to the Union would not be valid until approved by the state’s voters.”
The federal government did not recognize the states’ rights to secede and refused to surrender any federal property in the seceded states. Conflict began on 12 April 1861, with the firing on Fort Sumter in Charleston (SC) and Lincoln’s subsequent call on 15 April for troops to suppress the movement. This altered significantly the costs and benefits of secession since avoiding war was no longer a possibility. Thus, in these states, the choice of whether to secede or not after 15 April 1861 was more about which side of the war voters and representatives preferred their state to fight for.Footnote 12 In the weeks following, four Upper South states (Arkansas (AR), NC, TN, and VA) also seceded, primarily using the same mechanisms.Footnote 13
CONVENTIONS AND POPULAR SUPPORT
We begin by using the election results for convention delegates to investigate how the system of representation influenced the participation of voters during the crisis. In the Lower South states for which there are complete and quantifiable records, secessionist candidates received approximately 50 percent of the popular vote in GA (Johnson Reference Johnson1972), 52 percent in LA (Dew Reference Dew1970), and 56 percent in AL (Denman Reference Denman1933).Footnote 14 These narrow majorities have led some scholars to conclude that there was majority support in the Lower South for secession (e.g., Fogel Reference Fogel1994; McPherson Reference McPherson2003).
In this section, we show that these vote aggregates are not an accurate measure of popular support, as the electoral system negatively influenced the participation of voters and candidates. Using the 1860 presidential elections as a baseline, we first illustrate the massive decline in turnout in the election of secession delegates. We then characterize this decline by the level of electoral competitiveness. Specifically, voters residing in counties expected to be uncompetitive, such as those in high slave-share counties voting in favor of secession, had a lower incentive to turn out compared to a referendum in which all votes are counted equally toward an aggregate state tally. In addition, opposing candidates were less likely to enter races in counties in which there was little chance of winning. In sum, the electoral system used to select delegates had a large impact on turnout, particularly in the high slave-share counties won mostly by secessionists.Footnote 15
Turnout
In light of the stakes being decided in the secession conventions, historians have noted that turnout in the elections for delegates was surprisingly low, particularly in the Lower South (e.g., Johnson Reference Johnson1999; Barney Reference Barney2004; Freehling Reference Freehling2007). We quantify this decline by taking the 1860 presidential election turnout as a benchmark, which provides a lower bound for the number of eligible voters in each county. This election occurred less than two months prior to all the elections for delegates and provides a plausible counterfactual for the potential participation under a statewide referendum.Footnote 16
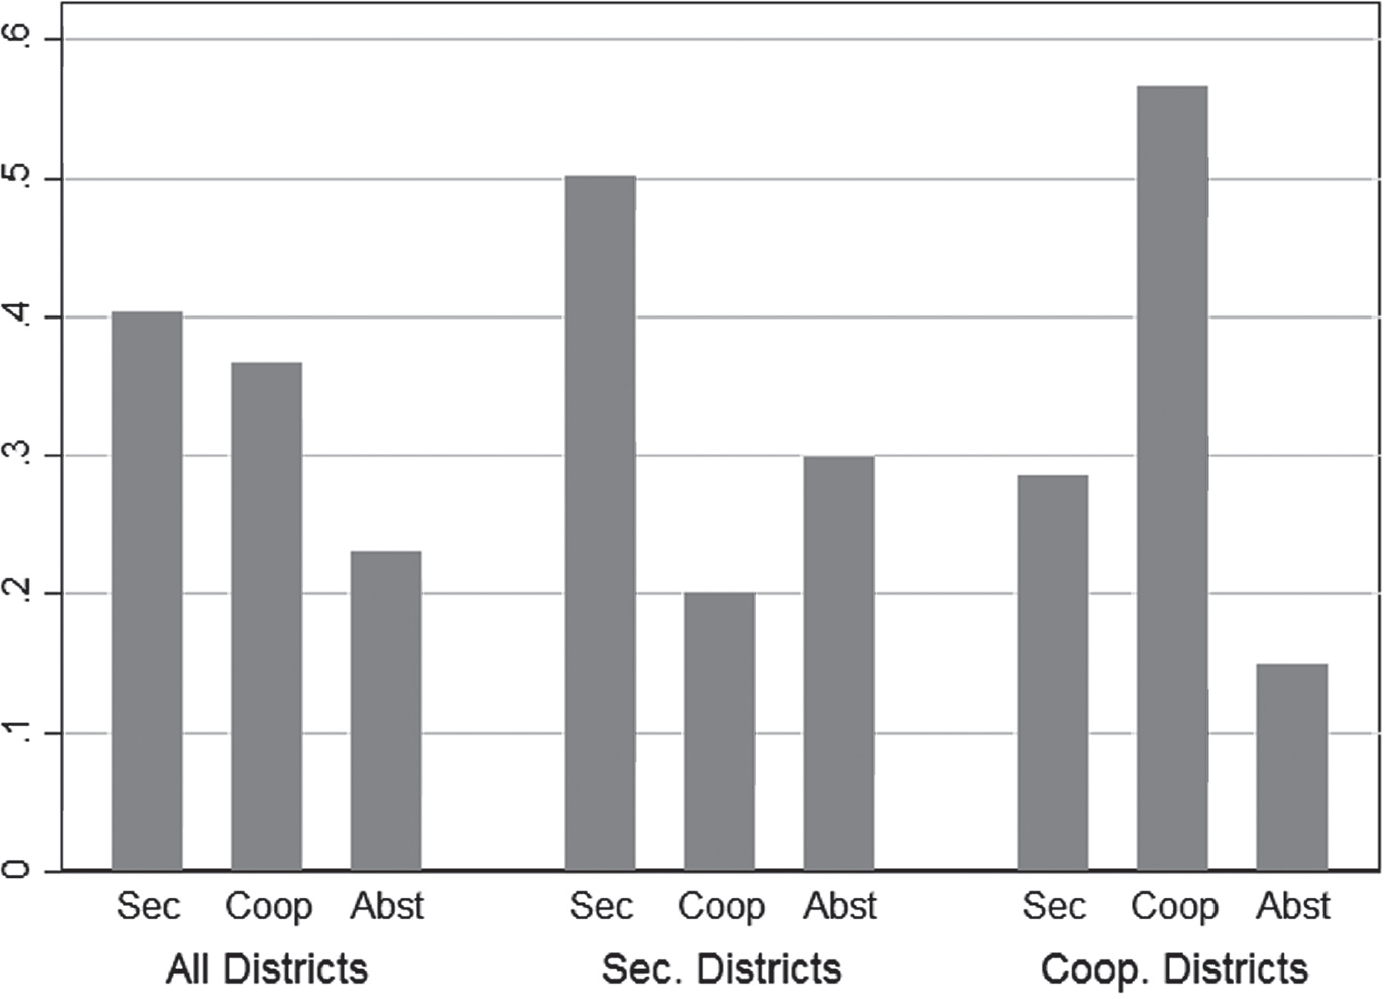
Figure 1 shows the mean county-level support for secessionist (“Sec”) and cooperationist (“Coop”) candidates, respectively, as a share of 1860 presidential turnout. The third bar in each panel shows our measure of abstention (“Abst”), defined as the shortfall between the total number of votes cast for delegates and the total number of votes for president (as a share of the latter). Observations are weighted by the total number of presidential votes to account for the size of county electorates.Footnote 17 In our Online Appendix, we present these figures separately by state.
PARTICIPATION AND COMPETITIVENESS: ELECTION OF CONVENTION DELEGATES

As shown, secessionist candidates obtained, on average, only 40 percent of the votes cast in the preceding presidential election. Moreover, on average, there is an abstention of 23 percent in the election of delegates compared to the turnout observed in this presidential election. Figure 1 also shows these results when disaggregated by counties won by secessionist and cooperationist candidates, respectively. In the secessionist counties (middle panel), which combined elected slightly more than half of the delegates, there is an approximately 30-percentage-point difference in the number of votes cast between the 1860 presidential and respective convention election. This is approximately twice the average abstention observed in the counties won by cooperationists (right panel), which together elected 46 percent of the delegates.Footnote 18
As a consequence of this steep decline in participation, particularly in counties won by secessionists, the majorities in these conventions were elected with only 27 percent of the votes cast in the preceding presidential election.Footnote 19
An additional factor associated with the low turnout in the elections of delegates is the high number of districts with candidates running unopposed. This potentially had a negative impact on participation as the strategic choice by candidates of whether or not to run should affect the number of votes cast, as the opposition voters have no candidates to vote for. In total, 12 percent of the districts of these three conventions were uncontested. Of these, nearly three-fourths were won by secessionists. In the key states of AL and GA, candidates for either side ran unopposed in more than 13 percent of the districts. The share of uncontested races was more than twice as high for districts won by secessionist candidates (16 percent were uncontested) as for those districts won by cooperationists (6 percent).
Local Competitiveness
While many causes have been offered for the decline in turnout, such as poor weather (Johnson Reference Johnson1999), voter intimidation (Barney Reference Barney2004, pp. 212–19; McCurry Reference McCurry2010, pp. 49–54; Williams Reference Williams2008), resignation that secession was inevitable (Barney Reference Barney2004; Sinha Reference Sinha2003), and collective action problems inherent to the heterogeneous cooperationist coalition (Freehling Reference Freehling2007; Johnson Reference Johnson1999, p. 24), none has been able to account for the observed variation in participation across counties. While approximately 10 percent of counties experienced a decline in turnout of more than 50 percent, around 10 percent also witnessed an increase in turnout.
The electoral incentives at the local level partially explain this variation in participation. As is well known, the use of plurality voting to select representatives out of geographic districts is associated with low turnout (Jackman Reference Jackman1987), particularly in non-competitive districts (e.g., Eggers Reference Eggers2015).Footnote 20 This effect is relevant to the participation in the election of delegates given the high spatial concentration of slaves, especially in AL and GA. Namely, in districts having a high share of slaves, the likelihood of electing a secessionist candidate was high. Similarly, the likelihood of electing a cooperationist representative was high in the lower slave-share districts. This implies that many of these local races were unlikely to be competitive. The electoral returns bear this out. The average margin of victory was 44 percent, and in only 14 percent of counties was the election decided by 10 percentage points or less.Footnote 21 As a result, the total number of effective votes (i.e., only those votes needed to win the election) across districts electing secessionist candidates was equivalent to only 11 percent of the turnout in the 1860 presidential election. To put this in perspective, the number of effective votes in districts won by secessionists (27,081) was less than half of the number of slaveholders living in those districts (58,058).
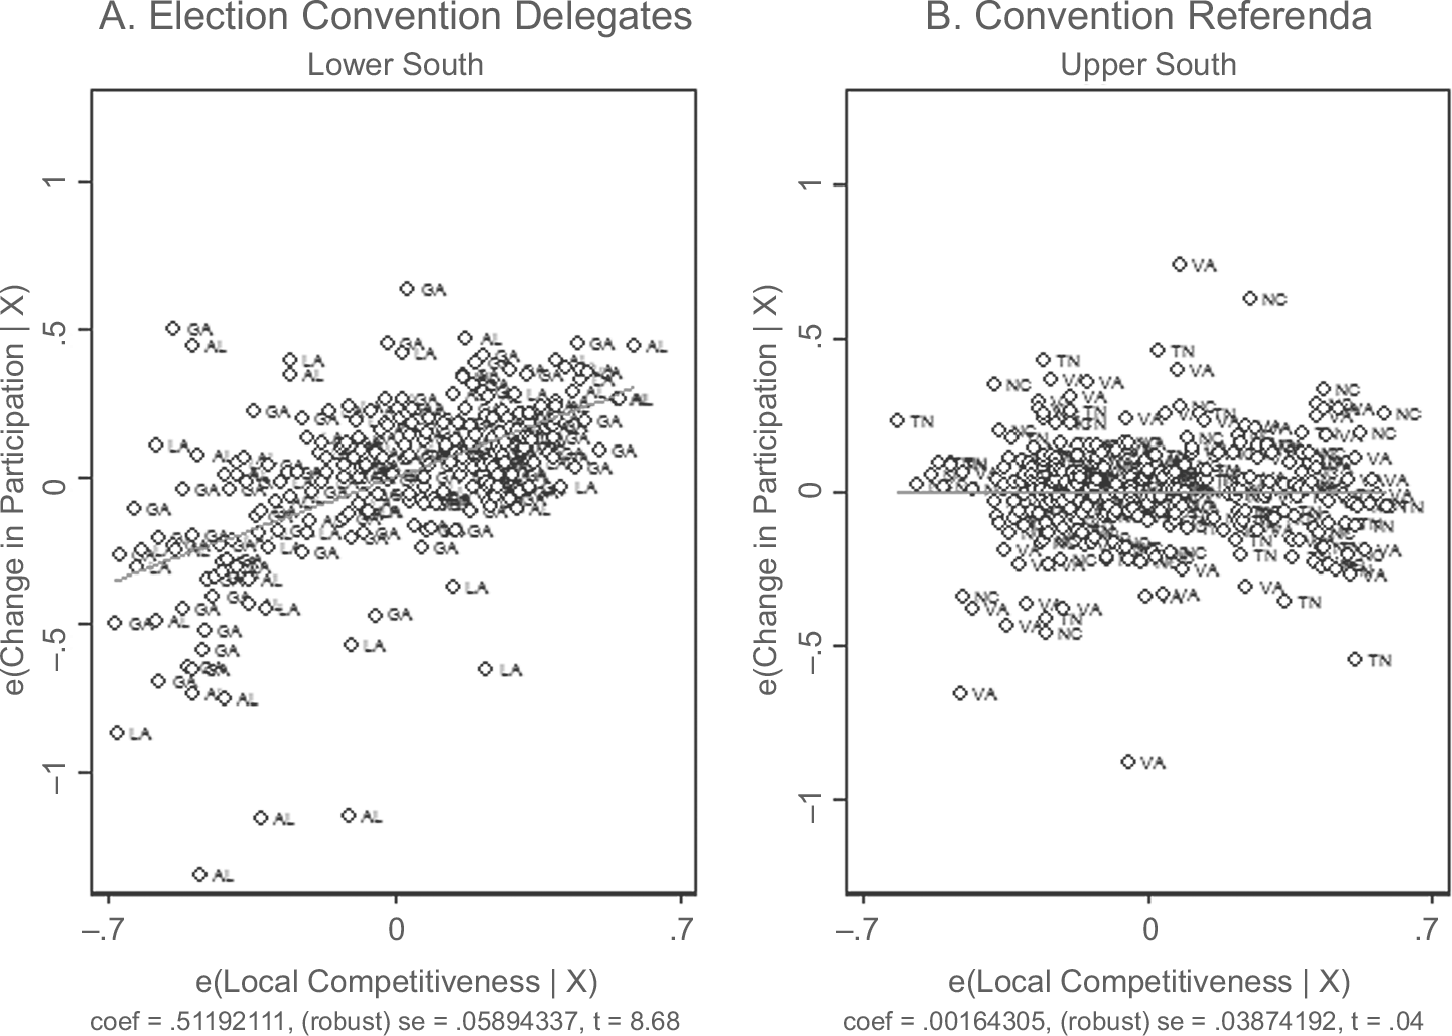
In Figure 2, we provide systematic evidence of the positive association between local competitiveness and turnout in these elections. Again, we use turnout in the 1860 presidential election as a benchmark. The left panel presents a partial regression plot with the residual values of the percentage change in participation on the y-axis against the residuals of a measure of district competitiveness on the x-axis.Footnote 22 The effect of several factors is partialed out. First, due to the salience of slavery to secession, we control for the share of the district’s population who were slaves. Second and similarly, we include total district population, as the likelihood of any voter being pivotal is decreasing in district size. Last, to control for unobserved state-level factors, we include state fixed effects.Footnote 23
CHANGE IN PARTICIPATION AND LOCAL ELECTORAL COMPETITIVENESS

As shown in Panel A, there is a positive and highly significant correlation between district competitiveness and the change in turnout between these elections. The slope coefficient of 0.51 (S.E. = 0.06) implies that a one-standard-deviation increase in the competitiveness of a district is associated with an increase in participation of approximately 16 percentage points. Compared to the mean decline in turnout in these states (28 percent), the magnitude of this increase is substantial.Footnote 24
Further evidence that the electoral system used to select delegates conditioned voter behavior during the crisis comes from the Upper South states, which held state referendums on questions pertaining to secession. In NC, for instance, where voters decided not to hold a secession convention, turnout declined, on average, 5 percent compared to the 1860 presidential election. In a similar referendum in TN, turnout declined, on average, 12 percent.Footnote 25 Overall, the average decline in turnout in the referendums for which data are available (NC, TN, and VA) was below 10 percent. More importantly, since every vote in a referendum adds to the aggregate state tally, there should not be an association between local competitiveness and turnout. This is precisely what we find in Panel B of Figure 2. As can be seen, the relationship between the closeness of the district-level result and the change in turnout after controls are taken into account is not statistically different from zero.
In our Online Appendix, we explore the robustness of these conditional correlations. For example, we expand the set of controls and account for additional factors such as the pre-crisis level of electoral competitiveness proxied by the number of parties in the 1860 presidential election and the incidence of slaveholders in the district (see Online Appendix Figure 2). We also show that these results are not driven by any outliers; in fact, once we exclude outliers, the slopes are more precisely estimated (Online Appendix Figure 3).
CONVENTION REPRESENTATION AND SLAVEHOLDERS INCIDENCE

Did Abstainers Oppose Secession?
Our evidence suggests that if the Lower South states would have allowed referendums—either asking whether a convention should be held or to ratify a convention’s choice—overall turnout would have increased and perhaps even a majority would have voted against secession. This counterfactual is consistent with a historical literature downplaying the popularity of the movement and arguing that only a minority in each state supported it (e.g., Escott Reference Escott1978; Freehling Reference Freehling2007; Potter Reference Potter1942).Footnote 26
Historical accounts provide suggestive evidence that abstainers in the high slave-share counties opposed secession (McCrary, Miller, and Baum Reference McCrary, Miller and Baum1978) and did not vote because of intimidation by secessionists (e.g., Barney Reference Barney2004; Sinha Reference Sinha2003; Williams Reference Williams2008).Footnote 27 For instance, a cooperationist in MS said, “I knew many who were in favor of the Union, who were intimidated by threats, and by the odium attending it, from voting at all” (as cited in Barney Reference Barney2004, p. 269). Similarly, a cooperationist in TX wrote that secession was achieved by the coercion of a “ferocious minority … I only dared protest as strongly and I thought prudent … accordingly I did not vote” (as cited in Freehling Reference Freehling2007, p. 459). Hence, some historians have claimed that the elected pro-secession majorities in the Lower South states reflected substantial voter fraud and intimidation (e.g., McCurry Reference McCurry2010; Merritt Reference Merritt2017).
The argument that abstention was systematically influenced by coercion fits broadly with the more conventional view that the slaveholding elite used “the traditional powers of their planter oligarchy” to overcome the will of the majority during the crisis (Donnelly Reference Donnelly1965, p. 81).Footnote 28 While these tactics may have helped slaveholders to obtain pluralities in the high slave-share districts, it would have been much more costly, if not impossible, to employ broadly in the lower slave-share districts.Footnote 29 Moreover, since secessionists only needed to win pluralities in districts comprising a majority of delegates, the geographic scale of where they may have needed to employ these tactics was significantly reduced. That is, the conventions localized political competition and significantly lowered the share of voters needed in order to obtain a majority of delegates.
THE POLITICAL ADVANTAGE OF SLAVE OWNERS
While it is clear that the conventions influenced political behavior, we now explore how the conventions independently facilitated secession. We investigate how the system of representation used in the Lower South conventions favored higher slaveholding constituencies. Namely, the apportionment of delegates, which was based on the apportionment of state legislatures, systematically over-represented counties with a high concentration of slaveholders. In addition, despite being a majority, non-slaveholders tended to be concentrated in counties electing a minority of delegates. This system, which allowed a minority of voters to elect a majority of delegates, was employed in each Lower South state. Further, the use of conventions allowed secessionists to avoid statewide referendums, which voters used to reject pro-secession proposals in the Upper South. These overlooked factors help explain the disproportionate influence of slaveholders during the crisis.
Political Inequality in the Conventions
An important source of distortion in the representation of slave interests originated in the apportionment rules of the conventions. We demonstrate this using a measure based on the number of delegates per district. This information was coded from the individual pieces of legislation passed in late 1860 and early 1861 stipulating how each convention’s delegates would be elected. In each state, the delegates were elected out of the existing electoral districts for one or both chambers of the state legislature. For instance, representation in the FL, GA, LA, and SC conventions equaled the combined number of representatives and senators apportioned to the state legislature. In AL and MS, the delegates were elected using only the basis of apportionment for each state’s lower house.
Following Ansolabehere, Gerber, and Snyder (Reference Ansolabehere, Gerber and Snyder2002), we use a metric that is relative to the “fair” level of representation in each particular state (the “relative representation index” (RRI)). Formally, this measure is
 $$RR{I_i} = {{{D_{j(i)}}/{N_{j(i)}}} \over {{D_j}/{N_j}}}$$
where the subscript j(i) indicates that district i is located in state j. D is the number of delegates and N denotes the voting population. This index creates a common metric across conventions by normalizing the representation of each locality by the voting power specific to each state. Individuals in districts with an index of less (more) than one were under-represented (over-represented) in their convention. A value close to one corresponds to a level of representation consistent with the “one person, one vote” principle.
To estimate the electorate, we take the AWM population as a proxy for the number of registered voters and subtract the adult white foreign-born males. This latter group was largely ineligible for failing to meet citizenship or residency requirements (Keyssar Reference Keyssar2001).Footnote 30 These variables are constructed from the 1860 Census.Footnote 31 We focus the analysis on the founding members of the Confederacy (AL, FL, GA, LA, MS, and SC), whose choice to secede was made solely by elected representatives in state conventions. In our Online Appendix, we show the close association between legislative and convention over-representation in these states (Online Appendix Figure 4).
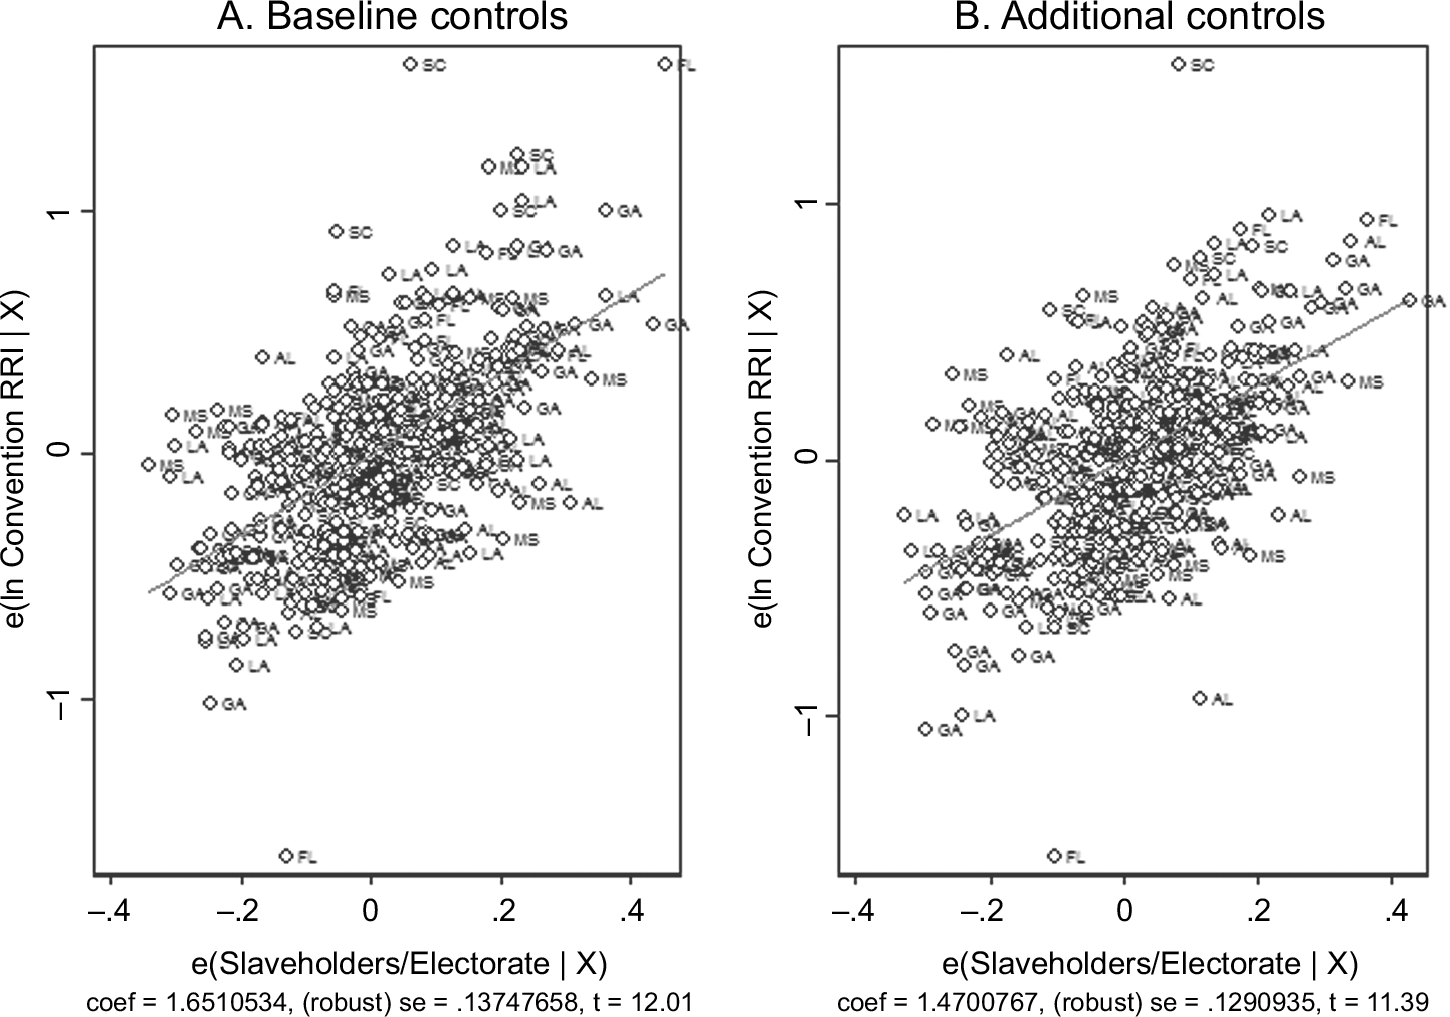
In Figure 3, we present two scatterplots exploring the relationship between the incidence of slaveholders in the electorate and the relative representation of counties in the conventions. Namely, these figures show two partial regression plots with the residuals of the convention RRI (in natural logs) on the y-axis against the residuals of the share of slaveholders in the electorate on the x-axis. The latter captures the breadth of slave ownership among each county’s electorate. We take the natural log of the RRI to reduce the weight of outliers and the right skew of this variable. Both models include state fixed effects; therefore, the slope coefficients have a within-state interpretation. Each marker corresponds to a single district in the corresponding state.
In Panel A, we first show a parsimonious model that controls only for (ln) total county population and state fixed effects. The estimated slope coefficient on the local incidence of slaveholders is positive and highly significant. The point estimate of 1.65 (S.E. = 0.14) in Panel A implies that holding all other things equal, a district where half of its voters are slaveholders will have a predicted RRI score about 25 percent greater than that of the average district in the sample (where slaveholders comprised roughly one-third of the electorate). This difference represents approximately 48 percent of the standard deviation observed in the empirical distribution of the log RRI for these conventions. The difference in relative representation with a district one standard deviation below the mean, where slaveholders represented 19 percent of the electorate, is more than 65 percent.
In Panel B, we control for population density, which is usually associated with legislative malapportionment and is positively correlated with slavery.Footnote 32 To calculate this measure, we take the county size and 1860 boundaries from the Atlas of Historical County Boundaries (Newberry Library, Chicago). In addition, to account for the possibility that over-representation is driven by land wealth, which is also positively correlated with slave labor incidence, we include the district’s farmland value per acre as a control.Footnote 33 As is evident from Panel B, the positive association between over-representation and the share of slaveholders in the electorate is largely unchanged when these covariates are partialed out.
In our Online Appendix, we explore the robustness of these results. First, we expand the set of controls to include other economic characteristics of constituencies (e.g., land inequality). Second, we use alternative measures for the local-level importance of slavery: the share of the electorate who were planters, defined as slaveholders owning 20 or more slaves (Wright Reference Wright1978). Last, we perform a sensitivity analysis excluding outliers and taking each convention separately. Overall, the positive and highly significant association between slaveholders and over-representation in the conventions is robust to the inclusion of additional controls and across specifications (Online Appendix Figures 5–8).
The Political Geography of Slavery
Political scientists have demonstrated that in electoral systems with plurality voting, the degree to which representation reflects the preferences of the electorate depends on the spatial distribution of voters (Cox and Katz Reference Cox and Katz2002). This was particularly relevant in the election of convention delegates, as secession divided the electorate across slave-ownership lines (see, e.g., Lipset 1960; Key 1984; Johnson Reference Johnson1999). In particular, the concentration of slaves meant that slaveholders were spatially distributed such that despite being a minority overall, they could obtain pluralities in enough districts to elect a majority of delegates.
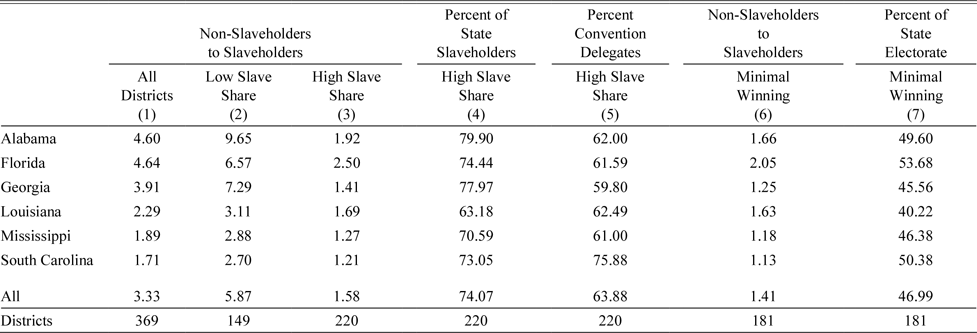
In Table 1, we illustrate this electoral bias. In Column (1), we report the average district non-slaveholder–to–slaveholder ratio in each of the original Confederate states.Footnote 34 Although slaves constituted nearly 50 percent of the total population in these states, there were, on average, more than three non-slaveholders for every one slaveholder. We then sort counties from lowest to highest slave share and create two groups, each containing approximately half of the state’s non-slaveholders. In the low slave-share districts (Column (2)), which elected 36 percent of the convention delegates, there were, on average, approximately six non-slaveholders for every slaveholder. Column (3) shows that in the remaining counties, there were, on average, only 1.58 non-slaveholders for every slaveholder. As reported in Column (4), around 74 percent of the slaveholding population lived in these highest slave-share counties. This uneven spatial distribution of slave ownership was particularly pronounced in the three Lower South states with the largest white populations (AL and GA). The electoral advantage of this is shown in Column (5), as these most enslaved counties selected, on average, almost two-thirds (64 percent) of the delegates.
SPATIAL DISTRIBUTION OF SLAVE OWNERSHIP AND REPRESENTATION

Notes: The ratio of non-slaveholders to slaveholders (Columns (1)–(3) and (6)), the share of slaveholders (Column (4)), and the share of voters (Column (7)) are calculated from the 1860 Census. The set of “Minimum Winning” districts (Columns (6) and (7)) is the smallest set of counties electing a simple majority of delegates in each convention, sorting counties from highest to lowest slave share (slave population/total county population). Number of delegates obtained from the official journal for each convention.
Sources: 1860 Census and convention’s journal.
Finally, in Columns (6) and (7), we combine these demographics with the apportionment of each convention. Specifically, we construct a set of “minimal winning districts,” defined as a subset of the most enslaved districts electing a simple majority of delegates. As shown in Column (6), the non-slaveholders–to–slaveholders ratio of these districts was significantly lower than the overall average, and while they contained approximately 47 percent of the electorate in these states (Column (7)), they had 63 percent of its slaveholders and more than 80 percent of its planters. Hence, it is not surprising that these localities overwhelmingly elected secessionist candidates. Indeed, as we show in the next section, nearly 90 percent of the delegates from these counties voted for secession in their convention. Since secessionists only needed local majorities in these minimal winning districts, the choice of secession could have been made by slaveholders alone. To wit, in the three states for which we have electoral returns and census information, the slaveholders in the districts won by secessionists (58,058) represented a substantial share of the total votes received by pro-secession candidates (67,181).
Was the Bias in Representation Pivotal?
While the evidence indicates that secessionist leaders believed that using conventions and avoiding referendums was crucial to the success of their movement, can we conclude from the existing electoral returns that the bias to representation was pivotal to the election of pro-secession majorities in the conventions? We now explore this question using a simple basis for fair representation to construct a counterfactual delegation for the three conventions for which we have district-level electoral returns.
To conduct this analysis, we simplify matters by using the rules of apportionment employed in each state. This means, for instance, that we use the total number of delegates the legislatures specified for each convention (e.g., 100 delegates in AL, 301 in GA, and 130 in LA). We then reapportion each convention closest to the “one (adult white) man, one vote” principle. Specifically, we calculate the state’s electorate per delegate and assign delegates to each district based on the size of their electorate. In each state, we use the existing electoral districts. For AL and GA, counties were not combined to make electoral districts and, thus, each delegate was wholly elected out of a single county. Hence, we reapportion delegates entirely from one county to another.
The choice of the LA legislature to select delegates out of both the existing lower and upper house districts complicates the analysis. For one, most senate districts were composed of multiple counties. Furthermore, the delegates elected out of senatorial districts comprised only 32 of the convention’s total delegation of 130. As a result, our counterfactual exercise in this state primarily entails equalizing representation between the delegates elected out of house and senatorial districts. Finally, to calculate the counterfactual for each convention, we assume that voters would have voted the same under this new apportionment (i.e., voting behavior is invariant to the number of local representatives).
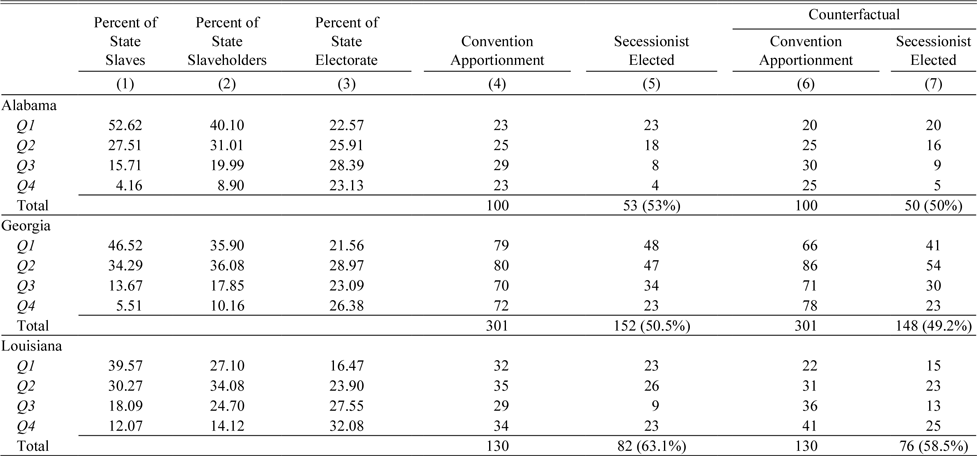
Our findings are presented in Table 2. For each convention, we divide counties into quartiles sorted from the highest slaveholder proportion to the lowest. Thus, Q1 (Q4) consists of counties whose electorate had the highest (lowest) proportion of slaveholders within each state. Columns (1)–(3) report the share of the state’s slaves, slaveholders, and electorate each quartile contains. Column (4) reports the number of delegates these counties were actually apportioned and Column (5) the number of those who were elected as secessionists. For example, in AL, the top quartile counties contained more than half the state’s slaves, 40 percent of its slaveholders, and around 23 percent of its electorate, and they were apportioned 23 percent of the delegates. As shown in Column (5), all of these delegates were elected as secessionists. Column (6) reports the total number of delegates this group would receive under fair apportionment. In Column (7), we use the electoral returns to calculate the number of counterfactual delegates who would have been elected as secessionists. The top two quartiles lose three delegates to reapportionment and, as a result, the total number of elected secessionist delegates declines from 53 to 50 (out of 100).Footnote 35 Table 2 shows a similar pattern in our counterfactual GA convention: The highest slaveholder-proportion counties lose seats. As a result, secessionist delegates actually become a minority in this crucial state.
COUNTERFACTUAL APPORTIONMENT BY SLAVEHOLDER-SHARE QUARTILES

Notes: Quartiles in each state are obtained sorting counties by highest-to-lowest slaveholder share in the electorate. Columns (1)–(3) report the share of each state’s slaves (1), slaveholders (2), and electorate (3) in each group. Columns (4) and (5), respectively, show the number of actual delegates apportioned to the counties in each quartile (4) and the number of these in which Secessionist candidates were elected (5). Columns (6) and (7), respectively, report the counterfactual number of delegates apportioned to each county under fair apportionment (6) and then the number of secessionist candidates elected under this apportionment (7) using the same observed patterns in the election of delegates.
Source: See Online Appendix Table 3.
In LA, because the senatorial apportionment was more biased against low slave-share districts, this analysis resulted in a roughly 5 percent increase in the number of cooperationist delegates. Yet, the slim secessionist majority in the low slave-share and under-represented Orleans Parish (i.e., New Orleans), a surprising outcome largely attributed to low turnout among anti-secessionists (e.g., Gary Reference Gary2004; McCrary, Miller, and Baum Reference McCrary, Miller and Baum1978), is possibly the reason why our counterfactual analysis does not result in a larger cooperationist delegation in this state.Footnote 36
While the lack of county-level returns for delegates means that we can only perform this analysis in three states, these calculations demonstrate the importance of the biased system of representation in manufacturing the observed pro-secession majorities in at least two conventions. Furthermore, the analysis for LA shows how the separate influences of the convention on turnout and representation each contributed to the observed secessionist majorities in this state.
REPRESENTATION IN THE CONVENTIONS
Since the choice on secession was transferred from the voters to representatives, a relevant question is whether delegates effectively represented the interests of their constituents. In particular, delegates could have been more responsive to their own personal interest in slavery than to the one of the constituents.Footnote 37 Although historical works have explored this question (notably Wooster Reference Wooster1962), to our knowledge, no previous work has systematically examined the voting behavior of delegates or tested whether they faithfully represented the economic interests in slavery of their constituents. We explore this potential agency problem using a comprehensive list of votes in various conventions and test whether the delegate-level support for secession was conditioned by the slave ownership structure and the expressed preferences of their constituents toward secession.
Using the official journal of each convention, we coded all roll-calls where we could infer the revealed position on secession and match each delegate to their constituency. We restrict the analysis to votes that occurred prior to the firing on Fort Sumter (15 April 1861) and to the Lower South conventions for which there are relatively complete county-level electoral returns (AL, GA, and LA). As a robustness test, we also use votes from two conventions in the Upper South (AR and VA), which voted against secession. In sum, our analysis comprises five independent legislative bodies.
Each coding includes the vote on the final secession ordinance. While pre-ordinance motions were not identical across states, in the Lower South conventions, the substance and sequence of the votes were similar. The first entailed a motion on whether the state had the right and obligation to secede given the threat of Lincoln’s election. Cooperationists would then offer as an alternative to organize a Southern-wide convention to bargain with the North as a unified regional bloc. When this was voted down, cooperationists would then put forth a resolution conditioning secession to a ratification referendum. In two of the three Lower South conventions analyzed (AL and LA), this popular ratification was proposed and voted down.Footnote 38 In total, we coded 17 motions and resolutions involving 725 delegates and 2407 individual votes. The resolutions, their description, and the final vote tally in each are presented in Online Appendix Table 2.
We use two different measures to estimate the weight of constituencies on the voting behavior of delegates. First, we use the incidence of slaveholders in the electorate, which captures the potential local support for secession based on the economic interest of voters. Second, we use a more direct measure based on the observed electoral support by creating a dummy for whether secessionist candidates obtained a majority in the district.Footnote 39 This indicator allows us to capture in a simple way the “mandate” given to delegates in each convention and whether delegates represented this platform in the convention.
The incidence of slave labor (and, hence, slaveholders) is potentially correlated with local features that could have directly altered the cost and benefits of secession. Hence, we control for a number of economic factors such as farmland value per acre and population density. Similarly, local commercial connections and access to markets could have shaped the willingness to secede (Noe Reference Noe1994), which we proxy by the length of steamboat-navigated rivers and railroads (normalized by area) in 1860 (as measured by Atack Reference Atack, Gregory, DeBats and Lafreniere2018)). Slave prevalence is also associated with wealth inequalities; thus, our slaveholders share measure could pick up the effect of non-slave-based inequality. To address this, we control for land inequality using a Gini index similar to the one employed by Nunn (Reference Nunn and Helpman2008). We also include the (ln) total population of the district as a control to account for scale effects.
Finally, we control for delegate-specific characteristics that may have influenced their position on secession and over-ridden the importance of their constituents’ interests. Primarily, a delegate’s personal economic interest in slavery may crucially influence his vote. To account for this, we control for the number of slaves each delegate owned using the Slave Schedule of the 1860 Census.Footnote 40 We complement this measure with other personal characteristics using the biographical information collected by Wooster (Reference Wooster1951, Reference Wooster1954, Reference Wooster1956). This information includes age, occupation, birth place, and the value of real property; it is available for three of the five conventions analyzed.Footnote 41
RESULTS
We investigate the relationship between the delegate-level support for secession and the share of slaveholders in their constituents using a series of linear probability models, where the dependent variable is an indicator for either a “yea (1)” or a “nay (0)” on each motion (yea represents the pro-secession position).Footnote 42 In addition to the characteristics described above, we include a full set of motion fixed effects. Standard errors are clustered at the delegate level so they are robust to heteroskedasticity and serial correlation.Footnote 43
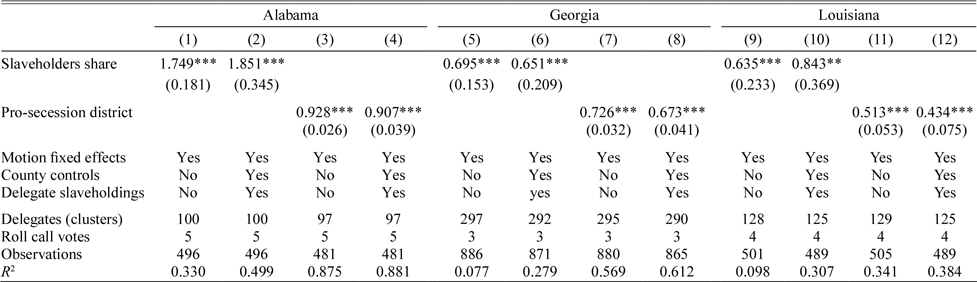
Table 3 presents the estimates for the three Lower South conventions for which we have complete county-level returns (AL, GA, and LA). In all odd columns, we first present a simple bivariate model with no controls. We then include the same set of county and delegate-level controls to make the estimates comparable (even columns). The estimated coefficient on the share of slaveholders in the electorate is positive and highly significant in all conventions. The magnitude of these coefficients is also large. For instance, the estimate of 1.75 (S.E. = 0.18) for AL in Column (1) implies that a delegate from a district in which 47 percent of its voters are slaveholders (one standard deviation above the mean) is predicted to have approximately 0.28 more chance of voting for secession than a delegate elected from an average district (where 30 percent of the voters are slaveholders). As shown in Column (2), the inclusion of controls has little impact on the magnitude of this relationship.Footnote 44
SLAVERY AND SUPPORT FOR SECESSION: LOWER SOUTH CONVENTIONS

Notes: Robust standard errors clustered at the delegate level are in parentheses. *** p < 0.01, ** p < 0.05, * p < 0.1. The dependent variable in all columns is the delegate-level likelihood of a pro-secession vote in the different conventions. County controls include the following: (ln) total district population, population density, land inequity measured by a Gini index, farm land value (per acre), and extension of railroads and steamboat-navigated rivers. Delegate slaveholdings refers to the (ln + 1) number of slaves owned by each delegate according to the 1860 Slave Schedule, U.S. Census. All models include a full set of motion fixed effects.
Source: See the Online Appendix Table 2.
In Columns (3) and (4), we use the dummy indicating whether the delegate was elected under a secessionist platform as the main explanatory variable. As shown, this variable almost perfectly predicts the voting behavior in the AL convention; a delegate elected as a secessionist in this convention is predicted to have 0.91 more chance of casting a pro-secession vote compared to a delegate elected as a cooperationist (Column (4)). This indicates that even though these were one-off elections, electoral promises were kept and delegates followed their mandate. The estimates for GA (Columns (5)–(8)) and LA (Columns (9)–(12)) are smaller but significant and overall consistent. The 0.84 (S.E. = 0.37) for the LA convention in Column (10), for instance, implies that a one-standard-deviation increase in district slaveholders share is associated with an increase in the likelihood of casting a pro-secession motion by 11 percent. A delegate in this convention elected as a secessionist is approximately 50 percent more likely to vote for secession compared to one elected as a cooperationist (Columns (11) and (12)).
In our Online Appendix, we explore the robustness of these results. First, while the vote on the final ordinance tended to be lopsided, pre-ordinance votes were generally closely contested, which suggests that the final votes contained a significant degree of strategic behavior by delegates.Footnote 45 To account for this, we perform a sensitivity analysis excluding the final vote from the sample. As expected, the estimated correlation between slaveholders share and support for immediate secession is generally larger and more precisely estimated (Table 5). Second, we augment the set of controls to account for additional economic, political, and cultural factors. For example, we control for other potentially relevant economic characteristics, such as the size of the manufacturing sector, which could be negatively correlated with slavery and alter the benefits of separation. We also include additional delegate-level controls such as age and occupation (farmer, lawyer, and planter) dummies. Overall, the association between local slave incidence and support for immediate secession is robust to the inclusion of these additional controls (Table 6).
Last, to explore the generalizability of these results, we use the roll-call votes in two Upper South conventions (AR and VA), which elected a minority of secessionist delegates. Although we do not have information on the platforms of these delegates, the estimated coefficient when using slaveholders share is positive and highly significant, indicating that the effective representation of local economic constituencies in the conventions was not confined to the Lower South (Online Appendix Table 7).
CONCLUSION
In this paper, we investigate the economic and political determinants of secession in the Lower South. First, we demonstrate that the choice to use state conventions significantly lowered the share of the electorate whose support was necessary to achieve secession. Second, we show that the representation in these conventions was biased in favor of high slave-share counties. Furthermore, this bias may have been pivotal to the election of secessionist majorities in AL and GA. This evidence suggests that the perceived threats to slave property were likely insufficient to drive a majority of voters in the Lower South to support a radical policy such as secession. Our findings also help reconcile works emphasizing that the rents to slavery were enjoyed by a small minority (e.g., Ransom Reference Ransom2018) with the historical literature emphasizing the opposition to this movement among non-slaveholders (e.g., McCurry Reference McCurry2010).
Our findings, of course, do not preclude the possibility that armed conflict over slavery would have occurred even in a context of better representation and checks on state conventions. As economic historians have shown, slavery was thriving and there were no signs of its impending economically determined demise (e.g., Fogel Reference Fogel1994). If thwarted democratically, secessionists likely would have turned to irregular measures to protect this institution (as the extra-legal convention in TX demonstrates).
Yet, coups and other non-democratic methods would have only exacerbated the underlying class tensions along slave-ownership lines within Southern society. In fact, the successful push for secession from slaveholders in a divided population may have ultimately undermined their political goal. As historians have argued, internal dissension, particularly deep class conflicts, contributed to the military defeat of the South (see, e.g., Beringer, Jones, and Still Reference Beringer, Jones and Still1991; Escott Reference Escott1978; Williams Reference Williams2008). For instance, more than 10 percent of the soldiers from the Confederate states fought for the Union and desertion, especially of soldiers from the upcountry, became an increasing problem as the war dragged on (Freehling Reference Freehling2007).Footnote 46 The representative institutions of the South allowed a small elite to bring their states to war but could not force the yeoman and poor whites to fight indefinitely for their cause.
Primary Sources
The History and Debates of the Convention of the People of Alabama, Begun and Held in the City of Montgomery, on the 7th Day of January, 1861. Smith, William Russell. Montgomery, AL: White, Pfister & Co., 1861.
Journal of the Public and Secret Proceedings of the Convention of the People of Georgia, Held in Milledgeville and Savannah in 1861, Together with the Ordinances Adopted. Milledgeville, GA: Boughton, Nisbet, & Barnes, 1861.
Official Journal of the Proceedings of the Convention of the State of Louisiana. New Orleans: J.O. Nixon, 1861.
Journal of both sessions of the Convention of the state of Arkansas, which were begun and held in the capitol, in the city of Little Rock. Walker, David, Little Rock, Johnson & Yerkes, state printers, 1861.
Journal of the acts and proceedings of a general Convention of the State of Virginia, assembled at Richmond, on Wednesday, the thirteenth day of February, eighteen hundred and sixty-one. Richmond, VA: W. M. Elliott, 1861.
Selected items from the Milledge Luke Bonham Collection. University of South Carolina.
William Porcher Miles Papers, 1784–1906. University of North Carolina.
James Henry Hammond Papers, 1774–1875. Library of Congress.
Toombs, Robert Augustus, Alexander Hamilton Stephens, and Howell Cobb. The Correspondence of Robert Toombs, Alexander H. Stephens, and Howell Cobb. Vol. 2. Govt. Print. Off., 1913.