1 Introduction
The impact of a drop on a solid surface is a canonical problem in fluid mechanics of fundamental significance in numerous natural and industrial processes. Herein we focus on the dynamics of the air layer which is entrapped under the centre of the drop owing to the lubrication pressure in the air. Most earlier studies have focused on low-viscosity drops, as reviewed below, but we investigate the effects of greatly increasing the drop viscosity.
Thoroddsen et al. (Reference Thoroddsen, Etoh, Takehara, Ootsuka and Hatsuki2005) used high-speed video to image the details of the break-up of the air layer and modelled the contraction of the resulting air disk into a central bubble. They even see the pinch-off of a micro-drop inside the bubble, by a capillary-wave mechanism, subsequently verified by Lee et al. (Reference Lee, Weon, Je and Fezzaa2012) using X-ray imaging. Liu, Tan & Xu (Reference Liu, Tan and Xu2013) and Driscoll & Nagel (Reference Driscoll and Nagel2011) used interferometry with
 ${\sim}7~\unicode[STIX]{x03BC}\text{s}$
time resolution to observe the shape and compression of the air disc. Most recently Li & Thoroddsen (Reference Li and Thoroddsen2015) used interferometry with 200 ns time resolution to capture both the compression and immediate rebounding of the air disc for high impact velocities.
Thoroddsen et al. (Reference Thoroddsen, Thoraval, Takehara and Etoh2010) studied the entrapment of a myriad of micro-bubbles by the impact of a drop 10 times the viscosity of water. This occurs through the local contacts of a levitated liquid sheet ahead of the outer contact line, which occurs at much later times than studied herein. Driscoll, Stevens & Nagel (Reference Driscoll, Stevens and Nagel2010) and Palacios et al. (Reference Palacios, Hernández, Gómez, Zanzi and López2012) have further studied these effects.
Early theoretical work on air cushioning includes that of Smith, Li & Wu (Reference Smith, Li and Wu2003) and Korobkin, Ellis & Smith (Reference Korobkin, Ellis and Smith2008) who balanced the viscous lubrication pressure in the thin air layer with the rapid deceleration of the bottom of the drop. Hicks & Purvis (Reference Hicks and Purvis2010) reformulated the earlier two-dimensional (2-D) theories for the axisymmetric case, to allow quantitative comparison with experiments. They predicted the radial size of the air disc
 $L_{o}$
at first contact, as (Hicks et al.
Reference Hicks, Ermanyuk, Gavrilov and Purvis2012; Hicks & Purvis Reference Hicks and Purvis2013)
 $$\begin{eqnarray}\displaystyle L_{o}=3.8\left(\frac{4\unicode[STIX]{x1D707}_{g}}{\unicode[STIX]{x1D70C}_{\ell }V}\right)^{1/3}R_{b}^{2/3}, & & \displaystyle\end{eqnarray}$$
where
 $\unicode[STIX]{x1D707}_{g}$
is the gas viscosity,
 $\unicode[STIX]{x1D70C}_{\ell }$
is the liquid density,
 $V$
is the impact velocity of the drop and
 $R_{b}$
the bottom drop radius of curvature. Li & Thoroddsen (Reference Li and Thoroddsen2015) verified this formula, without any adjustable constants, for water drops impacting at atmospheric pressure,
 $P_{atm}$
.
Mandre, Mani & Brenner (Reference Mandre, Mani and Brenner2009) derived the conditions when the compressibility of the air becomes noticeable at large
 $V$
. This is determined by a compressibility factor
 $$\begin{eqnarray}\displaystyle \unicode[STIX]{x1D716}^{-1}=\left(\frac{RV^{7}\unicode[STIX]{x1D70C}_{\ell }^{4}}{\unicode[STIX]{x1D707}_{g}}\right)^{1/3}\frac{1}{P_{atm}}. & & \displaystyle\end{eqnarray}$$
If
 $\unicode[STIX]{x1D716}^{-1}\gg 1$
we expect compression of the air disc to be noticeable. Mandre et al. (Reference Mandre, Mani and Brenner2009) predict, for adiabatic compression, that the air-layer thickness on the axis of symmetry reduces as
 $H^{\ast }/(R\,St^{2/3})\sim \unicode[STIX]{x1D716}^{1/3}$
, where, following recent nomenclature,
 $St$
is the inverse of the conventional Stokes number, i.e.
 $St=\unicode[STIX]{x1D707}_{g}/(\unicode[STIX]{x1D70C}_{\ell }RV)$
. Li & Thoroddsen (Reference Li and Thoroddsen2015) obtained experimentally a similar scaling law, where
 $H^{\ast }/(R_{b}St^{2/3})=4.2\unicode[STIX]{x1D716}^{0.40}$
. They also imaged the formation of a kink in the surface at the edge of the air disk. This kink moves rapidly in the radial direction at
 $U/V\sim St^{-1/3}$
, in good agreement with theory. See also Duchemin & Josserand (Reference Duchemin and Josserand2011).
Mandre et al. (Reference Mandre, Mani and Brenner2009) first suggested the interesting idea that an impacting drop could skate on a thin layer of air and even splash without ever touching the solid surface. This proposal has been further developed in Mani, Mandre & Brenner (Reference Mani, Mandre and Brenner2010), Kolinski et al. (Reference Kolinski, Rubinstein, Mandre, Brenner, Weitz and Mahadevan2012) and Mandre & Brenner (Reference Mandre and Brenner2012). However, this skating does not occur for low-viscosity liquids impacting at modest
 $V$
; see discussion in Josserand & Thoroddsen (Reference Josserand and Thoroddsen2016). Rather, the entrapment of the central air disc and its subsequent contraction into a bubble (Thoroddsen et al.
Reference Thoroddsen, Etoh, Takehara, Ootsuka and Hatsuki2005), mandates a contact with the solid surface. Li, Vakarelski & Thoroddsen (Reference Li, Vakarelski and Thoroddsen2015) have shown that ring contact even occurs for impacts on molecularly smooth mica sheets, proving that surface roughness is not needed to prevent skating. Only for very low
 $V$
do such drops skate and rebound. But then rebound occurs even for hydrophilic surfaces (Kolinski, Mahadevan & Rubinstein Reference Kolinski, Mahadevan and Rubinstein2014; de Ruiter et al.
Reference de Ruiter, Lagraauw, van den Ende and Mugele2015).
Bouwhuis et al. (Reference Bouwhuis, van der Veen, Tran, Keij, Winkels, Peters, van der Meer, Sun, Snoeijer and Lohse2012) studied the impact conditions where the entrapped central bubble has the largest volume. Their work used low-viscosity ethanol droplets, impacting at low or moderate velocities. Higher impact velocities reduce the thickness of the air disc, while at lowest impact velocities surface tension minimizes deformation at the bottom of the drop, again reducing the bubble size. Thereby, at an intermediate velocity there is a maxima, which occurs when
 $V_{c}\sim (\unicode[STIX]{x1D707}_{g}\unicode[STIX]{x1D70E}^{3}/\unicode[STIX]{x1D70C}_{\ell }^{4}R^{4})^{1/7}$
. For an ethanol drop of
 $R_{b}=0.9$
mm, this gives
 $V_{c}=0.25~\text{m}~\text{s}^{-1}$
. Klaseboer, Manica & Chan (Reference Klaseboer, Manica and Chan2014) have subsequently derived a slightly modified formula for the same quantity.
Most of the above studies have been focused on impacts of low-viscosity drops. Herein we extend the interferometry method used by Li & Thoroddsen (Reference Li and Thoroddsen2015) for water drops, to investigate the effect of greatly increasing the drop viscosity on the entrapment and gliding of the thin air layer. This we do using silicone oil drops of as much as 20 million times higher viscosity than that of water.
2 Experimental set-up
2.1 Optical set-up and high-speed interferometry
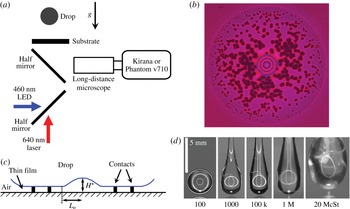
The experimental configuration is sketched in figure 1(a) and is similar to that in Li & Thoroddsen (Reference Li and Thoroddsen2015) and Li et al. (Reference Li, Vakarelski and Thoroddsen2015). The video imaging is done through a bottom glass plate. Most of the results were obtained with single-colour reflective interferometry to measure the thickness of the air layer
 $h(r)$
versus time. The pulsed monochromatic illumination (
 $\unicode[STIX]{x1D706}_{red}=640$
nm) came from 180 laser diodes (SI-LUX640), with one per video frame. This gives a depth resolution of
 $\unicode[STIX]{x1D706}_{red}/4=160$
nm, between peaks of adjacent dark and bright fringes. We use a Leica (Z16 APO) long-distance microscope, with pixel resolution down to
 $1.04~\unicode[STIX]{x03BC}\text{m}~\text{px}^{-1}$
. The rapid surface motions during the closest approach and drop deformation, require ultra-high-speed video, which was acquired with the Kirana-05M from Specialized Imaging in Tring, UK (Crooks et al.
Reference Crooks, Marsh, Turchetta, Taylor, Chan, Lahav and Fenigstein2013), at frame rates up to 5 million frames per second (fps). The 200 ns time resolution allows us to follow individual fringes between video frames, which can be used to get the absolute thickness of the air film once contact is made between drop and solid, by tracing back and counting fringes from this zero thickness.
Most impacts were on a glass surface, but some on molecularly smooth freshly cleaved mica for comparison, showing little difference, in contrast to the low-viscosity case, where Li et al. (Reference Li, Vakarelski and Thoroddsen2015) have shown how even 20 nm roughness of glass can influence the first contact, resulting in a ring of micro-bubbles. The silicone oils fully wet the glass and mica surfaces.
(a) Sketch of the two-colour interferometry set-up, showing the arrangement of the blue LED and red laser diodes with respect to the drop and video camera. The impact is imaged through a glass substrate. (b) Numerous ruptures (dark spots) of an extended thin air film under the centre of a
 $\unicode[STIX]{x1D708}_{\ell }=10\,000$
cSt drop impacting at
 $V=2.8~\text{m}~\text{s}^{-1}$
. The central dimple shows a few closely spaced fringes, while the outer radius of the film is
 $590~\unicode[STIX]{x03BC}\text{m}$
. For comparison the bottom radius of curvature of the drop is 1.3 mm. The edge of the drop is therefore far outside the image area. (c) Schematic of the thin air layer under the drop, with a dimple and an extended thin film, which ruptures at numerous random locations as in panel (b). (d) Typical drop shapes, with extended tails for the higher viscosities.

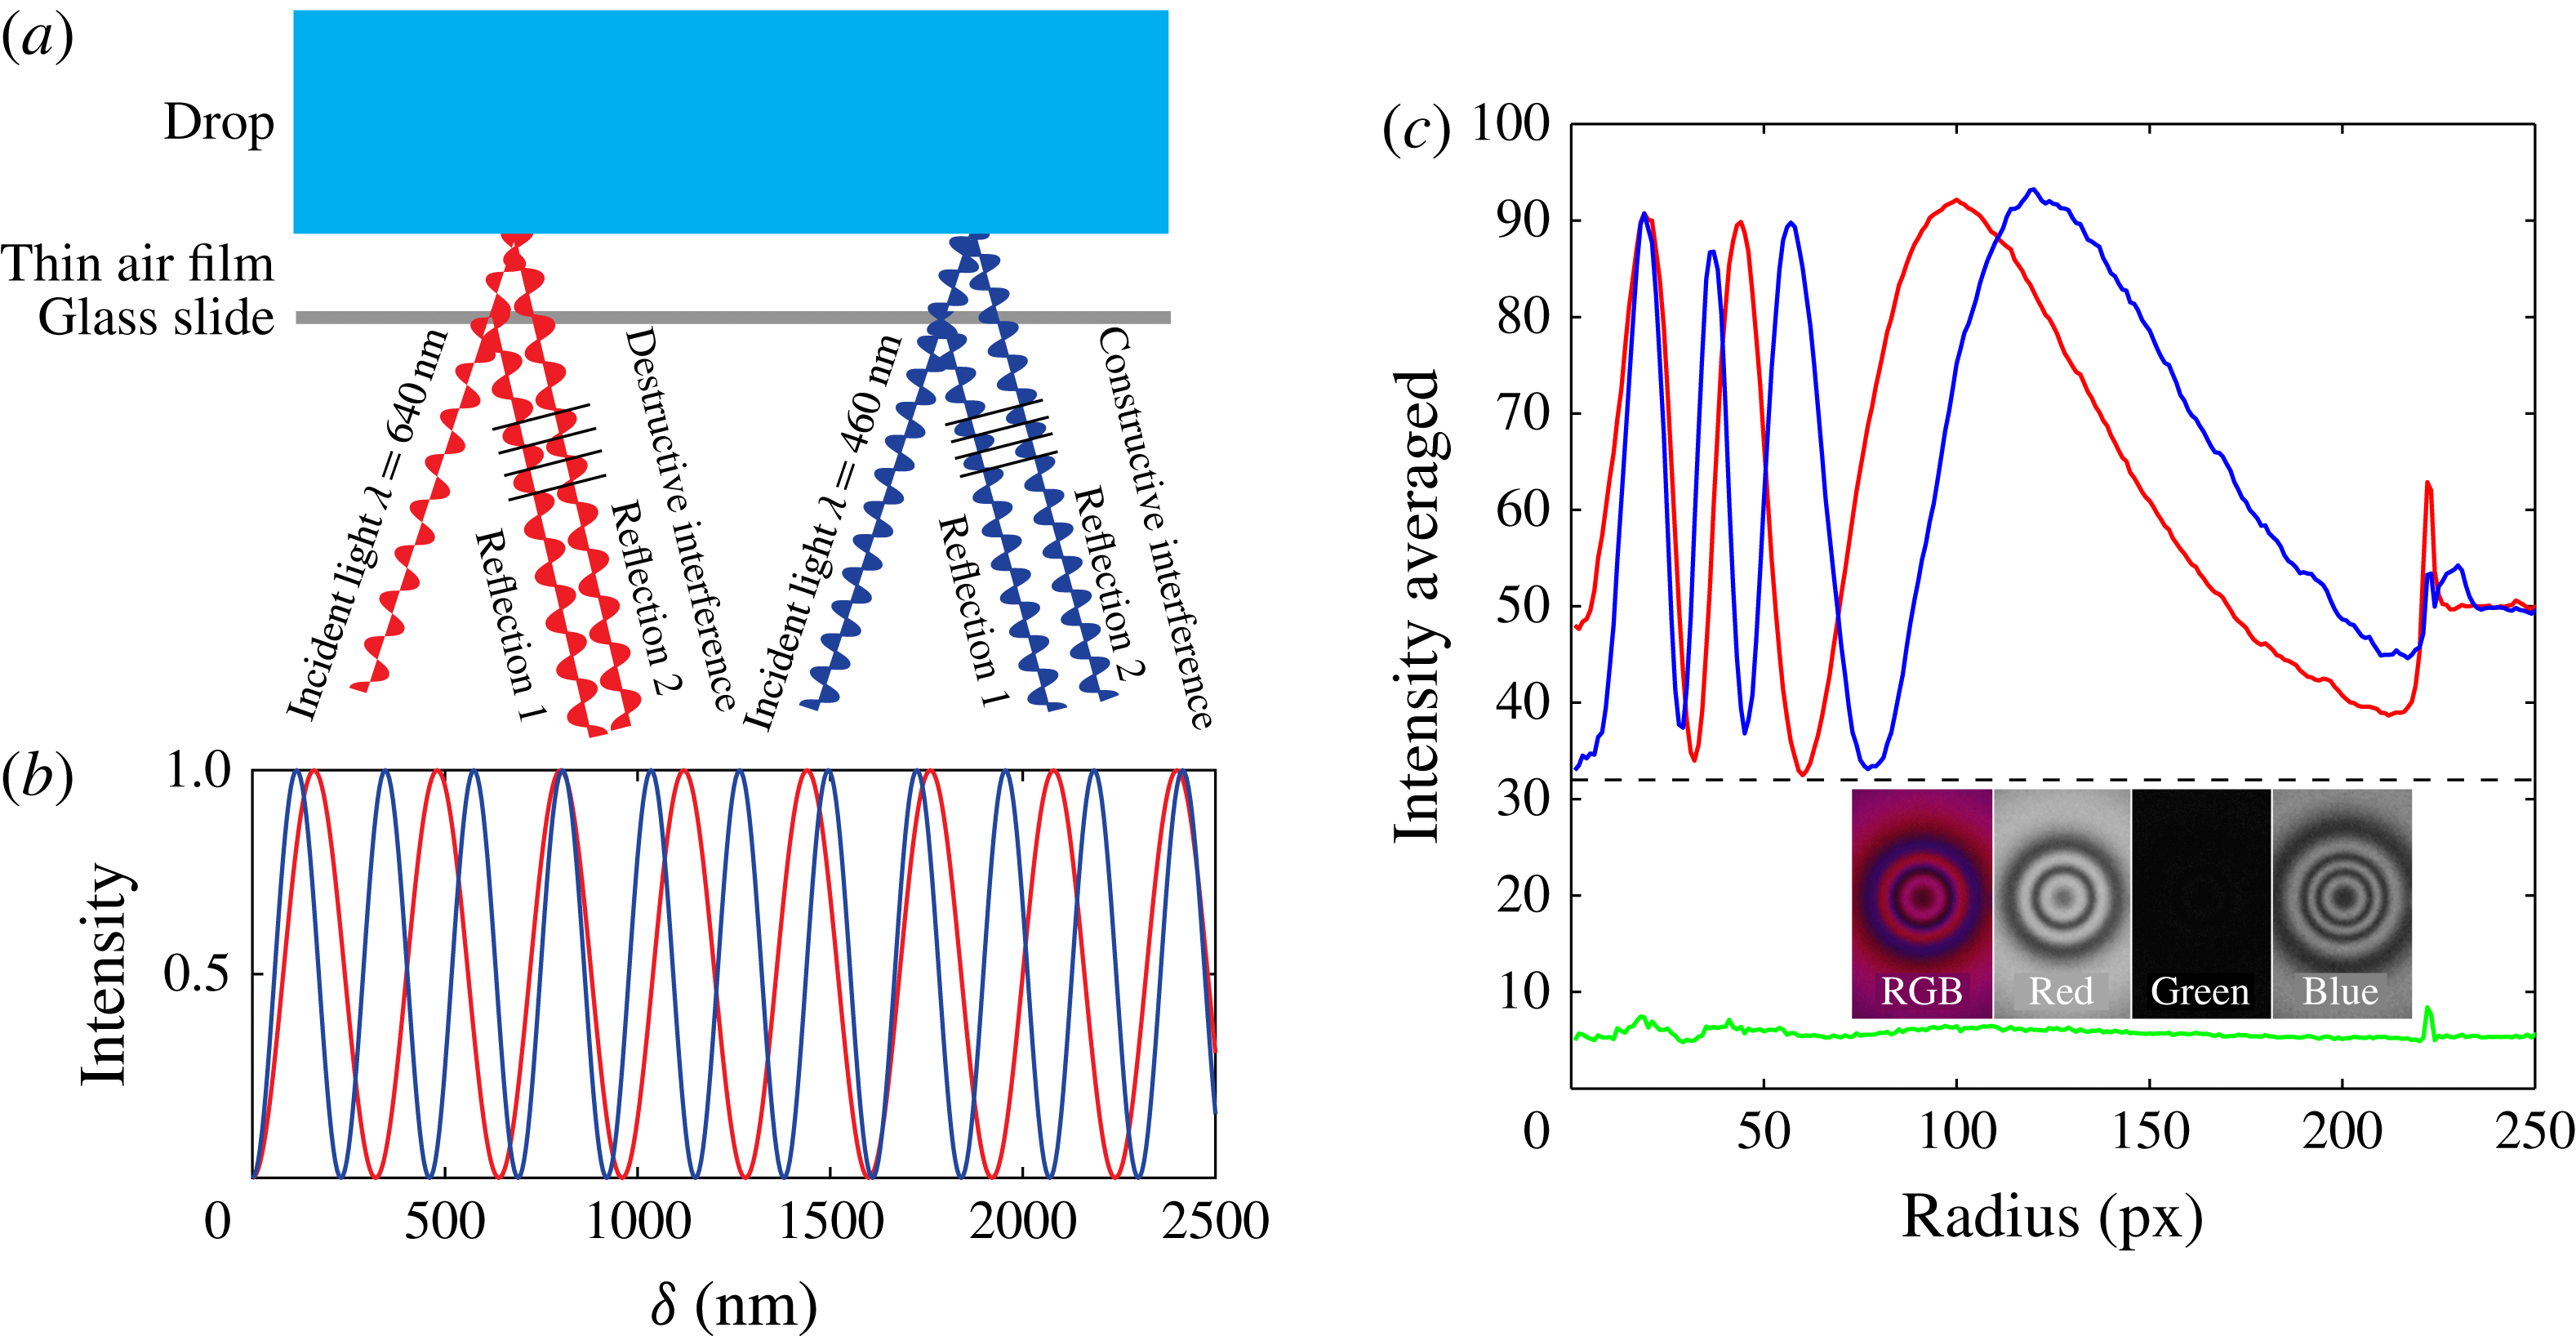
(a) Schematic of the interference of red and blue wavelength light, showing the difference in the phase of the two interacting reflections, here resulting in constructive for blue and destructive interference for the red light. The rays are drawn at an angle to separate the waves in the sketch, but in the experiments, they are perpendicular to the glass. (b) Fringe pattern intensities calculated from (2.1) for our red and blue wavelengths. (c) Typical colour interferometry fringes after normalizing the peak levels of the two colours. The corresponding air-layer thickness is shown in figure 3(a). The inset shows the red–green–blue (RGB) colour layers of the image.

2.2 Two-colour interferometry
However, for the most viscous drops an extended air film forms at the outer edge of the central air dimple, which does not touch the solid in a repeatable manner. Rather, this air film ruptures at isolated random locations (see figure 1
b,c) and it is not obvious a priori at what thickness this occurs. It might be possible for these contacts to jump across an air-film thickness
 ${>}\unicode[STIX]{x1D706}/2$
. Therefore, to pin down the absolute thickness of this extended air layer, we also perform two-colour interferometry. For this we added a second continuous blue light-emitting diode (LED) light with
 $\unicode[STIX]{x1D706}_{blue}=460$
nm, which is passed through a 10 nm wide band-pass filter and combined with the red light through a half-silvered mirror (figure 1
a). The fringes are now observed with a colour high-speed video camera (Phantom V710). For this set-up our frame rates were limited by the intensity of the blue light and we could only run at approximately 16 kfps, with an exposure duration of
 $20~\unicode[STIX]{x03BC}\text{s}$
. Figure 2(a) shows how the interference of the two colours differs due to the different path lengths in terms of their wavelengths. They interfere at different phases of the reflected wave. For light normal to the air gap the intensity of the interfered light should vary with the gap thickness
 $\unicode[STIX]{x1D6FF}$
and the wavelength of the light
 $\unicode[STIX]{x1D706}$
, as
 $$\begin{eqnarray}\displaystyle I(r)\propto \sin ^{2}\left(\frac{\unicode[STIX]{x1D6FF}(r)\unicode[STIX]{x03C0}}{\unicode[STIX]{x1D706}/2}\right). & & \displaystyle\end{eqnarray}$$
Figure 2(b) plots this function for our red and blue wavelengths versus
 $\unicode[STIX]{x1D6FF}$
. By comparing the intensities of the different colours we can pin down the absolute air-layer thickness
 $\unicode[STIX]{x1D6FF}$
corresponding to the last bright fringe of the red light before ruptures start. We can most accurately determine the peaks and troughs of the image fringe patterns. These patterns are perfectly axisymmetric so to reduce noise we can average in the azimuthal direction. For this averaging we mask out any localized contacts. The two wavelengths used are incommensurate. We identify the absolute thickness by finding overlapping peaks in the red and blue patterns. The curves in figure 2(b) show that the intensity peaks for the two wavelengths come closest to overlapping at
 $\unicode[STIX]{x1D6FF}_{red}=800$
nm and
 $\unicode[STIX]{x1D6FF}_{blue}=805$
nm, providing an unambiguous reference air-layer thickness, see for example the first maxima in figure 2(c). The next thickness where the two peaks come close to overlapping is for
 $\unicode[STIX]{x1D6FF}\simeq 2408$
nm (
 $\unicode[STIX]{x1D6FF}_{red}=2400$
nm;
 $\unicode[STIX]{x1D6FF}_{blue}=2415$
nm), which would suggest ruptures for
 $\unicode[STIX]{x1D6FF}\sim 1600$
nm, which would be inconsistent with all previous experiments and theory on this phenomenon. We therefore rule out that possibility.
For all viscosities, the data show consistently that the final bright red fringe before the ruptures corresponds to the minimum possible bright fringe, i.e. an air-layer thickness of
 $\unicode[STIX]{x1D6FF}=160$
nm. The final bright blue fringe corresponds to
 $\unicode[STIX]{x1D6FF}=115$
nm, further pinning down the air-layer thickness where these ruptures occur. This was verified for all the impact heights and drop viscosities. In figures 1(b) and 3, most of the ruptures occur near the edge, where the film thickness is much thinner
 ${\sim}50$
nm.
(a) Air-layer thickness profile for
 $\unicode[STIX]{x1D708}_{\ell }=10\,000$
cSt drop impacting at
 $V\simeq 1.2~\text{m}~\text{s}^{-1}$
. The symbols mark the extrema of the fringe intensities (figure 2
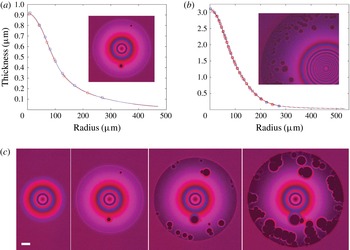
c) and the continuous line is determined from the intensity variation, using (2.1). (b) Profile with an extended thin film which has ruptured at numerous places (inset), for
 $\unicode[STIX]{x1D708}_{\ell }=100$
cSt drop impacting at
 $V=1.16~\text{m}~\text{s}^{-1}$
. Keep in mind that the central dimple is exceedingly flat with an overall height-to-width ratio of
 ${\sim}$
1 : 200, while the extended film is even thinner. The thickness of the extended film reduces from 115 nm (blue peak) to
 ${\sim}50$
nm at the edge, over a radial distance of
 $250~\unicode[STIX]{x03BC}\text{m}$
, showing a length-to-thickness ratio of
 ${\sim}$
1 : 3000. (c) Two-colour reflective interferometry showing the time evolution of the air layer under a 10 000 cSt silicone oil drop impacting on a glass plate, at
 $V=1.25~\text{m}~\text{s}^{-1}$
. Note that the central dimple pattern remains unchanged. The black spots are localized wetted contacts with the plate. Frames are spaced by
 $100~\unicode[STIX]{x03BC}\text{s}$
with the first frame at
 ${\sim}50~\unicode[STIX]{x03BC}\text{s}$
after start of drop deformation due to the intervening gas layer. This timing was determined by comparison with higher frame-rate monochrome videos. The scale bar is
 $100~\unicode[STIX]{x03BC}\text{m}$
long.

Having two interferometry patterns, one from each of the colours, we essentially have two independent measurements of the same air-layer profile, which can be compared to each other to determine the robustness of the technique. Figure 3(a,b) each draw these two profiles, showing deviations of less than 10 nm. The symbols track the maxima and minima of the intensity profiles
 $I(r)$
and the continuous line is extracted from the variation in these intensities between the extrema, based on (2.1). However, the thickness of the edge of the film, where it is thinnest, cannot be determined to the same accuracy, as the zero-level background intensity at contact is more uncertain.
Once this absolute thickness, when ruptures start, is known, we can use the 5 million fps monochrome video camera with only the red pulsed lighting to extract the time evolution of the air-layer shape.
A similar two-colour interferometry technique has been used by de Ruiter et al. (Reference de Ruiter, Oh, van den Ende and Mugele2012) and de Ruiter, Mugele & van den Ende (Reference de Ruiter, Mugele and van den Ende2015), while white-light interferometry had earlier been used to similar effect by van der Veen et al. (Reference van der Veen, Tran, Lohse and Sun2012).
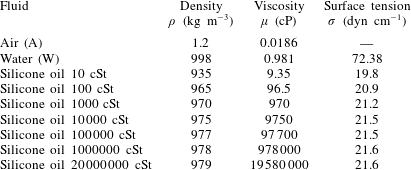
Properties of the fluids used in the experiments. Properties for silicone oil (polydimethylsiloxane) are taken from the supplier’s data sheets (Clearco Products).

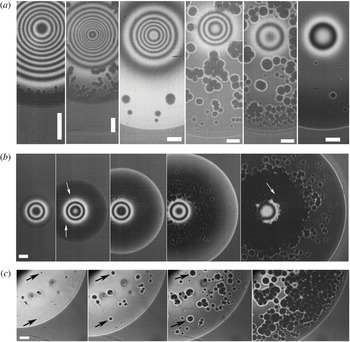
(a) Transition from immediate contact (first panel on left) to gliding on a layer of air with localized contacts. From left to right
 $\unicode[STIX]{x1D708}_{\ell }=10$
, 100, 1000, 10 000, 100 000 and 1 million cSt. Scale bars are
 $100~\unicode[STIX]{x03BC}\text{m}$
long. (b) Gliding and ruptures for
 $\unicode[STIX]{x1D708}_{\ell }=1$
million cSt drop, impacting at
 $V=4.2~\text{m}~\text{s}^{-1}$
. The arrows in the second image from left indicate first visible contacts and the arrow in the last image points at one of many micro-bubbles caught between adjacent wet spots. The times are 2, 9, 18, 42 and
 $97~\unicode[STIX]{x03BC}\text{s}$
after first visible fringe deformation. Scale is
 $100~\unicode[STIX]{x03BC}\text{m}$
. (c) Growth of local contacts for 20 million cSt drop impacting on a mica surface. The relative timing of the frames is
 $t=0$
, 30, 60 and
 $120~\unicode[STIX]{x03BC}\text{s}$
. See also supplementary material available at https://doi.org/10.1017/jfm.2016.840. Scale is
 $100~\unicode[STIX]{x03BC}\text{m}$
.

2.3 Ultra-viscous drops
Herein we use a range of higher-viscosity silicone oils, with
 $\unicode[STIX]{x1D708}_{l}$
from 10 cSt to 20 million cSt, whose properties are listed in table 1. At these very high viscosities pinch-off from a nozzle occurs with a long thread leaving extended drop shapes. The drops are herein characterized by their bottom radius of curvature
 $R_{b}$
at impact. This is determined with a concurrent side view using a Photron SA3 video camera. Viscosity damps out any oscillations and typical drop shapes for the different
 $\unicode[STIX]{x1D708}_{\ell }$
are shown in figure 1(d).
For the 20 million cSt the large viscous stress in the thread precluded using the regular pinch-off technique. We used two methods to overcome this. The first one was to attach a hemispheric drop to the bottom of a syringe cap. The other was to manually form a ball of the liquid around a flexible thread, then hang the drop in an oven to smooth out the surface. This thread, with the drop attached, could then be released through a tube into a controlled free fall.
The impact velocities presented herein are between
 $V=0.34{-}5.1~\text{m}~\text{s}^{-1}$
, corresponding to a range of Reynolds numbers,
 $$\begin{eqnarray}\displaystyle Re_{\ell }=\frac{\unicode[STIX]{x1D70C}_{\ell }R_{b}V}{\unicode[STIX]{x1D707}_{\ell }}=7.1\times 10^{-5}{-}456, & & \displaystyle\end{eqnarray}$$
Weber numbers
 $$\begin{eqnarray}\displaystyle We=\frac{\unicode[STIX]{x1D70C}_{\ell }R_{b}V^{2}}{\unicode[STIX]{x1D70E}}=7{-}2300 & & \displaystyle\end{eqnarray}$$
and inverse Stokes numbers
 $$\begin{eqnarray}\displaystyle St=\frac{\unicode[STIX]{x1D707}_{g}}{\unicode[STIX]{x1D70C}_{\ell }R_{b}V}=1.9\times 10^{-6}{-}4.2\times 10^{-5}. & & \displaystyle\end{eqnarray}$$
The capillary number based on the gas properties will also be used
 $$\begin{eqnarray}\displaystyle Ca_{g}=\frac{\unicode[STIX]{x1D707}_{g}V}{\unicode[STIX]{x1D70E}}=2.9\times 10^{-4}{-}4.4\times 10^{-3}, & & \displaystyle\end{eqnarray}$$
whereas based on the liquid properties,
 $Ca_{\ell }=0.57{-}2.8\times 10^{6}$
. The ratio of gas to drop viscosities is varied over a wide range
 $$\begin{eqnarray}\displaystyle \frac{\unicode[STIX]{x1D707}_{g}}{\unicode[STIX]{x1D707}_{\ell }}=9.5\times 10^{-10}{-}2.0\times 10^{-3}. & & \displaystyle\end{eqnarray}$$
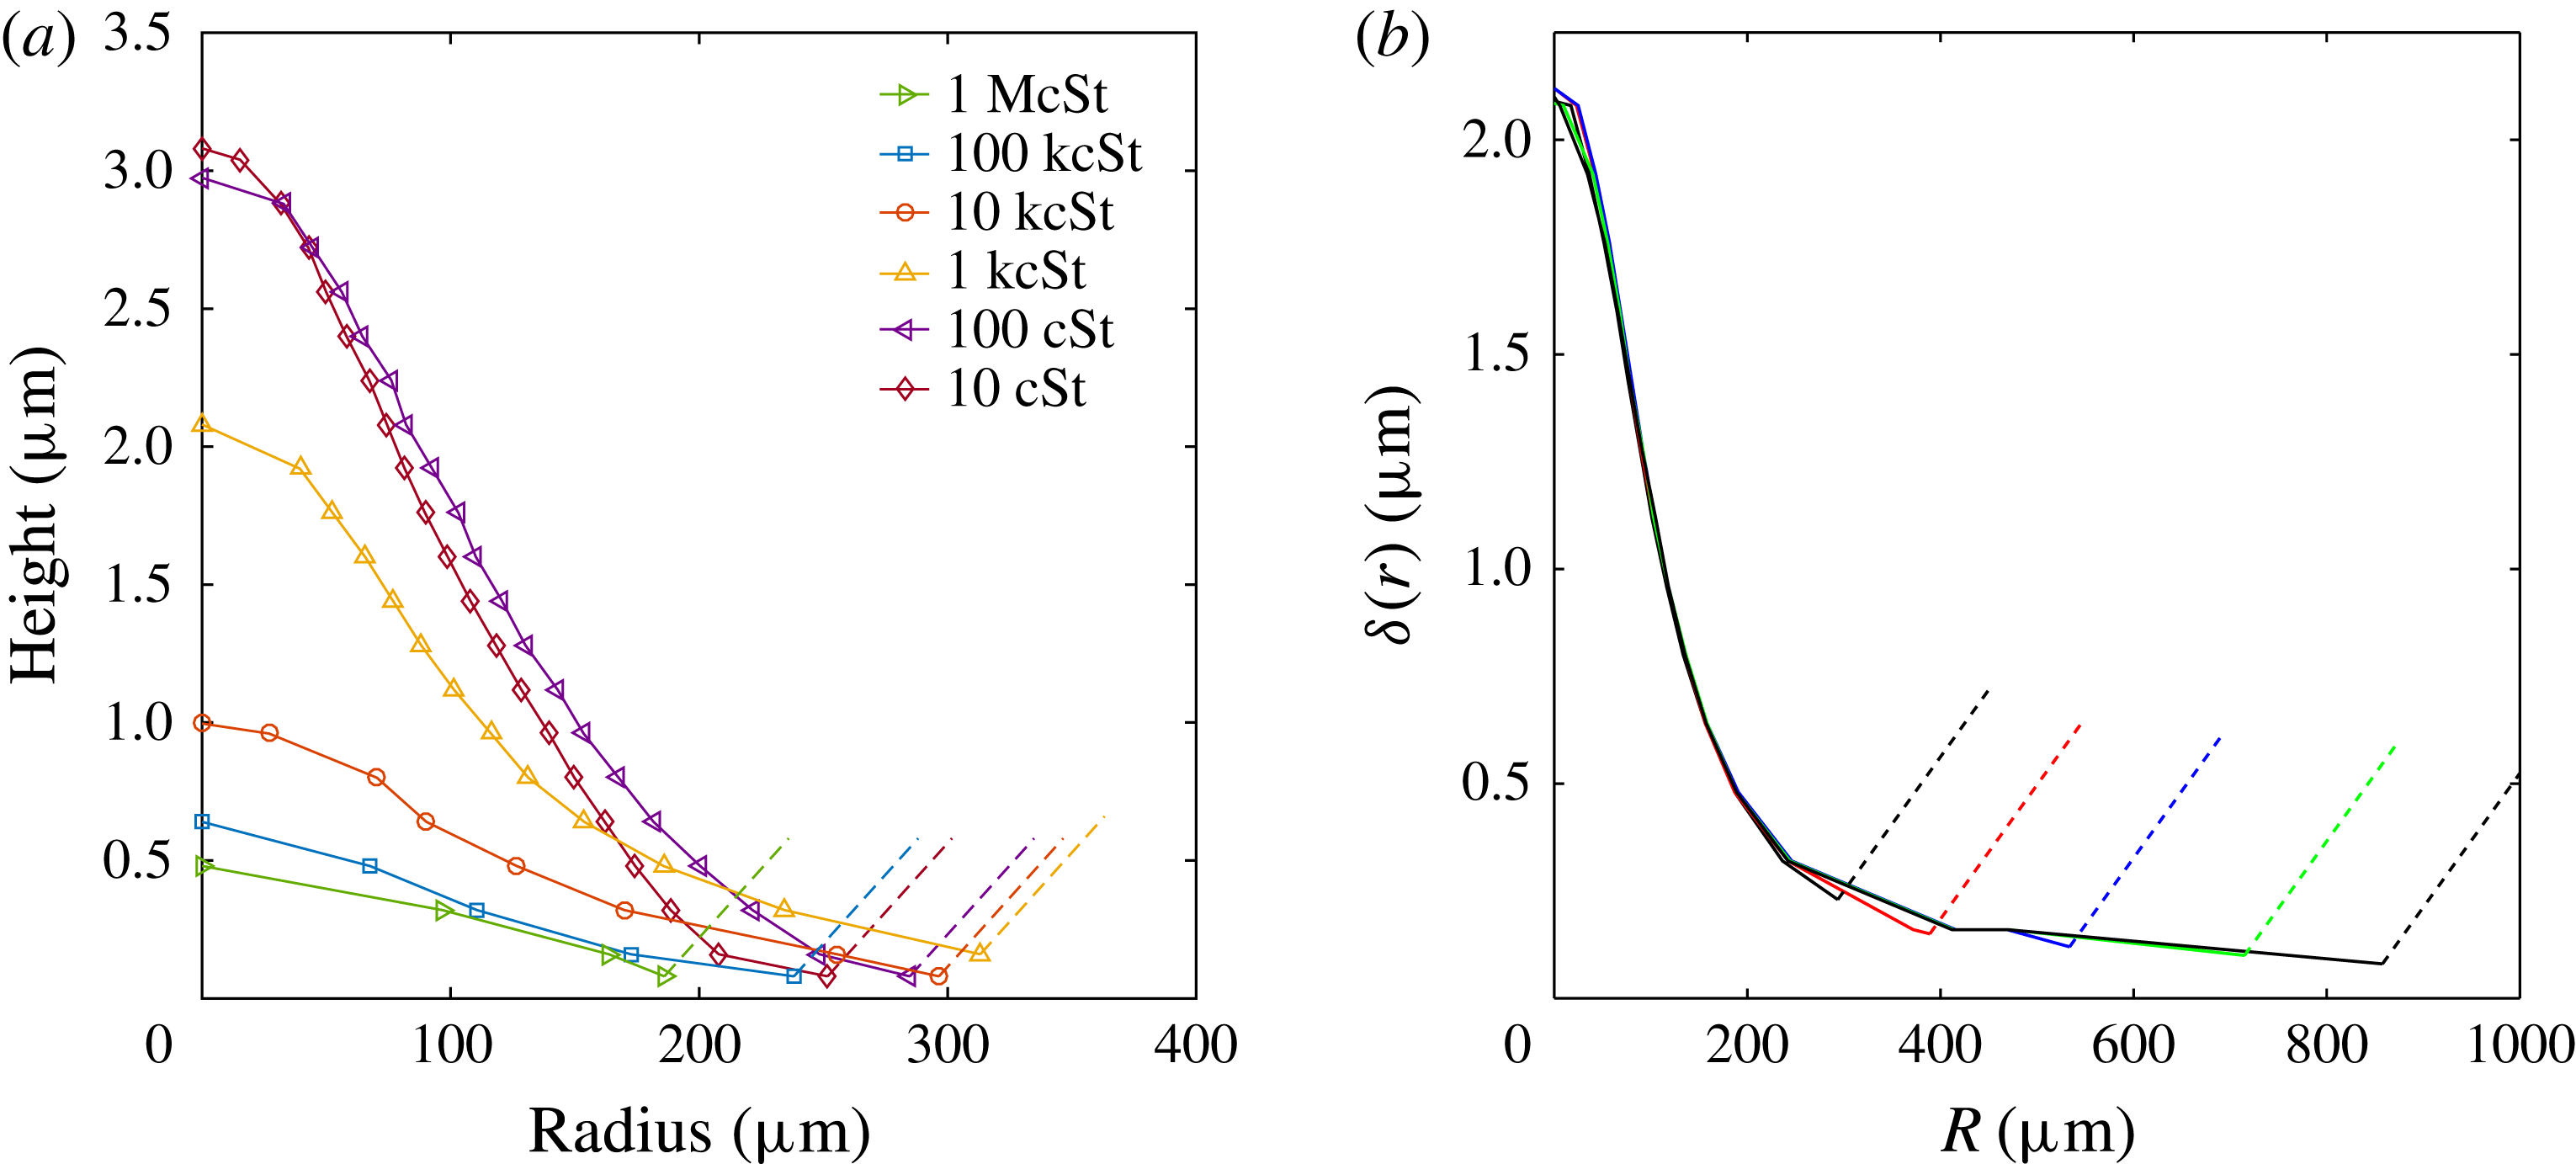
(a) Change in dimple profiles versus drop viscosity, with similar impact velocities: 1.20, 1.16, 1.09, 0.81, 1.4 and
 $0.65~\text{m}~\text{s}^{-1}$
from 10 cSt to 1 million cSt. (b) Time evolution of a typical air-film gliding profile, for 1000 cSt drop of
 $R_{b}=1.88$
mm, impacting at
 $1.09~\text{m}~\text{s}^{-1}$
. Profiles shown at
 $t\simeq 22$
, 40, 78, 148 and
 $218~\unicode[STIX]{x03BC}\text{s}$
from start of deformations. The dashed lines, in both panels, indicate qualitatively the shape of the drop outside the deformed region, where the fringes are too close to separate in the imaging.

3 Results
3.1 Dimple formation
Figure 3 shows the two-colour interferometry and the shapes of the air dimple and extended air film entrapped under the impacting viscous drops. Figure 4 shows similar images for the monochrome video camera, over a range of drop viscosities.
Figure 4(a) shows typical interference fringes as
 $\unicode[STIX]{x1D708}_{\ell }$
is increased. Note the overall trend of fewer fringes with higher
 $\unicode[STIX]{x1D708}_{\ell }$
, as is clear from the reduction in the centreline thickness
 $H_{c}$
in figure 6(b). The corresponding dimple profiles are shown in figure 5(a). The gliding region also becomes more extended at larger
 $\unicode[STIX]{x1D708}_{\ell }$
, see figures 1(b,c) and 3.
For impacts of low-viscosity drops the lubricating air layer ruptures along a ring to entrap an air disc, which rapidly contracts into a bubble (Thoroddsen et al.
Reference Thoroddsen, Etoh, Takehara, Ootsuka and Hatsuki2005). This disc was characterized by its initial radius
 $L_{o}$
and thickness at the centreline
 $H^{\ast }$
at first contact. On the other hand, herein for the impacts of viscous drops, the outer edge of the air disc glides on the thin film of air, without immediate contact with the solid. To characterize the size of these air discs, we therefore measure
 $L_{o}$
and
 $H_{c}$
when we see this outer thin film emerge. As is seen in figure 5(b), the central dimple is frozen in shape during this gliding.
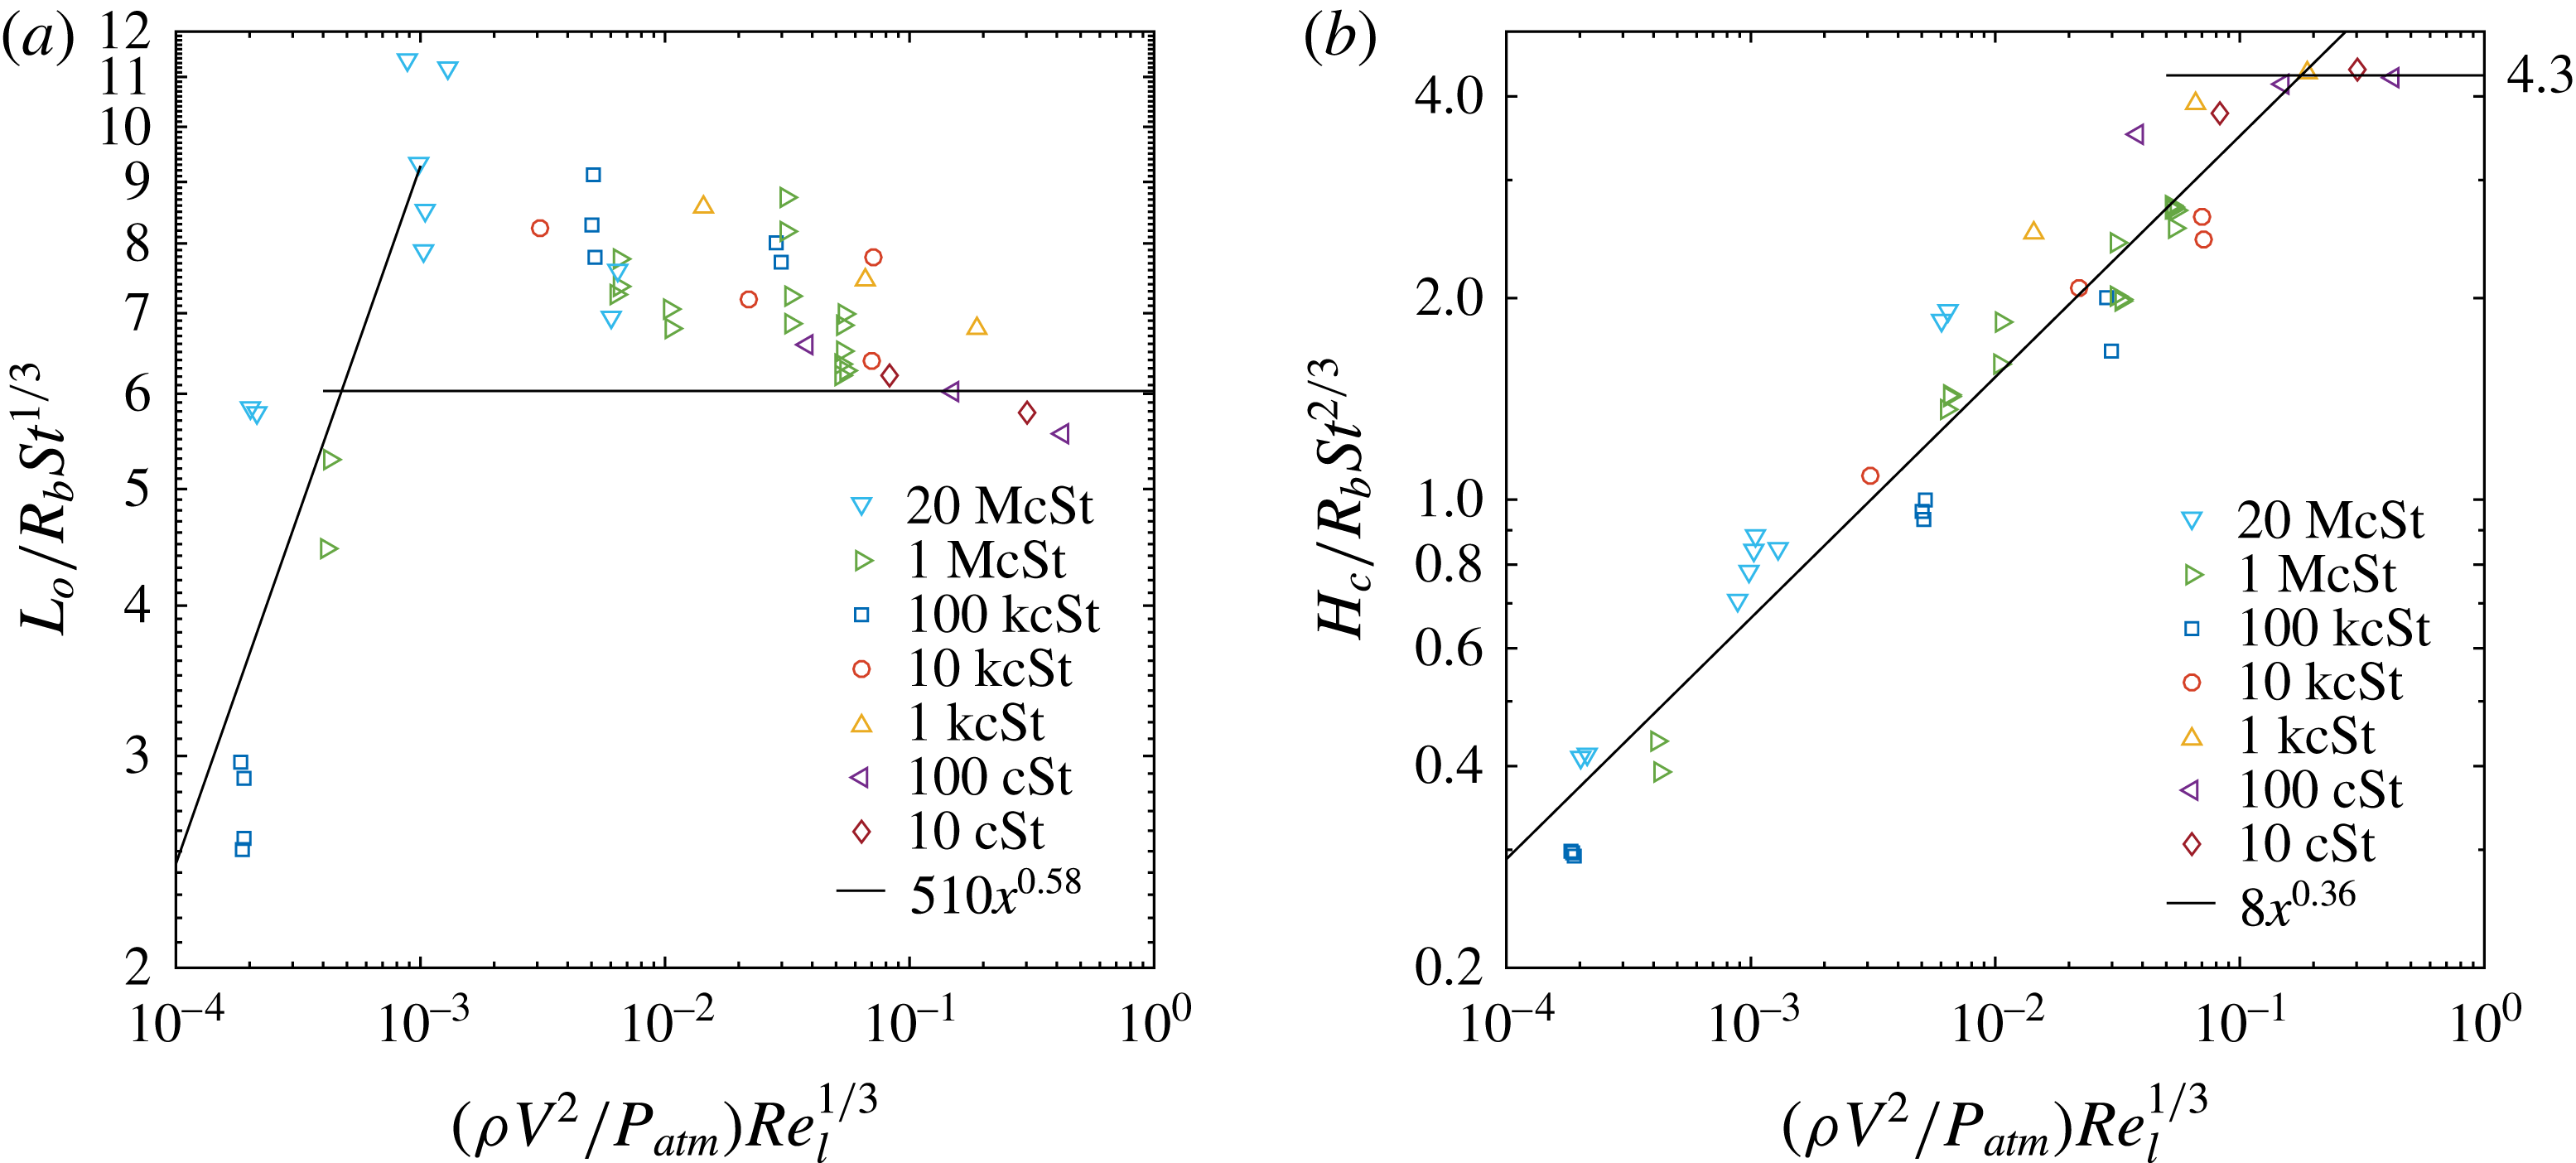
In figure 6(a,b) we find empirically that both of these quantities scale with an impact parameter (IP) which combines two factors, a ratio of the dynamic pressure relative to the atmospheric pressure and a power-law dependence on the liquid Reynolds number as
 $$\begin{eqnarray}\displaystyle IP=\frac{\unicode[STIX]{x1D70C}V^{2}}{P_{atm}}Re_{\ell }^{1/3}. & & \displaystyle\end{eqnarray}$$
This combination of physical parameters includes the impact velocity and drop density, whereas the gas viscosity is absent. Gas viscosity remains however in the Stokes number on the ordinates, in the figure.
It is interesting to note that this quantity IP in (3.1) can also be expressed as the compression factor
 $\unicode[STIX]{x1D716}^{-1}$
(Mandre et al.
Reference Mandre, Mani and Brenner2009) times the viscosity ratio between air and liquid
 $IP=\unicode[STIX]{x1D716}^{-1}(\unicode[STIX]{x1D707}_{g}/\unicode[STIX]{x1D707}_{l})^{1/3}$
, where
 $\unicode[STIX]{x1D716}^{-1}$
is defined in (1.2). However, we choose not to use this version herein, as we are not studying the earliest compression of the gas under the drop, which occurs for the largest impact velocities.
As expected, figure 6(a) shows that the disc size
 $L_{o}$
deviates from the inviscid prediction of Hicks et al. (Reference Hicks, Ermanyuk, Gavrilov and Purvis2012), but in non-trivial ways. As
 $\unicode[STIX]{x1D707}_{l}$
increases
 $L_{o}$
first grows larger than for the inviscid case, but at extreme drop viscosities the trend in
 $L_{o}$
reverses and it becomes much smaller.
The centreline air-layer thickness
 $H_{c}$
reduces monotonically with increased drop viscosity, but with a weak dependence, i.e.
 $H_{c}\sim \unicode[STIX]{x1D707}_{l}^{-1/9}$
. For the largest
 $\unicode[STIX]{x1D707}_{l}$
(left-hand side in figure 6
b) the normalized
 $H_{c}$
values become 14 times smaller than the horizontal inviscid asymptote at the right-hand side of the figure.
(a) The initial radius
 $L_{o}$
of the central air disc and (b) the air-layer thickness at the centreline
 $H_{c}$
, both measured when the gliding film begins. The impacts are on a microscope glass (Corning). For reference the horizontal line in (a) corresponds to the prediction of Hicks et al. (Reference Hicks, Ermanyuk, Gavrilov and Purvis2012) for inviscid drops, which is not expected to fit here, for large-viscosity drops. The horizontal line in (b) is the inviscid asymptote for low values of
 $\unicode[STIX]{x1D716}^{-1}$
in Li & Thoroddsen (Reference Li and Thoroddsen2015).

Keep in mind that for larger values of the abscissa,
 $H^{\ast }$
reduces again, with an opposite sign power law with
 $H^{\ast }/(R_{b}St)\sim (\unicode[STIX]{x1D716}^{-1})^{-0.4}$
due to compressibility, see Li & Thoroddsen (Reference Li and Thoroddsen2015), their figure 6. Herein we ignore any compression of the gas, which occurs on much shorter time scales than the formation of the gliding film and the frozen dimple shape.
3.2 Gliding on a thin air film
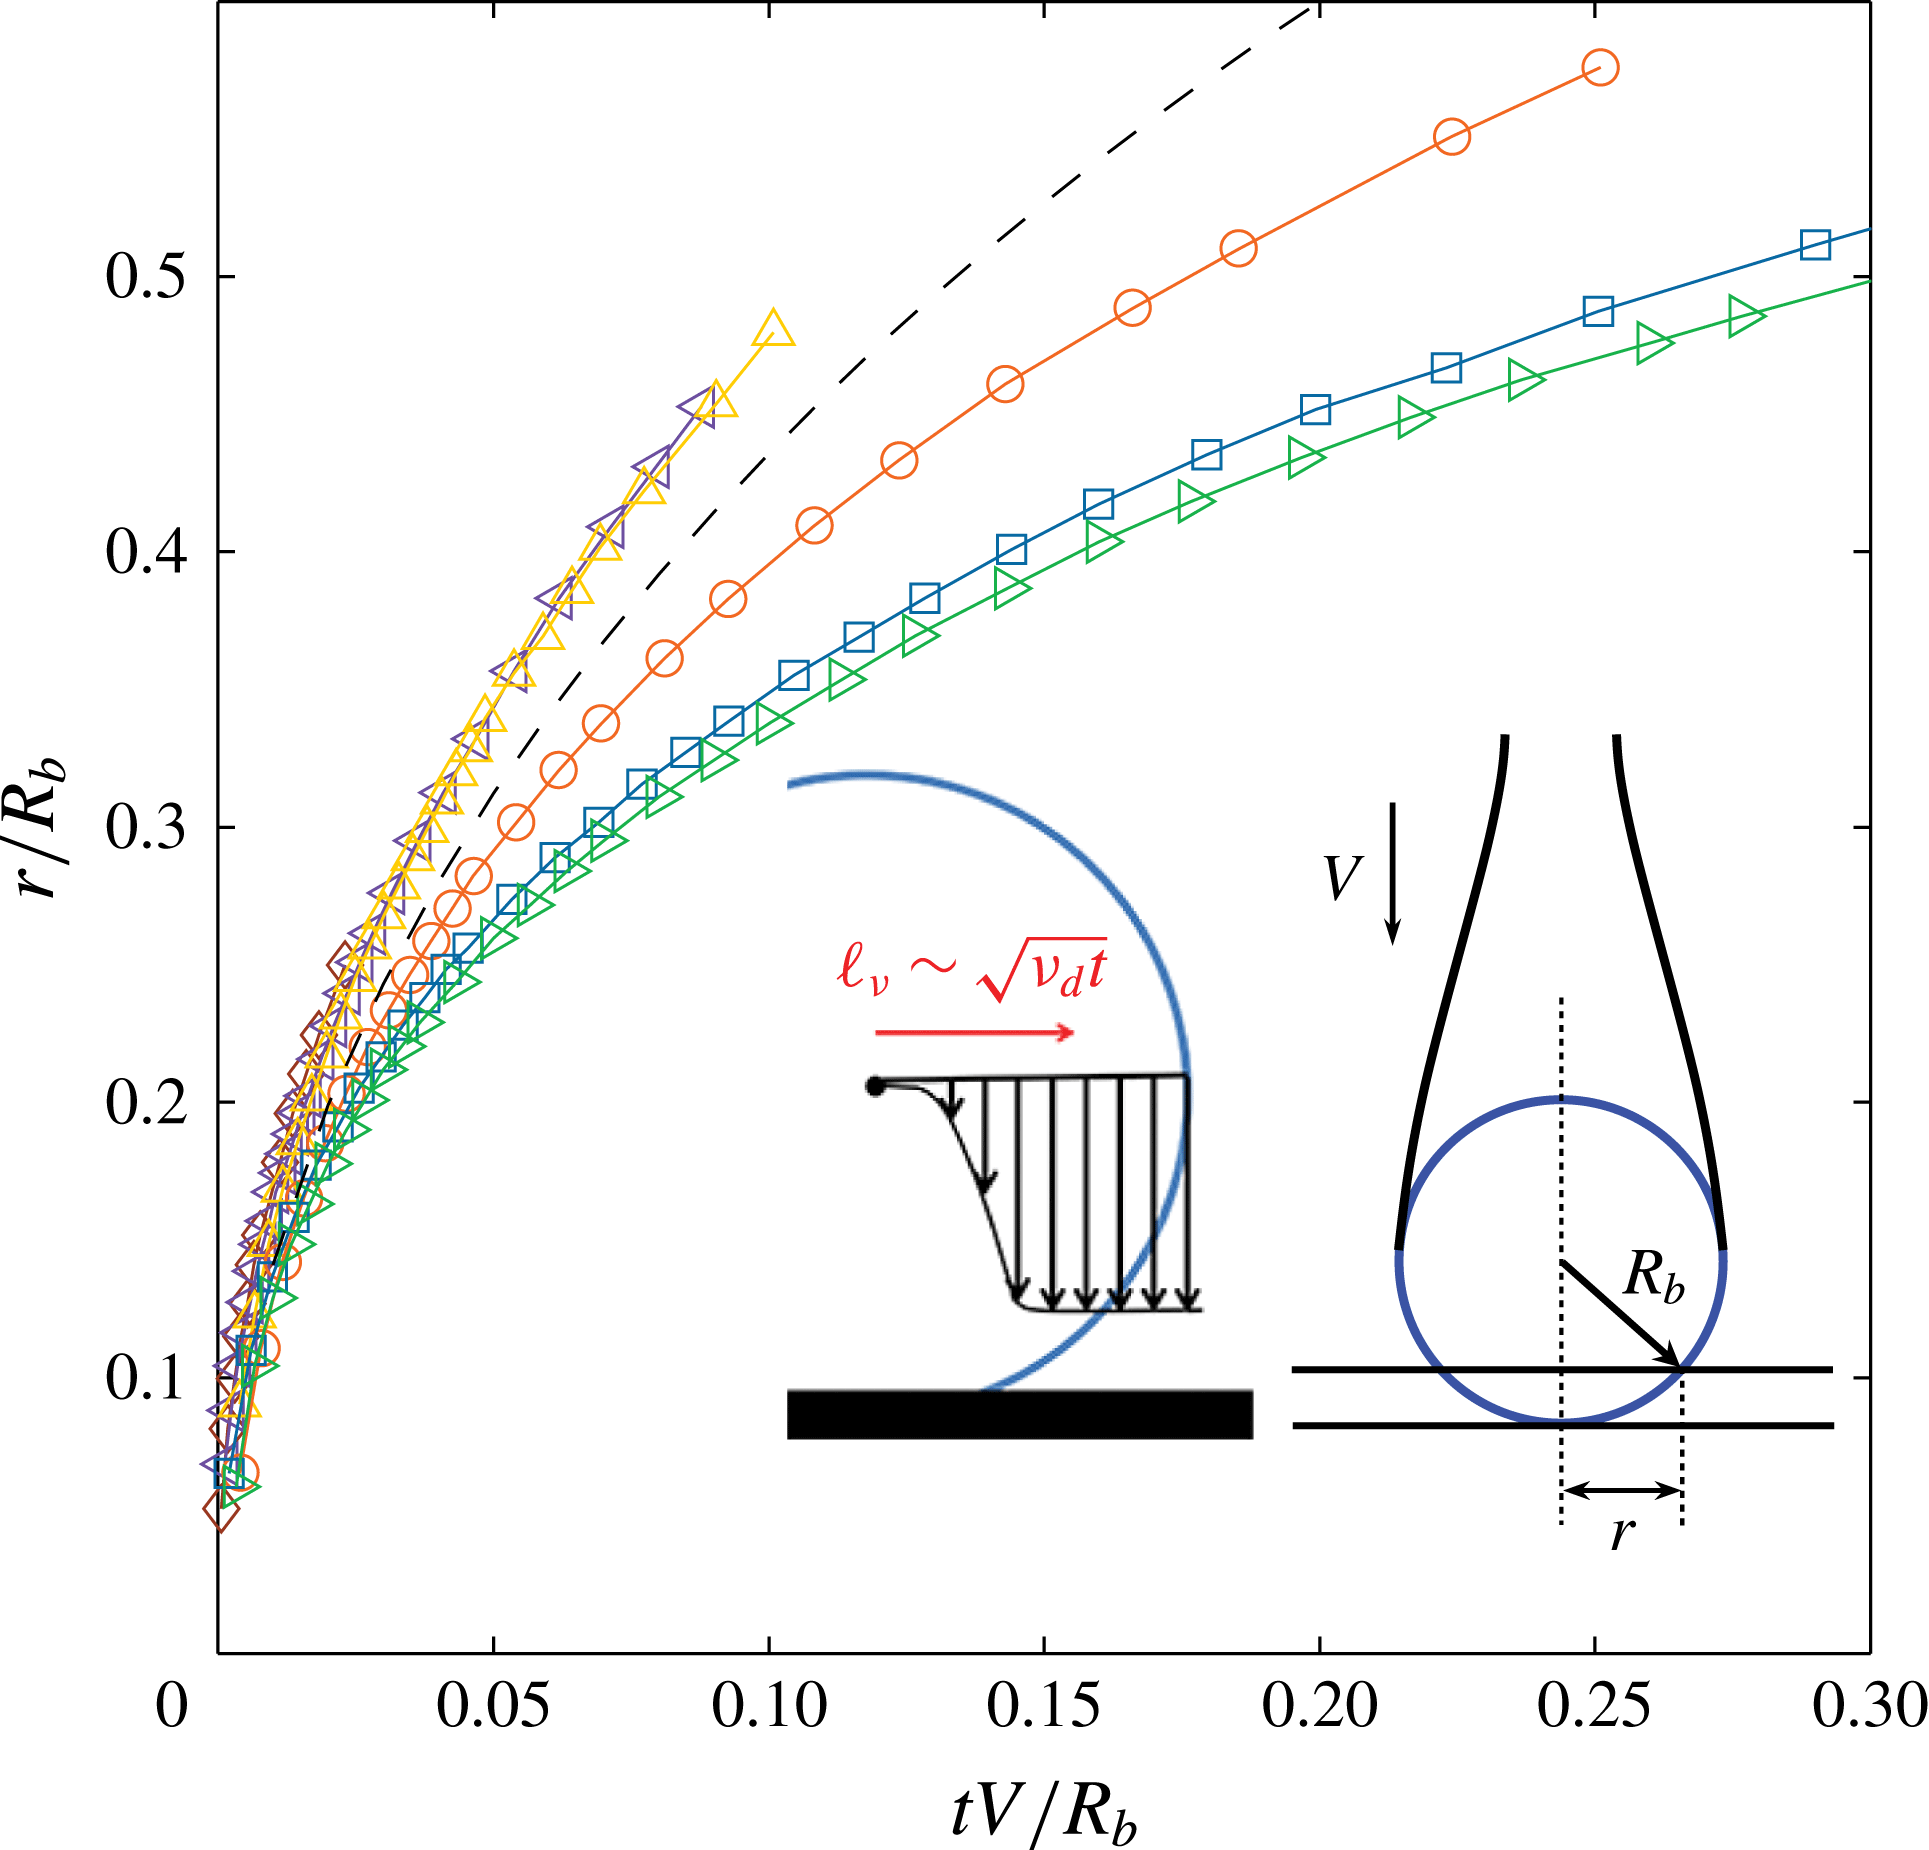
Figures 3(c) and 5(b) show how the thin air layer extends radially under the drop, while the dimple shape is frozen. In figure 7 we track the motion of the outer edge of the contact/gliding layer and compare it to the simple geometric model in the inset, where each fluid element inside the drop moves unhindered in the vertical direction until it meets the solid. This predicts radial location with time
 $$\begin{eqnarray}\displaystyle r/R_{b}=\sqrt{2\unicode[STIX]{x1D70F}-\unicode[STIX]{x1D70F}^{2}}, & & \displaystyle\end{eqnarray}$$
where
 $\unicode[STIX]{x1D70F}=tV/R_{b}$
is the dimensionless impact time. This relation is marked by the dashed curve in figure 7. For viscosities up to 1000 cSt the curves collapse slightly above the
 $t^{1/2}$
model profile, while for
 $\unicode[STIX]{x1D708}_{\ell }$
over
 ${\sim}5000$
cSt there is clear slowing of the outer edge of the gliding area due to viscous stresses within the drop. The curve for 10 000 cSt shows strong slowing of the outer edge, evident from the curve falling below the
 $t^{1/2}$
line. The high viscosity also freezes the shape of the dimple and it does not expand and contract as was observed in the low-viscosity water cases for the high values of
 $\unicode[STIX]{x1D716}^{-1}$
(Li & Thoroddsen Reference Li and Thoroddsen2015). We can estimate the strength of these viscous effects by a viscous length scale within the drop
 $\ell _{\unicode[STIX]{x1D708}}\sim \sqrt{\unicode[STIX]{x1D708}_{d}t}$
to see whether this is of comparable size to the radius of the outer edge of the gliding region (see inset in figure 7). Conceptually, we are looking at how quickly the viscous stress within the drop transmits sideways, in the radial direction, the information that the centre of the drop has encountered the wall and stopped moving. Both of these length scales grow at approximately
 $t^{1/2}$
and when they are equal we could estimate a prefactor. For example, in figure 3(c) the outer edge of the thin film for the
 $\unicode[STIX]{x1D708}_{d}=10\,000$
cSt, is at approximately
 $500~\unicode[STIX]{x03BC}\text{m}$
after
 $250~\unicode[STIX]{x03BC}\text{s}$
, but this has been overtaken by the viscous scale
 $\ell _{\unicode[STIX]{x1D708}}\simeq \sqrt{10^{-2}\times 250\times 10^{-6}}=1580~\unicode[STIX]{x03BC}\text{m}$
.
Radial motion of the outer edge of the thin film versus normalized impact time. The dashed line is from the simple geometric model from the text, see right inset and (3.2). From top to bottom
 $\unicode[STIX]{x1D708}_{\ell }=10$
, 100, 1 k, 10 k, 100 k, 1 McSt, while
 $V\sim 1~\text{m}~\text{s}^{-1}$
. The left inset shows the simple model of propagation of viscous effects in the radial direction.

For the data in figure 7,
 $V\sim 1~\text{m}~\text{s}^{-1}$
and
 $R_{b}\sim 2$
mm and equating
 $\ell _{\unicode[STIX]{x1D708}}$
to the expression (3.2) suggests
 $Re_{\ell }\simeq 2$
, when drop viscosity starts interfering with the radial motion of the outer edge. Therefore,
 $\unicode[STIX]{x1D708}_{\ell }\sim 2VR_{b}=4\times 10^{-3}~\text{m}^{2}~\text{s}^{-1}$
which is approximately 4000 cSt, in quantitative agreement with the above arguments.
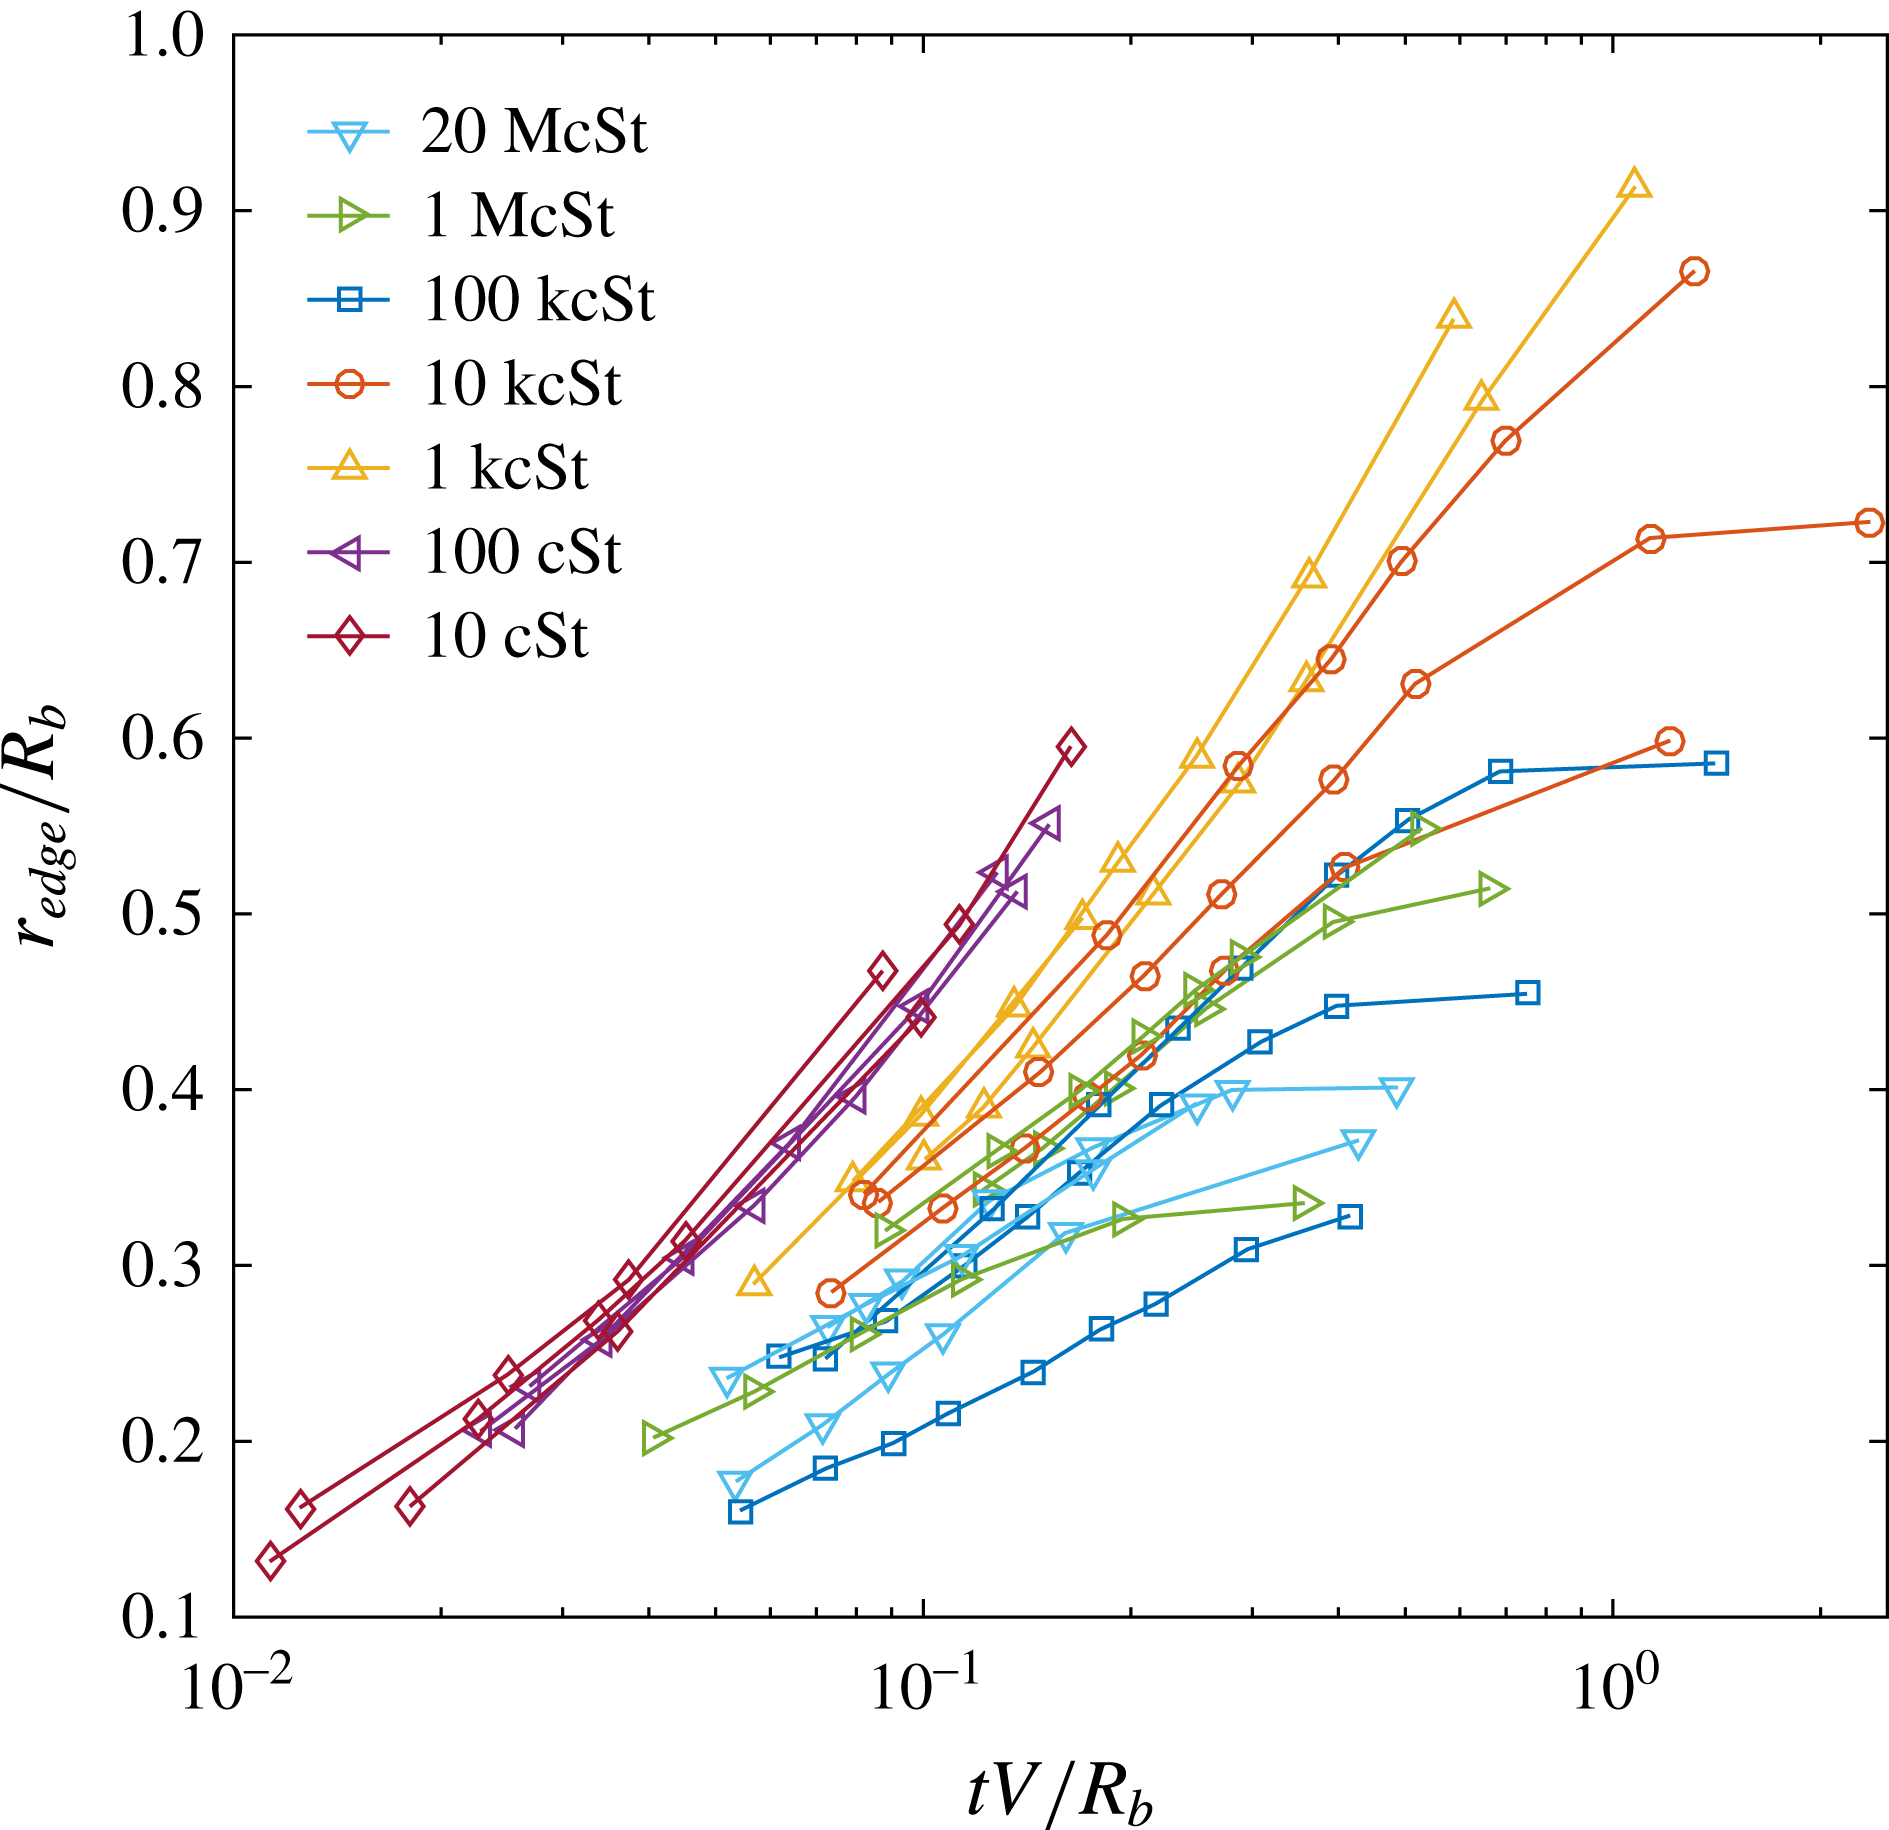
How wide can the gliding air layer become before it is fully wetted? Figure 8 shows this evolution at later times than in figure 7. The maxima
 $r_{edge}/R_{b}$
occurs for intermediate viscosities,
 $\unicode[STIX]{x1D708}_{\ell }$
between 1000–10 000 cSt. Here the edge reaches 90 % of the drop size after one normalized time unit.
The outer radius of the extended thin film versus normalized impact time. Multiple lines for each viscosity are shown representing disparate impact velocities.

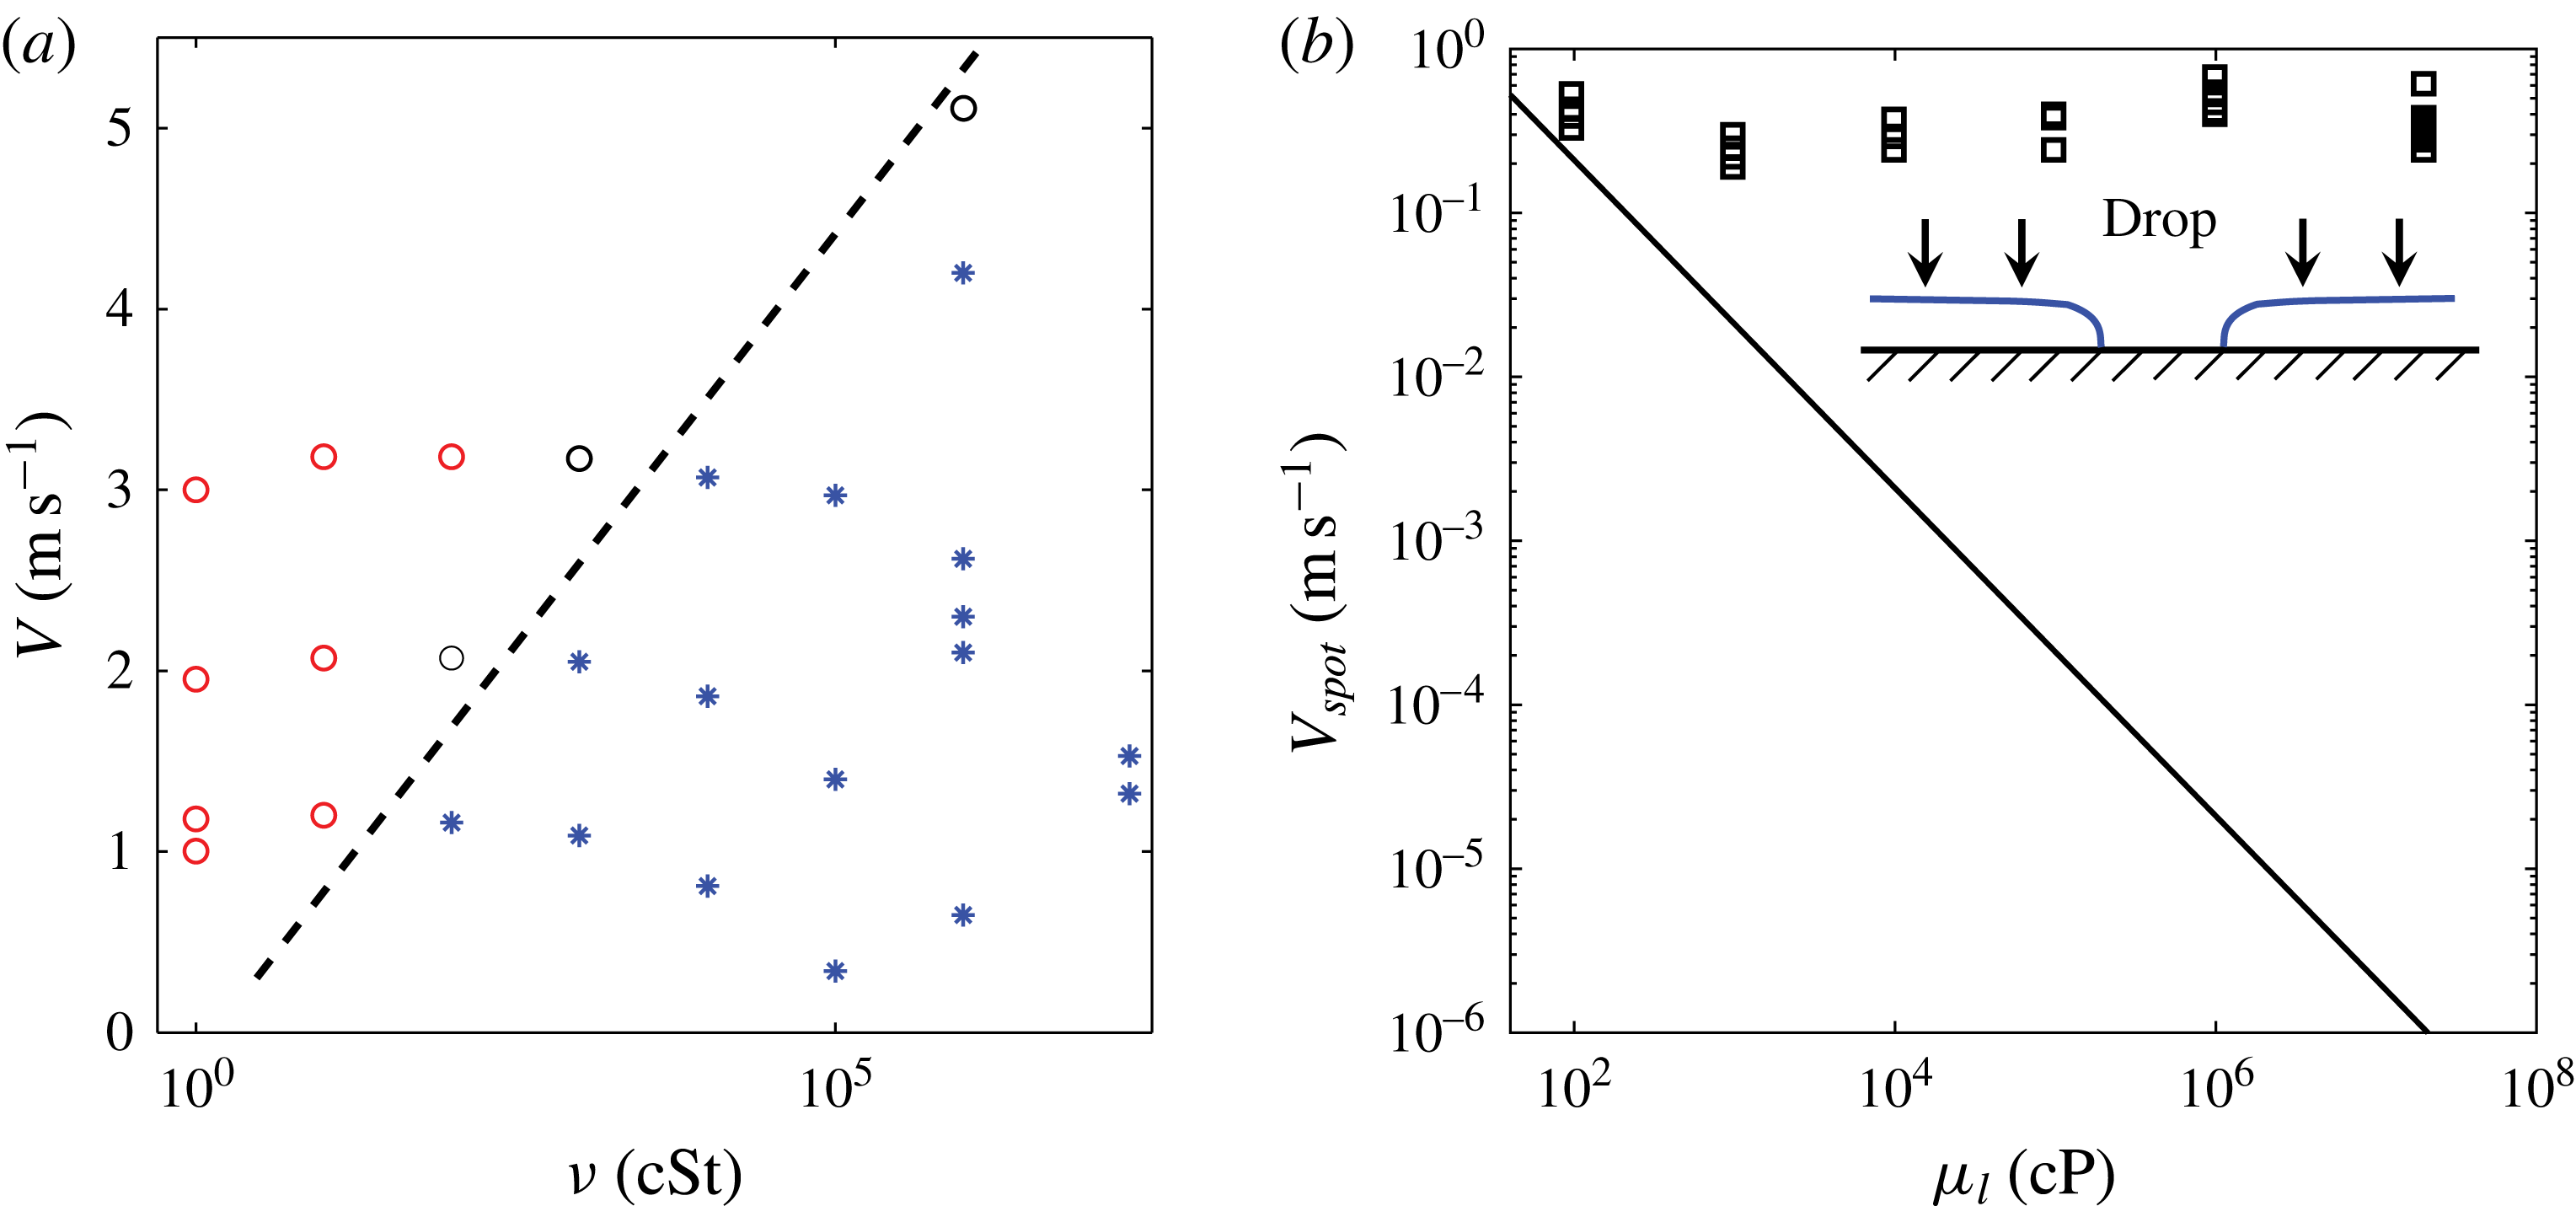
In figure 10(a) we map the parameter region where gliding occurs. More detailed study is needed to pin down this boundary.
3.3 Film rupture and extreme wetting
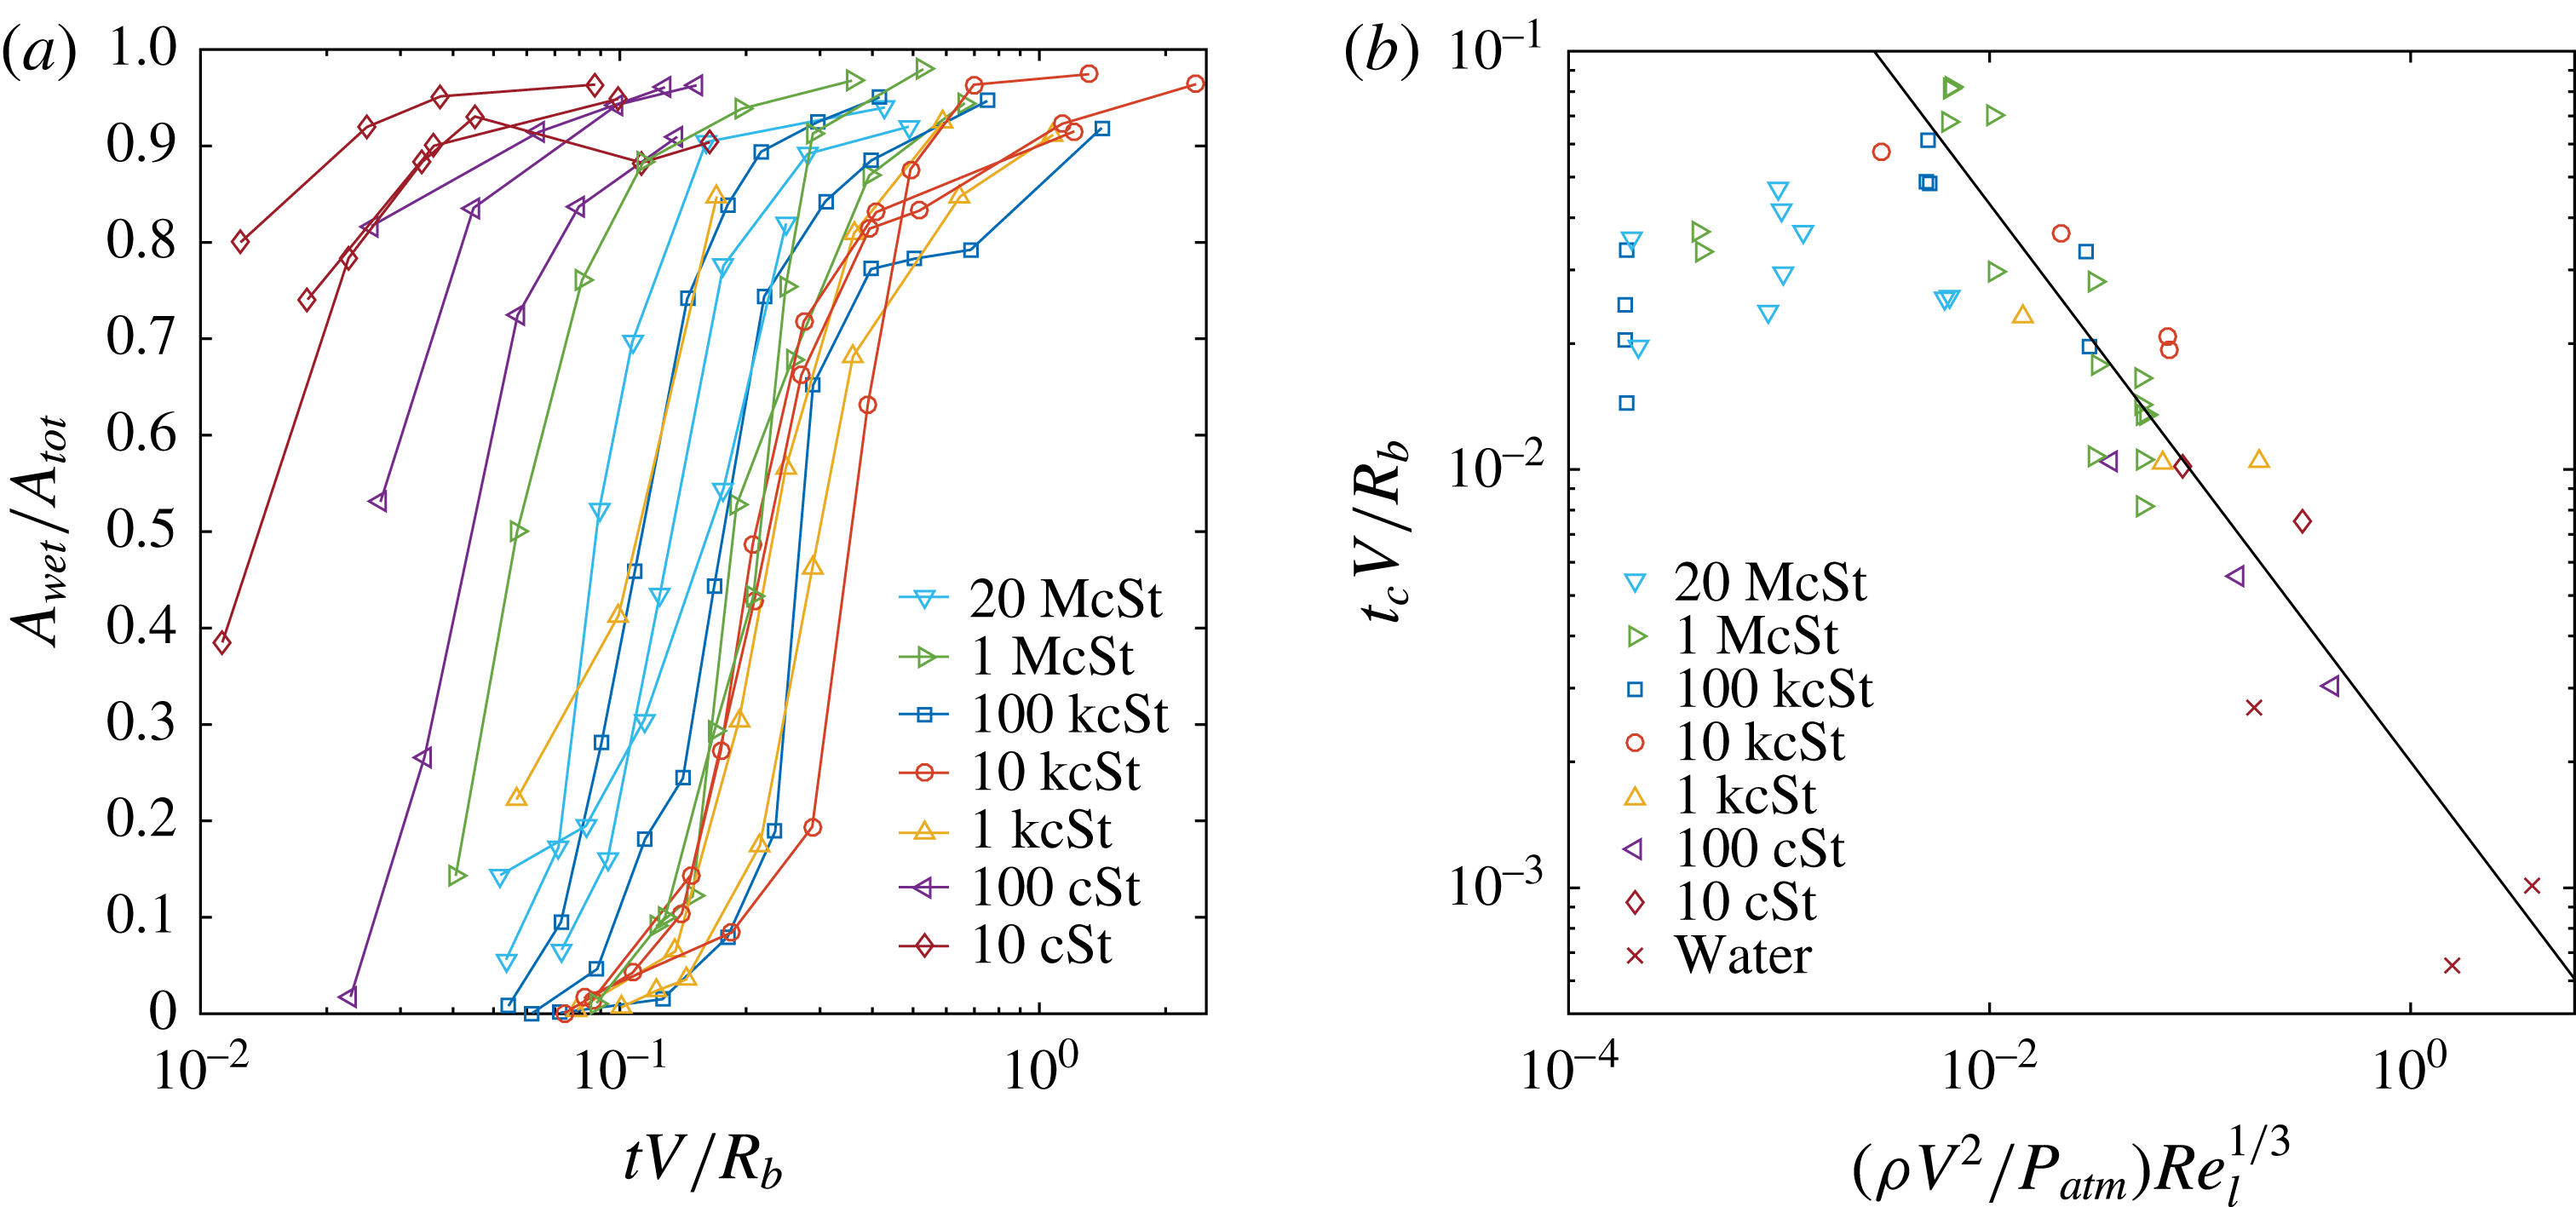
As shown above, the extended thin air film for viscous drops delays the wetting contact with the solid, as compared to the inviscid case where the kink in the free surface forms a repeatable contact along a ring around the central air disc, notwithstanding the finer details of this contact, studied by Li et al. (Reference Li, Vakarelski and Thoroddsen2015). The extended film subsequently breaks by random contacts with the substrate, as was shown in figures 1, 3 and 4. The timing of the first rupture of the air film is uncertain, as it can occur close to the thicker section of the film, near the central dimple, as occurred for example in figure 3(c). This measure is therefore prone to the presence of random asperities or dust. It is therefore instructive to look at how the wetting fraction of all the spots in the film evolves with time. This is done in figure 9(a) for a range of drop viscosities, while keeping the impact velocity around
 $1~\text{m}~\text{s}^{-1}$
. The curves have a characteristic shape with the most rapid growth in the wetting fraction when approximately half the film is wetted. This suggests this increase is due to the appearance of new wetting spots, rather than spreading of a few isolated ones. Increasing viscosity shifts these curves to larger times, until approximately 10 000 cSt, with the largest viscosities wetting slightly faster. This is consistent with the longest extent of the thin films shown in figure 8. At the largest viscosities the reduced total extent of the film comes into play in non-trivial ways.
In figure 9(b) we plot the time of the first wetting contact versus the impact parameter introduced in (3.1). The wetting occurs faster for increasing impact Reynolds number, with a maximum film lifetime observed at
 $(\unicode[STIX]{x1D70C}V^{2}/P_{atm})Re_{\ell }^{1/3}\simeq 0.008$
. This is followed by a slight reduction at lowest values of this parameter, corresponding to the largest
 $\unicode[STIX]{x1D708}_{\ell }$
and low
 $V$
. The figure includes some water cases, taken from Li & Thoroddsen (Reference Li and Thoroddsen2015), where the surface kink makes rapid contact with the solid. The observed range of normalized lifetimes varies by a factor of approximately 120.
For large impact factors the data for film lifetime fit a power law with an exponent of
 $-2/3$
, drawn in the figure.
(a) The wetting fraction of the gliding film versus the normalized impact time. Multiple lines for each viscosity are shown representing disparate impact velocities. (b) Time of first rupture of the film versus the impact parameter. The solid line has a slope of
 $-2/3$
to guide the eye.

We have also looked at the wetting speed of individual ruptures. The arrows in figure 4(c) point out two such local contacts, for the largest-viscosity case, which grow at approximately the same rate. The initial velocity of the contact line is here orders of magnitude higher than the anticipated capillary viscous velocity
 $u_{\unicode[STIX]{x1D70E}\unicode[STIX]{x1D707}}\simeq \unicode[STIX]{x1D70E}/\unicode[STIX]{x1D707}$
. Figure 10(b) shows the measured contact line velocities versus liquid viscosity where the local contacts were observed. The measurements were taken for several impact velocities for each viscosity and at several locations within the gliding air film. Surprisingly, the velocity of the spot contact line appears to be independent of viscosity, impact velocity and the bottom radius of the drop. Across all cases measured, the contact line velocity fell in the range of
 $0.25{-}0.60~\text{m}~\text{s}^{-1}$
. For the most viscous case, this is five orders of magnitude larger than the anticipated velocity, marked by the solid line in the figure. We call this extreme wetting and it is further discussed in § 4.3.
(a) Region of parameter space where gliding occurs (*). Open red circles indicate circular contacts, whereas open black circles indicate a transition between the two states. (b) Contact line velocity of the localized wetting spots versus liquid viscosity. The measured velocities for the localized contacts are much higher than the anticipated value of
 $\unicode[STIX]{x1D70E}/\unicode[STIX]{x1D707}_{l}$
(solid line), appearing to be independent of liquid viscosity, impact velocity and drop radius.

4 Discussion and conclusions
4.1 Dimple formation and gliding film
Herein, we have used two-colour and high-speed interferometry to map the properties of the air layer caught under highly viscous drops impacting onto a dry glass surface. We show formation of a central dimple bounded by a gliding thin air layer. The central dimple height
 $H_{c}$
thins with increasing
 $\unicode[STIX]{x1D708}_{\ell }$
, while its shape stays, in each case, approximately frozen during the film formation and rupture.
One can wonder whether significant air flow is expected from the central dimple out through the very thin channel, with no-slip boundaries on both sides. This flow rate can be found by balancing a radial pressure gradient
 $\text{d}p/\text{d}r$
with viscous stress in the air layer of thickness
 $\unicode[STIX]{x1D6FF}$
. For reference we can look at the film in figure 3(c). Here the width of the thin air layer grows to approximately
 $500~\unicode[STIX]{x03BC}\text{m}$
radially, in approximately
 $300~\unicode[STIX]{x03BC}\text{s}$
. Following the earliest gas-compression phase the pressure can be expected to be fairly uniform within the film and as a very conservative estimate, we assume one atmosphere overpressure at the centre of the air disc, to drive the air out through the film. For
 $\unicode[STIX]{x1D6FF}\sim 100$
nm, this gives
 $u_{air}=-(\text{d}p/\text{d}r)\times (\unicode[STIX]{x1D6FF}/2)^{2}/(2\unicode[STIX]{x1D707}_{air})\simeq 0.025~\text{m}~\text{s}^{-1}$
, which is quite slow on the time scales involved. In fact during this time interval,
 $\text{d}t=300~\unicode[STIX]{x03BC}\text{s}$
, this velocity will have shifted the air mass at the centre of the channel by
 $u_{air}\,\text{d}t\sim 10~\unicode[STIX]{x03BC}\text{m}$
, i.e. much slower than the radial motion of the outer edge of the thin layer. We conclude that the escape of air through the film is negligible, even if the slip in the rarefied gas would give 10 times higher
 $u_{air}$
. The air film is simply too thin. This is further supported by the frozen shape of the central dimple in figure 5(b).
Film skating was predicted by Mandre et al. (Reference Mandre, Mani and Brenner2009) for the impact of low-viscosity drops. In this theory the surface tension stabilizes the kink at the edge of the air disc. However, all experiments show that contact always occurs for modest impact velocities (Thoroddsen et al.
Reference Thoroddsen, Etoh, Takehara, Ootsuka and Hatsuki2005; Driscoll & Nagel Reference Driscoll and Nagel2011). The carefully controlled experiments of de Ruiter et al. (Reference de Ruiter, Lagraauw, van den Ende and Mugele2015) show that skating and rebounding is only possible if the impact Weber number
 $\unicode[STIX]{x1D70C}_{\ell }RV^{2}/\unicode[STIX]{x1D70E}<4$
, which for water corresponds to
 $0.48~\text{m}~\text{s}^{-1}$
. Herein we propose that drop viscosity can prevent the kink formation from touching the solid and make the outer edge glide on a thin air layer, which thins until rupture by other means. In our high-viscosity cases the surface tension is irrelevant and gliding is observed at high impact velocities, where
 $We$
can reach 2300. However, viscous dissipation would prevent any rebounding, even without the film ruptures. We use the word gliding to indicate a different mechanism from the skating though the underlying details remain to be determined. However, it is clear that the rapid radial velocity of the kink in the free surface for low-viscosity impacts (Mandre et al.
Reference Mandre, Mani and Brenner2009; Duchemin & Josserand Reference Duchemin and Josserand2011; Li & Thoroddsen Reference Li and Thoroddsen2015), is absent at large
 $\unicode[STIX]{x1D708}_{\ell }$
and the motion of the liquid surface is primarily vertical draping onto the surface.
4.2 Comparison with two approaching emulsion droplets
The approach and coalescence of emulsion droplets within an external flow is a heavily studied area of research, crucial for the coarsening of emulsions, with numerous industrial applications, from salad dressing to separation of water from crude oil. For recent references we highlight the work of Leal and coworkers (Baldessari, Homsy & Leal Reference Baldessari, Homsy and Leal2007; Kaur & Leal Reference Kaur and Leal2009; Frostad, Walter & Leal Reference Frostad, Walter and Leal2013). The main focus of these studies is on the deformation of the drops, the drainage of the intervening liquid film until it ruptures and initiates the capillary-driven coalescence. These emulsion dynamics are also governed by dimple formation at the closest approach of the two drops (Chan, Klaseboer & Manica Reference Chan, Klaseboer and Manica2011), even though they are often modelled by a uniform thickness layer.
Two obvious differences exist between these studies and the work herein. First, our viscosity ratio between continuous and disperse fluids is always smaller than 0.003 and becomes as minuscule as
 $10^{-9}$
, whereas for the emulsion work the viscosity ratio is of order unity. Secondly, the inverse impact Stokes number,
 $St$
, which is based on the air viscosity, is much smaller than in the above studies, i.e. inertia plays a crucial role in our film deformation. Despite these large differences, it is worth trying to compare the drop deformation in the two cases, as the Reynolds numbers based on the drop properties are both primarily in the viscous-dominated Stokes flow regime.
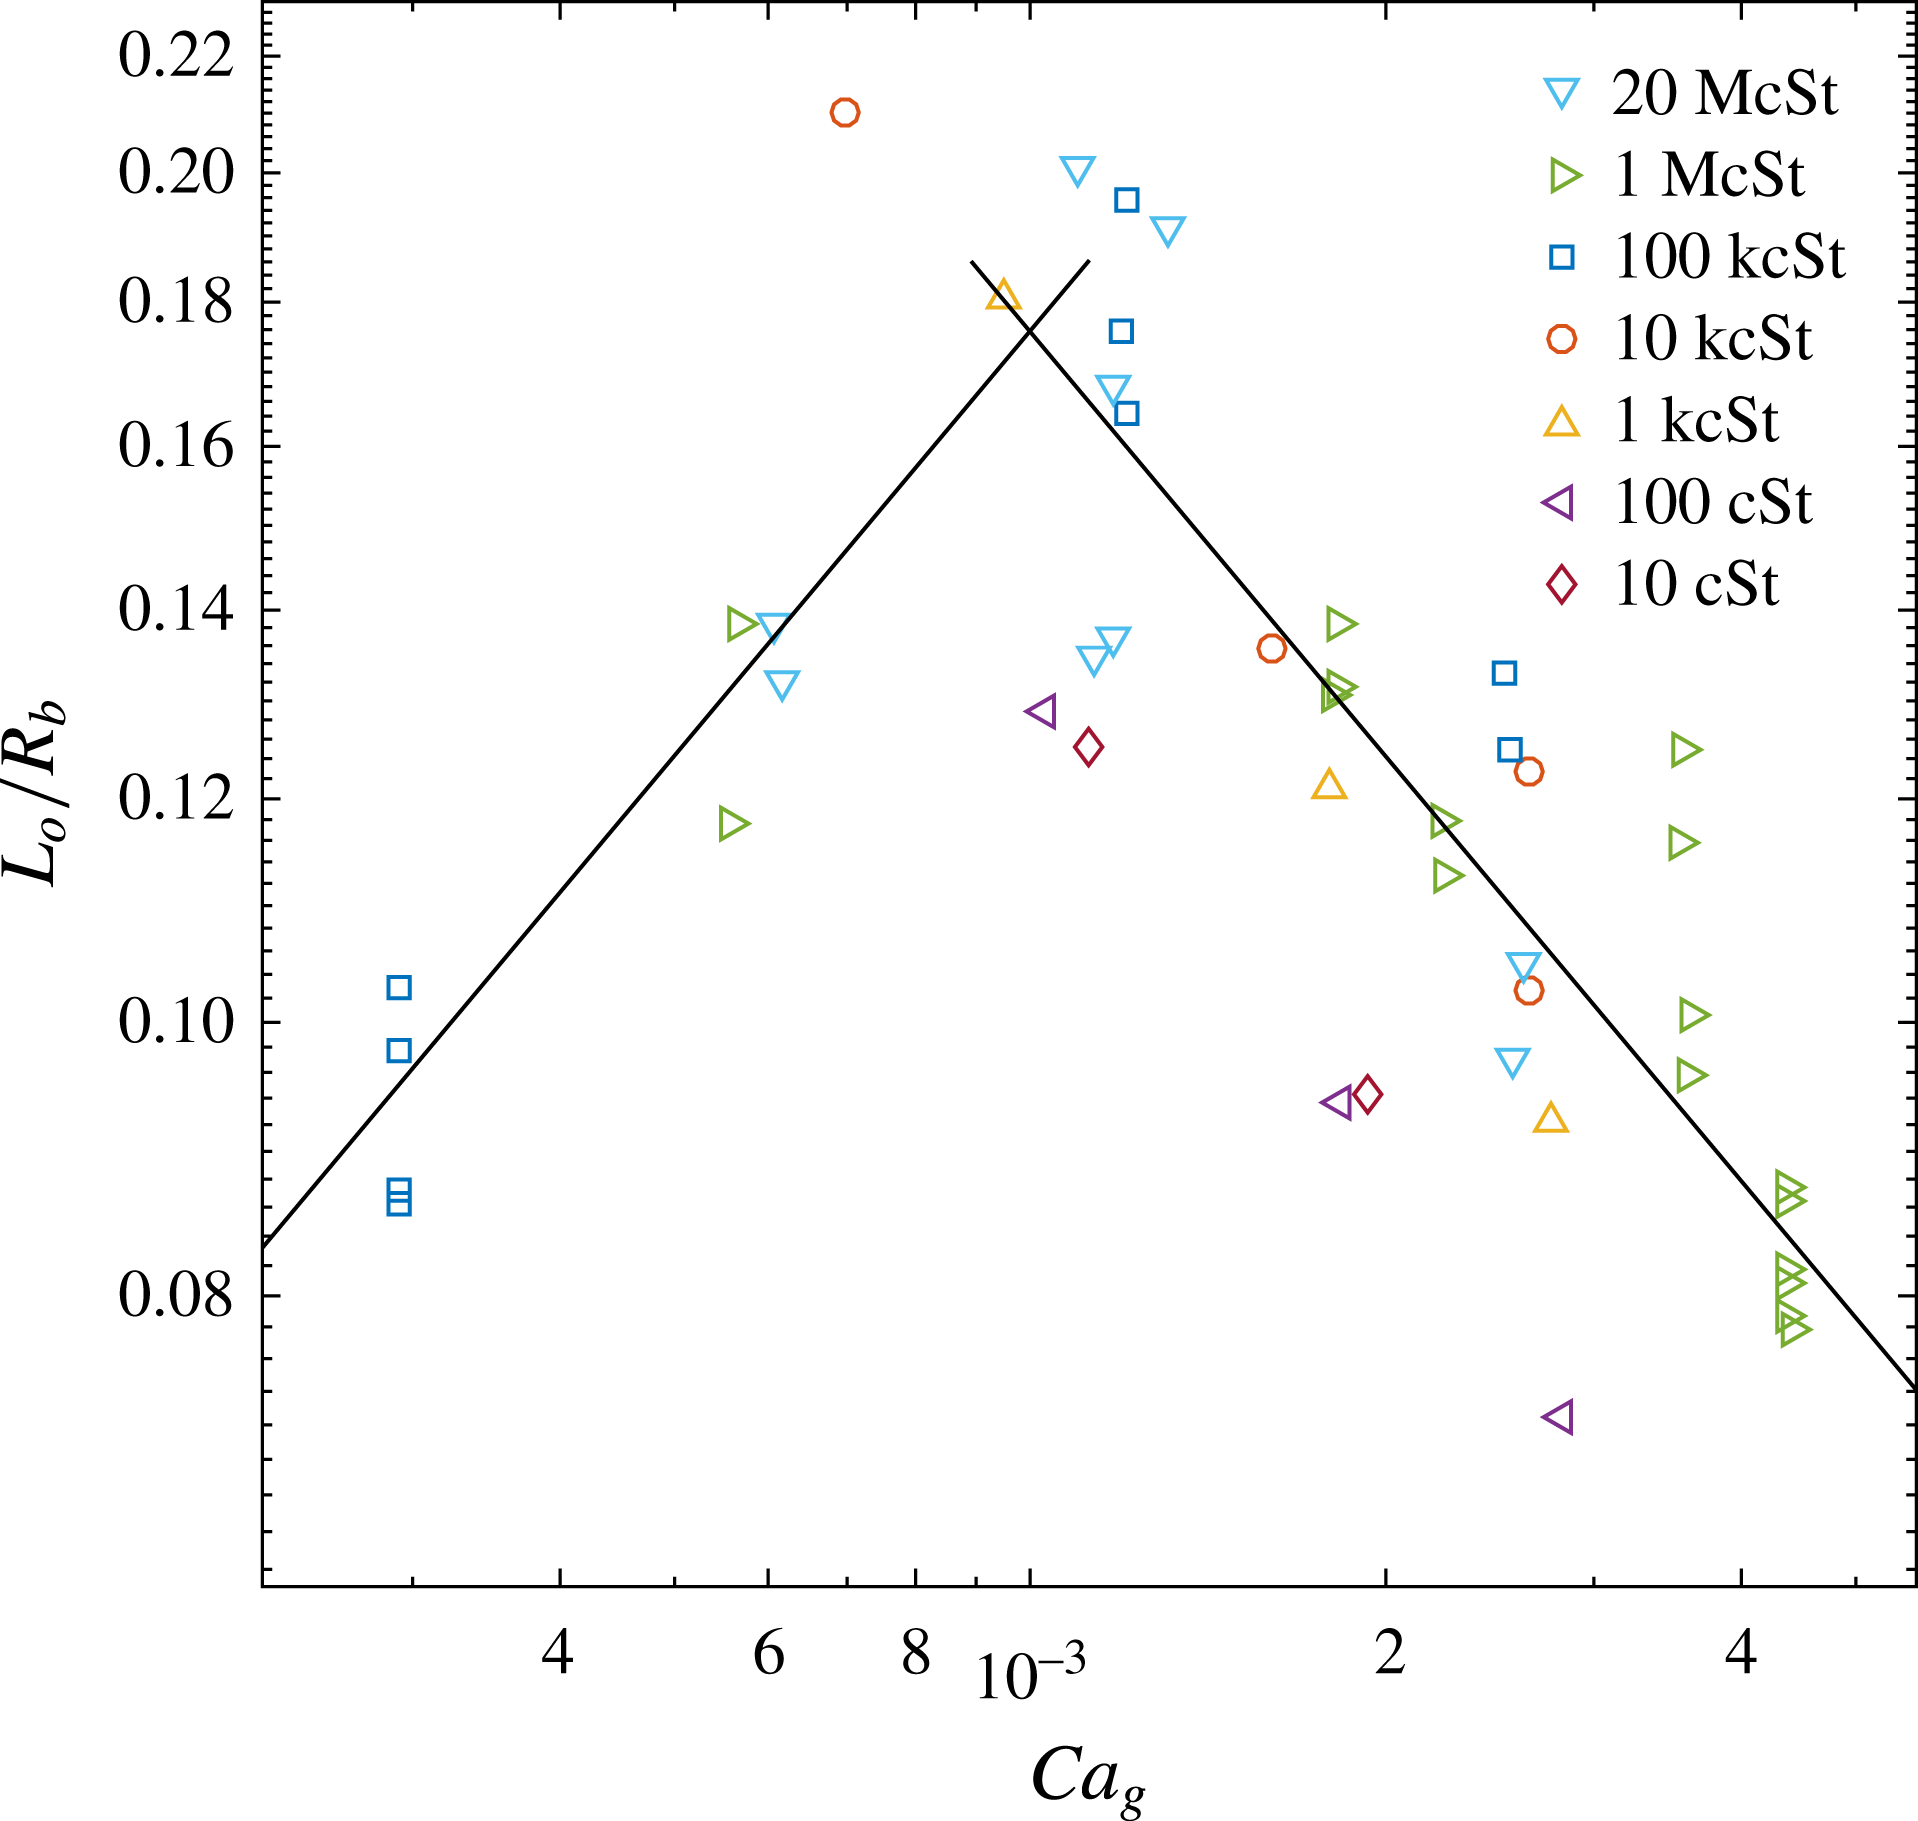
One basic tenant of this work is that the radial extent of the drop deformation grows as
 $L_{o}/R_{b}\sim Ca_{g}^{1/2}$
. This dependence is tested for our data in figure 11. One can liberally argue that for the smallest values of
 $Ca_{g}$
the data show such a dependence, while at larger
 $Ca_{g}$
even the sign of the power law has flipped. This is not surprising as the capillary number based on the liquid viscosity
 $\unicode[STIX]{x1D707}_{\ell }$
is
 $Ca_{\ell }\gg 1$
, up to
 $10^{6}$
. Furthermore, the large spread in the data at large
 $Ca_{g}$
is consistent with the insignificant role of surface tension in the present work.
The horizontal width of the central air dimple versus capillary number based on the gas properties. The solid curve on the left has a slope of
 $1/2$
and the one on the right side
 $-1/2$
.

4.3 Models of fast wetting and rarefied-gas effects
The extreme wetting speeds for the localized contacts shown in § 3.3, need to be put in proper context with current modelling (Snoeijer & Andreotti Reference Snoeijer and Andreotti2013). Recent studies (Carlson, Bellani & Amberg Reference Carlson, Bellani and Amberg2012; Eddi, Winkels & Snoeijer Reference Eddi, Winkels and Snoeijer2013) have looked at the early spreading dynamics of viscous drops (
 $\unicode[STIX]{x1D707}_{\ell }$
up to 1100 cP) and have proposed two different models to describe the early spreading. However, neither model is able to accurately predict the large magnitude of velocities that we measure for the most viscous cases. In both of the studies, the droplets were brought into contact with the glass substrate slowly and thus the air film under the drop is not as thin away from the first contact as they are for our impact films. Eddi et al. (Reference Eddi, Winkels and Snoeijer2013) suggest that the initial spreading velocity has logarithmic corrections from
 $u_{\unicode[STIX]{x1D70E}\unicode[STIX]{x1D707}}$
, i.e.
 $u=-[a\unicode[STIX]{x1D70E}/(4\unicode[STIX]{x03C0}\unicode[STIX]{x1D707}_{l})]ln(r/R)$
, where the prefactor
 $a$
has values of order one. Here
 $r$
is the radius of the wetted contact. This formula gives velocities close to
 $u_{\unicode[STIX]{x1D70E}\unicode[STIX]{x1D707}}$
and would require excessively high prefactor values
 $a\sim 10^{4}$
to come close to our observed velocities, even at the smallest values of
 $r$
. The spreading must therefore occur without viscous shear within the liquid, perhaps by full slip (Blake et al.
Reference Blake, Fernandez-Toledano, Doyen and De Coninck2015) or assisted by van der Waals forces by vertically closing the gap, as shown schematically in the inset in figure 10(b). More exotic effects where the surface properties are not constant (Sprittles & Shikhmurzaev Reference Sprittles and Shikhmurzaev2014a
,Reference Sprittles and Shikhmurzaev
b
) could also be at play.
We should also mention possible rarefied-gas effects, as the air-film thickness during the gliding is of the order of 100 nm thick, which is similar to the mean free path of air at atmospheric pressure
 ${\sim}70$
nm (Jennings Reference Jennings1988). Marchand et al. (Reference Marchand, Chan, Snoeijer and Andreotti2012) studied the plunging of a flat plate into viscous pools, of viscosities up to 5 Pa s. They observe much faster wetting than expected, but also see localized contacts ahead of the main contact line, very similar to the wetting for the outer edge of an impacting drop (Driscoll et al.
Reference Driscoll, Stevens and Nagel2010; Thoroddsen, Takehara & Etoh Reference Thoroddsen, Takehara and Etoh2010). Marchand et al. (Reference Marchand, Chan, Snoeijer and Andreotti2012) and Chan et al. (Reference Chan, Srivastava, Marchand, Andreotti, Biferale, Toschi and Snoeijer2013) point out that for these type of conditions one must take into account the partial slip of the gas along the solid, which affects the motion of the contact line. Based on viscosity measurements by Andrews & Harris (Reference Andrews and Harris1995) they suggest a correction factor for the air viscosity of approximately a factor of 10 lowering the viscosity values when the layer is of similar thickness as the mean free path. However, for our wetting set-up this slipping of the air flow would be the same for all drop viscosities and we do not see how this can make the spreading velocity constant in the context of conventional motion of the contact line, when the drop viscosity is increased over six orders of magnitude. Specifically, their wetting velocity
 $U_{e}$
reduces systematically for increasing liquid viscosity even though this induces thinner air layers. For
 $\unicode[STIX]{x1D707}_{\ell }=5~\text{Pa}~\text{s}$
, Marchand et al. (Reference Marchand, Chan, Snoeijer and Andreotti2012) see
 $U_{e}\sim 0.015~\text{m}~\text{s}^{-1}$
, for
 $2~\unicode[STIX]{x03BC}\text{m}$
thick air layers. They introduce an air-entrainment capillary number
 $Ca_{e}=\unicode[STIX]{x1D707}_{\ell }U_{e}/\unicode[STIX]{x1D70E}$
which is a function of the viscosity ratio of gas to liquid and at their smallest ratio of
 $\unicode[STIX]{x1D707}_{g}/\unicode[STIX]{x1D707}_{\ell }\simeq 5\times 10^{-6}$
they get
 $Ca_{e}\simeq 3$
. In comparison, for our highest drop viscosity
 $\unicode[STIX]{x1D707}_{g}/\unicode[STIX]{x1D707}_{\ell }\simeq 10^{-9}$
we get
 $Ca_{e}\simeq 4\times 10^{5}$
. However, it is not obvious how the rarefied-gas influence can incorporate such small viscosity ratios. Rough power-law fits of figure 3 in Marchand et al. (Reference Marchand, Chan, Snoeijer and Andreotti2012) suggest much smaller
 $Ca_{e}$
than we observe. Rarefied-gas effects during drop impacts have also been discussed by Duchemin & Josserand (Reference Duchemin and Josserand2011) and de Ruiter et al. (Reference de Ruiter, Oh, van den Ende and Mugele2012).
In other words, the constant wetting velocities, irrespective of liquid viscosity, impact velocity or drop size, suggest that the classical capillary–viscous balance is not dominant in our set-up. Therefore, we suggest qualitatively new dynamics may be at play. Indeed the break-up of the films occurs for very similar thicknesses, which is not affected by the above external quantities. We speculate that the wetting of these extremely thin films is not by direct motion of the contact line, but rather vertical motion, as sketched in the inset of figure 10(b). This might be driven by surface forces, like van der Waals. Or perhaps localized contacts at a few nanometres ahead of the contact line, which would be much below our optical resolution. Such contacts through the
 ${\sim}50$
nm film might be greatly facilitated by the reduced pressure from fewer collisions in the rarefied-gas layer.
The appearance of isolated ruptures when the air film is
 ${\sim}160$
nm is consistent with the experiments of bouncing drops on smooth glass by de Ruiter et al. (Reference de Ruiter, Lagraauw, van den Ende and Mugele2015), where they never see air films under 200 nm when the drop bounces. In those experiments it only takes one rupture to stop bouncing, whereas in our experiments isolated ruptures do not stop the film from thinning at other azimuthal locations round the drop, which leads to the formation of much thinner films, with
 $\unicode[STIX]{x1D6FF}<50$
nm.
Qualitatively similar large deviations from
 $u_{\unicode[STIX]{x1D70E}\unicode[STIX]{x1D707}}$
are observed for the break-up of thin air films within 1000 cSt silicone oil during Mesler entrainment, see Thoroddsen et al. (Reference Thoroddsen, Thoraval, Takehara and Etoh2010).
We should also mention that silicone oils are strongly non-Newtonian shear thinning, as characterized by Mansoor et al. (Reference Mansoor, Marston, Uddin, Christopher, Zhang and Thoroddsen2016), their figure 3. However, the different viscosity liquids shear thin at different shear rates and would therefore not lead to a constant spreading velocity observed herein.
The observed gliding on the thin air film may explain some of the ring formations observed by Palacios et al. (Reference Palacios, Hernández, Gómez, Zanzi and López2012), for impacts of glycerine–water mixtures at
 $\unicode[STIX]{x1D707}_{\ell }\leqslant 204$
cP. The disappearance of the first ring of micro-bubbles may be indicative of the onset of gliding, which could have escaped their lower frame-rate imaging. See also the film ruptures in Li et al. (Reference Li, Vakarelski and Thoroddsen2015), where they produce an azimuthal band of micro-bubbles, for water impacting a 20 million cSt silicone oil surface.
Figure 6(b) shows maximum non-dimensional dimple size when
 $(\unicode[STIX]{x1D70C}V^{2}/P_{atm})Re_{\ell }^{1/3}\sim 0.2$
. Keep in mind that this is quite different from the local maximum bubble size identified by Bouwhuis et al. (Reference Bouwhuis, van der Veen, Tran, Keij, Winkels, Peters, van der Meer, Sun, Snoeijer and Lohse2012) for low
 $\unicode[STIX]{x1D707}_{\ell }$
and
 $V$
. In their case the minimum bubble size is governed by surface tension, while here it is the large drop viscosity which limits the centreline thickness
 $H_{c}$
. In our case the dominant role of drop viscosity, for the larger
 $\unicode[STIX]{x1D707}_{\ell }$
, is best expressed by the capillary number
 $Ca_{\ell }=\unicode[STIX]{x1D707}_{\ell }V/\unicode[STIX]{x1D70E}\sim 10^{5}$
which is nine orders of magnitude larger than in their work, where
 $Ca_{\ell }\sim 10^{-4}$
.
The above film gliding is fundamentally different from the air film under the outer levitated edge of the drop contact, observed in Thoroddsen et al. (Reference Thoroddsen, Takehara and Etoh2010) and Driscoll & Nagel (Reference Driscoll and Nagel2011), related to splashing (Riboux & Gordillo Reference Riboux and Gordillo2014; Stevens, Latka & Nagel Reference Stevens, Latka and Nagel2014), which emerges from a rapidly moving outer contact line.
4.4 Concluding remarks
Numerous questions remain. What is the flow field inside the drop? How does large
 $\unicode[STIX]{x1D708}_{\ell }$
affect the gas compression at the earliest times? How do the first wetting contacts occur? Experiments in a clean room on freshly cleaved mica sheets should resolve whether the first contacts, occurring when
 $\unicode[STIX]{x1D6FF}\sim 200$
nm, are intrinsic or promoted by dust or impurities on the solid. The impacts in most of the experiments are on microscope glass slides (Corning), but other experiments on mica sheets show similar results, also with numerous random wetting contacts. The break-ups therefore appear intrinsic, not requiring asperities. We suggest that our configuration represents the ideal system to study wetting of ultra-viscous liquids, where the elliptical nature of the equations of motion makes plunging-plate experiments impossible.
Acknowledgement
The work reported herein was funded by King Abdullah University of Science and Technology (KAUST).
Supplementary movies
Supplementary movies are available at https://doi.org/10.1017/jfm.2016.840.