Implications
In the development of breeding objectives for continuous traits with discrete price thresholds along a continuous scale, a normal distribution of trait values is commonly a key assumption. This study shows that departure from normality and missing data for these types of traits may involve serious consequences for economic weight calculations and therefore the direction and emphasis of selection.
Introduction
The effect of errors or changes in economic values (EVs) on predicted response to selection indices have been studied by several authors (Vandepitte and Hazel, Reference Vandepitte and Hazel1977; Smith, Reference Smith1983), who concluded that errors larger than 50% resulted in an incorrect selection criterion and therefore in a suboptimal direction of selection. Amer and Hofer (Reference Amer and Hofer1994) showed that failure to account for uncertainty in parameters such as EVs leads to overestimation of the value of selection because of the assumption that true parameters are known. Incorrect selection parameters can have greater impacts on how competing subsectors (e.g. breed companies or breeds) of a breeding industry rank relative to each other, and most importantly, their respective representation in the topmost ranked animals in a national or international genetic evaluation system (Amer, Reference Amer2006).
The normal or Gaussian distribution plays an important role in derivation of EVs, for example, for fitness or functional traits such as calving performance where multiple discrete categorical observations can be made, and there is a requirement to project incidence changes across more than two categories as genetic progress is achieved in a single underlying genetic trait. Assumptions of normally distributed data are sometimes used in the derivation of economic weights in situations where the underlying continuous trait can be observed. Examples include somatic cell score (Sadeghi-Sefidmazgi et al., Reference Sadeghi-Sefidmazgi, Moradi-Shahrbabak, Nejati-Javaremi, Miraei-Ashtiani and Amer2011), carcass quality traits (Van der Werf et al., Reference Van der Werf, Van der Waaij, Groen and De Jong1998) and reproductive traits (Ponzoni and Newman, Reference Ponzoni and Newman1989). These applications involve situations where there are discontinuous price or cost thresholds affecting animal economic performance. Amer et al. (Reference Amer, Lowman and Simm1996) and (Sadeghi-Sefidmazgi et al. (Reference Sadeghi-Sefidmazgi, Moradi-Shahrbabak, Nejati-Javaremi, Miraei-Ashtiani and Amer2011) have identified two situations where assumptions of normality can result in substantial errors in EVs when the underlying continuous variables are not normally distributed.
Categorical traits are genetically evaluated by threshold, logistic or linear models. The threshold model assumes an unobservable underlying continuous variable (liability), with one or more thresholds deciding the observed categorical outcome. However, many studies have also used linear models to predict the genetic merits of animals for traits that are recorded with discrete categories (e.g. Eriksson et al., Reference Eriksson, Näsholm, Johansson and Philipsson2004) even though the data violate the assumption of normality. Some studies (e.g. Wang et al., Reference Wang, Schenkel, Miller and Wilton2005) have shown that the estimates from linear models and threshold models of genetic merit of sires with progeny are highly correlated (r > 0.95) although there are likely to be differences in dispersion of estimated breeding values due at least in part to the different scales they are expressed on.
In the derivation of EV for categorical traits, it is important to take into account how the trait of interest is genetically evaluated. By partial differentiation of the profit function with respect to the population mean for the liability scale, EVs can be estimated on the liability scale (Meijering, Reference Meijering1986). However, if estimated breeding values for the trait of interest are presented on an incidence scale, rather than on an underlying liability scale, a transformation can be undertaken to express the EV from the liability scale to the incidence scale by dividing the EV on the liability scale by the expected change in the trait levels per unit change in liability (e.g. Amer et al., Reference Amer, Simm, Keane, Diskin and Wickham2001).
In addition to non-normality, another potential problem related to computing breeding objectives is the existence of censored data. Censoring in data occurs if for part of the trait scale, it is not possible to observe some values and so they may be treated as unknown variables or missing data. Survival measures (time data) are commonly subject to censoring. Incomplete data might be due to culling, death or sale. Treating censored records as uncensored or excluding them from genetic evaluations will lead to biased prediction of breeding values. This is because the average value of censored records is not usually equal to the population mean of the trait (Hou et al., Reference Hou, Madsen, Labouriau, Zhang, Lund and Su2009). The effects of censoring on the application of methods of computing breeding objectives that include price thresholds on a continuous scale have not been quantified.
The objectives of this research were: (1) to quantify more generally the errors in EVs for traits subject to price or cost thresholds when skewed or kurtotic distributions of varying degree are assumed to be normal; and (2) to determine errors in estimates of EVs when normally distributed data has been subject to censoring that is ignored when applying a price threshold breeding objectives model.
Material and methods
A general model for estimating the EV for a continuous trait where price or costs make incremental steps as the value of the continuous trait crosses one or more thresholds can be defined where the continuous trait is subject to a form of random variability. Let f(x,a) be a probability density function with a vector of parameters a for continuous variable x describing the phenotypic performance of a group of animals of interest. A set of thresholds located at various levels of trait x determine prices. The proportion of animals in each category is equal to the area between thresholds Ti and Ti −1 under the probability density function f(x,a).
The profit equation ( ) and EV when there is one threshold T is as follows:


This can easily be extended to multiple thresholds as was done by Meijering (Reference Meijering1980) in the situation of a normal distribution. However, for clarity, only situations where a single threshold exists are considered here. The implications of having multiple thresholds are addressed in the Discussion section.
There are many different contexts in which EVs for observable continuous traits can be calculated using this method. Rather than investigate an exhaustive range of practical applications, the approach taken is to specify general models to illustrate the magnitude of bias in EVs for given degrees of non-normality in f(x,a). For a single price determining threshold, the magnitude of the error when presented as a percent of the true EV is invariant to the size of the price change at the threshold. Thus, the key error determining parameters are the degree of non-normality in f(x,a) and the value of x taken by the price determining threshold. It is therefore possible to present general results from theory that in future can be used to indicate the risk of errors in practical situations where key price thresholds are known relative to the distribution mean, and the exact properties of the probability density function are not confirmed as being strictly normally distributed.
Skewed, kurtotic and censored data distributions were simulated using Mathcad 14 (Parametric Technology Corporation 2007) as explained below.
In order to evaluate the impacts of normal distributions with non-zero skewness, the skew normal (SN) distribution as defined by Azzalini (Reference Azzalini1985) was used in this study. The SN distribution is an extension of the normal (Gaussian) probability distribution, allowing for the presence of skewness. The probability density function of the SN distribution is outlined in detail in Supplementary Appendix A.
In order to evaluate the impacts of positive and negative excess kurtosis, the Pearson type VII distribution (Pearson, Reference Pearson1916) and the raised cosine distribution (Surhone et al., Reference Surhone, Tennoe and Henssonow2010) were used, respectively. The relevant probability density functions are given in detail in Supplementary Appendix B.
The error in the economic value (E) where there is a single price threshold at position T, when a normal distribution N is assumed but when the true distribution is a non-normal distribution, f, with either skewness or kurtosis parameter  is defined as

In this study, standardized skew normal (SSN), standardized Pearson (SPK) and standardized raised cosine (SNK) as shown in Supplementary Appendices A and B were used as the non-normal distributions f in equation (3).
To examine the effect of censoring, the standard normal distribution was evaluated after left censoring by 5% and 20%, right censoring by 5% and then interval censoring by 5% in both extremes. If data with the normal distribution are subject to censoring, the sample mean and standard deviation taken from the censored data will not reflect the mean and standard deviation that would be observed in the absence of censoring. This would lead to incorrect assumptions about the true distribution of animals relative to the price threshold, and errors in EVs. The detailed simulation of censored normally distributed data with reference to left censoring and the error in the EV are outlined in Supplementary Appendix C.
For all distributions, threshold positions were evaluated on the interval of [−4, 5]. The range of evaluated shape parameters varied from distribution to distribution. But results are only given for a few points.
Results
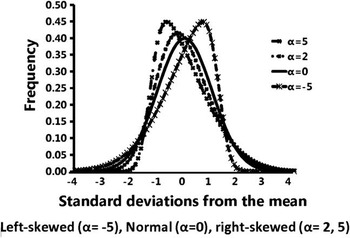
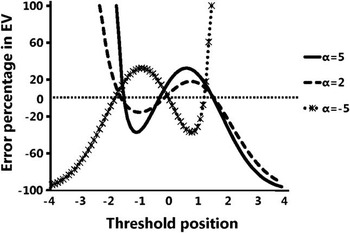
For the various evaluable levels of skewness and kurtosis, only the results from a subset of informative situations are presented and discussed in the main text. The effects of changes in the level of the skewness parameter α on the shape of the probability density function are shown in Figure 1. Departure from symmetry depends on the sign and magnitude of α. The density is reflected on the opposite side of the vertical axis if the sign of α changes. Error percentages in EV for three levels of α (5, 2 and −5) in a range of threshold positions between −4 and 4 are shown in Figure 2. There are two turning points in error trends at threshold points of −1 and 1. Greatest errors are observed in situations where frequency is very low for the skewed distribution, relative to frequency for the normal distribution at the same truncation point. However, errors of 20% to 30% are still observed where truncation points are relatively close to the mean. In general, in the presence of skewness, EV can easily be overestimated or underestimated by 100% or more and the highest risk is when thresholds are distant from the mean.
The effects of changes in the level of the skewness parameter α on the shape of probability destiny function.

Error percentages in economic values (EVs) at alternative price determining threshold points in standard deviations from the mean when the true distribution of a continuous trait is skewed according to three levels of shape parameter α.

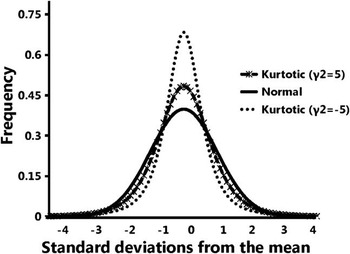
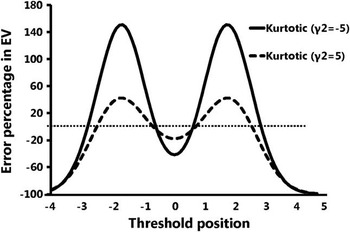
Positive or leptokurtotic distributions with two levels of parameter γ 2 (−5 and 5) are shown in comparison with the normal distribution in Figure 3. As γ 2 decreases, the peak of the distribution increases reflecting a higher probability than a normally distributed variable for values near the mean. Error percentages in EV due to positive kurtosis are shown in Figure 4. EV can be overestimated by 150% when there is a sharp distribution with γ 2 = −5 at thresholds of 2 and −2. In the case where the threshold is at zero, the EV was underestimated by 50%. As kurtosis increases, bias in EV estimation increases across the range of evaluated thresholds (Figure 4).
Positive or leptokurtosis distribution with two levels of the kurtosis parameter γ 2 (−5 and 5) in comparison with the normal distribution.

Error percentages in economic values (EVs) at alternative price determining threshold points in standard deviations from the mean when the true distribution of a continuous trait has positive kurtosis for two levels of shape parameter γ 2.

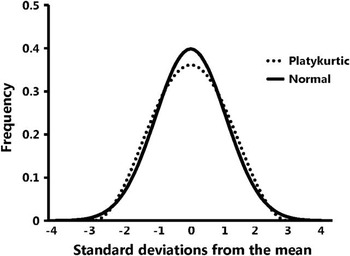
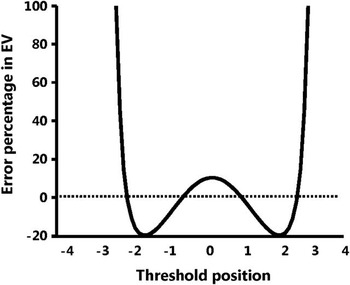
Negative or platykurtotic distributions in comparison with the normal distribution are presented in Figure 5. Different levels of the platykurtotic parameters resulted in the same distribution. This is because all distributions were standardized to prevent our assessment of errors being due to errors in variance in addition to kurtosis. Error percentages in EV in a range of threshold positions between −4 and 4 are shown in Figure 6. In the presence of negative kurtosis, the EV can be overestimated by 100% or underestimated by 20%. More bias in estimation of EV occurred when there was positive kurtosis in comparison with when there was negative kurtosis.
Negative (platykurtotic) distribution in comparison with the normal distribution.

Error percentages in economic values (EVs) at alternative price determining threshold points in standard deviations from the mean when the true distribution of a continuous trait has negative kurtosis.

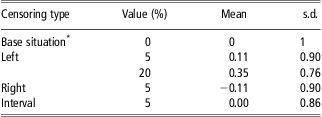
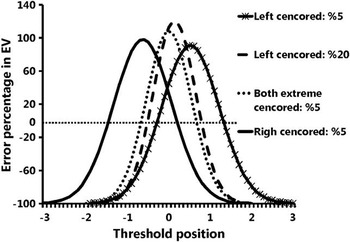
Changes in mean and standard deviation because of different levels of censoring are shown in Table 1. Left and right censoring by 5% have the same effects on standard deviation; therefore, their distributions are the same in shape but they differ in their location parameter, their mean. At higher levels of censoring, means shift further from zero, and standard deviations decrease further from one. The effect of interval censoring was a severe reduction in the estimate of the variance. Error percentages in EV because of censoring are shown in Figure 7 for situations where the price/cost threshold ranges between −3 and 3 standard deviations from the mean. Ignoring censoring in economic model parameterization resulted in strongly biased estimation of EVs. The effects of the different types of censoring on the error percentages at a given threshold were highly variable. In general, EVs can be overestimated by 120% or underestimated by 100%. Censoring resulted in overestimation at thresholds near to the mean and underestimation as the threshold deviated from the mean of the given censored distribution. As the censoring proportion increased, error percentages in EV were higher at intermediate threshold positions. Effects of censoring in a given extreme on error percentages at thresholds located at the same extreme were higher than those of opposite extreme. This was exacerbated as the censoring proportion increased.
Changes in mean and standard deviation because of different levels of censoring

*Base situation is standard normal distribution without censoring.
Error percentages in economic values (EVs) at alternative price determining threshold points in standard deviations from the mean when the true distribution of a continuous trait has different types and proportions of censoring.

Discussion
Results from this study show that EVs for traits facing a price/cost threshold are very sensitive to both lack of normality and missing data. In general, in the presence of skewness or kurtosis, EV can easily be overestimated or underestimated. Although the most extreme errors occur at extremes in the range of evaluated thresholds because the true EVs have very low magnitude, substantial errors can occur (i.e. 100% or greater) when thresholds lie within 1.5 standard deviations of the mean (Figures 2 and 4) for strongly non-normal distributions.
The results of this study have focused in a general way on situations where there is a single price threshold linked to the continuous trait. It is also useful to speculate on the implications of these results for situations where there are multiple price thresholds. Carcass pricing systems are common examples where multiple price thresholds have to be accounted for in the estimation of EVs (Van der Werf et al., Reference Van der Werf, Van der Waaij, Groen and De Jong1998; Quinton et al., Reference Quinton, Wilton and Robinson2010). For the situation where true distributions are skewed (Figure 2), errors are approximately transposed in sign for pairs of thresholds equidistant from the trait mean and within 1.5 trait standard deviations of the mean. Thus, if the price transitions across the two equidistant thresholds were identical then the errors would cancel each other out. Because in practice, multiple thresholds will be dispersed in various ways relative to the mean, and the price transitions across thresholds are unlikely to be consistent, it is unlikely that the risk of errors would be substantially attenuated when there are multiple price thresholds.
For kurtotic distributions, errors with multiple thresholds are most likely to be consistently positive for positive kurtosis (Figure 4) and consistently negative for negative kurtosis (Figure 6) unless some thresholds are in relative close proximity to the mean. Thus, errors in EVs shown in this study with a single threshold for a situation where the assumption of absence of kurtosis is inappropriate cannot be assumed to be attenuated in situations of multiple thresholds.
The general framework described here (equations (1) and (2)) holds provided the probability density function f(x,a) is modelled correctly. Transformation of x so that it closely follows a normal distribution may be adequate. An alternative is to simulate a shift in a series of real observations by a constant amount. The EV can then be taken as the difference in average price or value divided by the size of the change in the trait that bought about the size of the shift. Another alternative would be to fit a flexible probability density function to existing data and then use this function instead of a normal distribution function for f(x,a) in equations (1) and (2).
The assumption of normality may be violated in animal data. Many traits of economic importance, such as calving ease, disease incidence, somatic cell score, carcass or fat score and reproductive success are either measured or attract price or cost shifts on a discrete scale that is categorical. Data from the discrete scale can lead to strong departures from the Gaussian distribution and violate the assumptions underlying mixed linear model analysis methods. Therefore, best linear unbiased prediction is not generally appropriate for prediction of random effects and genetic evaluation of categorical traits. A standard alternative for the analysis of categorical data are nonlinear threshold mixed models (Meijering and Gianola, Reference Meijering and Gianola1985). These assume that an underlying continuous distribution called liability follows a Gaussian or logistic distribution, and the model defines thresholds that link the underlying distribution with the real scale categories (Abdel-Azim and Berger, Reference Abdel-Azim and Berger1999; Varona et al., Reference Varona, Moreno and Altarriba2009).
Although theory suggests a requirement for special analytical methodology for categorical traits, in practice it has commonly been shown that the advantages provided by these more computationally complex methodologies are often modest. In particular, it has been common to find very high correlations between the estimated sire breeding values obtained under linear and threshold models (Hoeschele et al., Reference Hoeschele, Gianola and Foulley1987; Ramirez-Valverde et al., Reference Ramirez-Valverde, Misztal and Bertrand2001; Wang et al., Reference Wang, Schenkel, Miller and Wilton2005; Hou et al., Reference Hou, Madsen, Labouriau, Zhang, Lund and Su2009).
Results from this study show that EVs for traits facing a price/cost threshold are much less robust to relatively small deviations from normality. Therefore, before deriving EVs it is also necessary to select a transformation that will best resolve the problems of non-normality or consider different methods that are less sensitive to non-normality.
Conclusion
A small deviation from normality assumptions for the distribution of continuous traits whose economic impacts are determined by discontinuous price thresholds may have a large effect on estimates of EVs. In contrast to practical genetic evaluation, economic evaluation in these instances is very sensitive to lack of normality and missing data. In the development of breeding objectives, it is necessary to select a transformation that will resolve the problems of non-normality or consider a different method that is less sensitive to non-normality.
Acknowledgement
This paper was written as part of PhD research study when the first author was on sabbatical leave at AbacusBio Limited, Dunedin, New Zealand, which is gratefully acknowledged for provision of facilities.
Supplementary materials
For supplementary material referred to in this article, please visit http://dx.doi.org/doi:10.1017/S1751731112000183