


Introduction
Sea-ice models have been developed mainly for use in global climate models and process studies. For the former, the emphasis has been mainly on long-term, large-scale simulations of polar ice (e.g. Reference Kreyscher, Harder and LemkeKreyscher and others, 1997). Verification of these models usually is based on buoy drift or climatological ice-thickness patterns. For process studies, shorter time-scales and higher-resolution models are often used to simulate past events (e.g. Reference Haapala and LepparantaHaapala and Lepparanta, 1996).
Sea-ice models are finding increasing use at national ice centres to supplement costly observations and to provide more accurate ice forecasts (e.g. Reference PrellerPreller, 1992; Reference Neralla, Chung, Karal and KoterayamaNeralla, 1994). For these purposes, sea-ice models must routinely produce reliable and accurate high-resolution, short-term forecasts of ice drift, concentration, thickness and pressure. Output from numerical weather-prediction models usually provides the atmospheric forcing. Often the ice models are coupled to an ocean model or the ocean forcing is highly simplified. In either case, there is usually little real-time ocean information available. Sea-ice data are often limited to total concentration, with little or no real-time information on ice thickness.
Another important aspect to using sea-ice models for forecast support is the provision of real-time verifications and feedback on model performance. Ideally, these provide ice forecasters with a measure of confidence to place in the model guidance in general and in specific situations. While performance requirements are rarely well defined, a forecast model, as a minimum, should improve on persistence for short-term forecasts or climatology for longer-term forecasts. The next target for forecast accuracy is to improve on human forecasts. The ultimate goal would be to meet the individual needs of all users of ice information.
This paper will focus on a verification of one of the operational sea-ice forecast models in use at the Canadian Ice Service (CIS) using data that are readily available in operational time-frames. Reference CarrieresCarrieres (1998) has previously demonstrated how new sources of ice data can be used for model verification, but these required many days of data and did not allow statistically significant feedback on recent model performance. The goal for the present work is: (1) to develop a routine model verification system which provides operational personnel with meaningful and up-to-date feedback on model performance; (2) to identify, compensate for and ultimately correct model deficiencies; and (3) to allow intercomparison of models.
The area of interest is off Canada’s east coast south of 52° N. Here, sea ice starts forming in December and often lasts until June, the maximum extent occurring in March. The main environmental factors controlling the ice development are: (a) the predominant cold northwesterly winds; (b) the cold southward-flowing Labrador Current; (c) strong oceanic upwelling along the continental shelf break; and (d) the warm northward extension of the Gulf Stream. Sea ice in this area can grow up to 1.2 m thick, but strong wind and wave forces normally limit floe sizes to about 100 m or less.
The Model
Previous sea-ice model verifications in this area (Reference Yao, Brown and FisselYao and others, 1992) have shown that ice models with simple oceans have limited skill, mainly due to unresolved or unresponsive ocean effects. While short-term forecasts of ice drift are largely independent of ice thermodynamics, ice-edge forecasts are as dependent on thermodynamic factors as on dynamic factors (see Reference Prinsenberg, Peterson and FowlerPrinsenberg and others, 1991). For these reasons and because an ocean model can provide information for other purposes such as iceberg or current forecasts, CIS has implemented a coupled ice-ocean model in this area. This model forms the basis of verifications in this paper.
The coupled ice-ocean model discussed here has been developed at the Bedford Institute of Oceanography (see Reference Yao, Tang and PetersonYao and others, 2000, for a more complete description). The ice component is a multi-category dynamic-thermodynamic model. Ice velocity u, is calculated from the following form of the momentum balance equation

where m is the ice mass per unit area,
 is the Coriolis parameter,
 is the acceleration due to gravity, ∇H is the gradient of sea-surface elevation, A is the ice-covered fraction, τa
is the wind stress, τw is the water-current stress and ≤ is the internal ice-stress tensor. The internal ice stress follows the viscous-plastic rheology of Hibler (Reference Hibler1979). Multiple ice categories are parameterized by a discrete thickness-distribution function (Thorndike and others, Reference Thorndike, Rothrock, Maykut and Colony1975). The ice-thermodynamics formulation is consistent with that of Hibler (Reference Hibler1980).
The ocean model is the Princeton ocean model (Reference Blumberg, Mellor and HeapsBlumberg and Mellor, 1987; Reference MellorMellor, 1996). The model uses sigma depth coordinates, and the 16 model sigma levels are: –0.01, –0.03, –0.06, –0.13, –0.21, –0.29, –0.38, –0.46, –0.54, –0.63, –0.71, –0.79, –0.88,-0.94,-0.98 and-1.00.
The ice and ocean models are coupled at the interface by momentum, heat and salt fluxes as discussed by Mellor and Kantha (Reference Mellor and Kantha1989). These fluxes are exchanged at each model time-step.
The model is implemented on a spherical coordinate grid with 1/6° spacing in latitude by 1/5° spacing in longitude extending from 40° to 66° N and from 40° to 66° W. Atmospheric forcing is provided by surface winds, air temperature and dew-point temperature from the Canadian regional weather-prediction model. There is no feedback from the ice-ocean model to the atmospheric model.
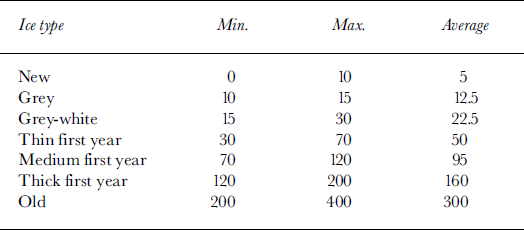
The model integration starts in mid-November. Initial temperature and salinity data follow the objective analysis of Tang and Wang (Reference Tang and Wang1996). A 40 day diagnostic-prognostic spin-up of the ocean model (see Yao and others, Reference Yao, Tang and Peterson2000) alone creates an initial ocean state. After that, model integrations run each day for a 48 h forecast beginning at 1800 UTC. In this mode, initial ocean conditions come from the previous day’s forecast. Initial ice conditions come from the previous day’s forecast except for ice concentration and thickness, which are provided by CIS daily ice charts. To facilitate this, the model thickness categories have been set at the midrange of the ice-chart stage of development-thickness ranges. The model ice-category concentrations are then assigned directly from the ice-chart data.
Verifications Based on Ice Charts
(a) Ice-chart characteristics
At the CIS and at most national ice services, ice products are based on data that come from a variety of sources. In situ observations of ice concentration, thickness and pressure are considered most accurate, but usually cover only small areas and may not be representative of larger-scale conditions. Aerial reconnaissance can provide both visual observations and radar-derived ice observations and imagery. The visual observations provide quite accurate estimates of ice concentration and reasonable estimates of ice-thickness ranges in ideal conditions. Satellite imagery provides by far the greatest ice-area coverage. Visual band imagery from polar orbiting satellites including the U. S. National Oceanic and Atmospheric Administration (NOAA) and the U. S. Defense Meteorological Satellite Program (DMSP) Operational Line Scanner offers frequent repeat coverage but only provides ice concentrations with accuracy. The DMSP Special Sensor Microwave/Imager sensor provides large area coverage and reasonable ice-concentration information, but with very limited resolution. RADARSAT and, to a lesser extent, the European Remote-sensing Satellite ERS-1 provide the largest area coverage and all-weather capability. Their radar imagery has sufficient resolution and signature definition to provide very accurate ice-concentration and reasonable ice-thickness ranges in good conditions.
The CIS daily ice charts depict areas of similar ice conditions using polygons and World Meteorological Organization ice ˚egg" codes (e.g. Fig. 1). The analyst incorporates all observations available up to the valid time of the chart, which is 1800 UTG. Although the quality and volume of information varies from day to day, the entire area of the chart must be completed every day. This process of moving data to a single valid time and filling information gaps is usually referred to as nowcasting. Ice-model guidance is used to help fill in these data gaps. The analyst’s judgment is also required to resolve conflicting information and to maintain consistency from one day to the next.
Example of a CIS daily ice chart for 4 May 1999.
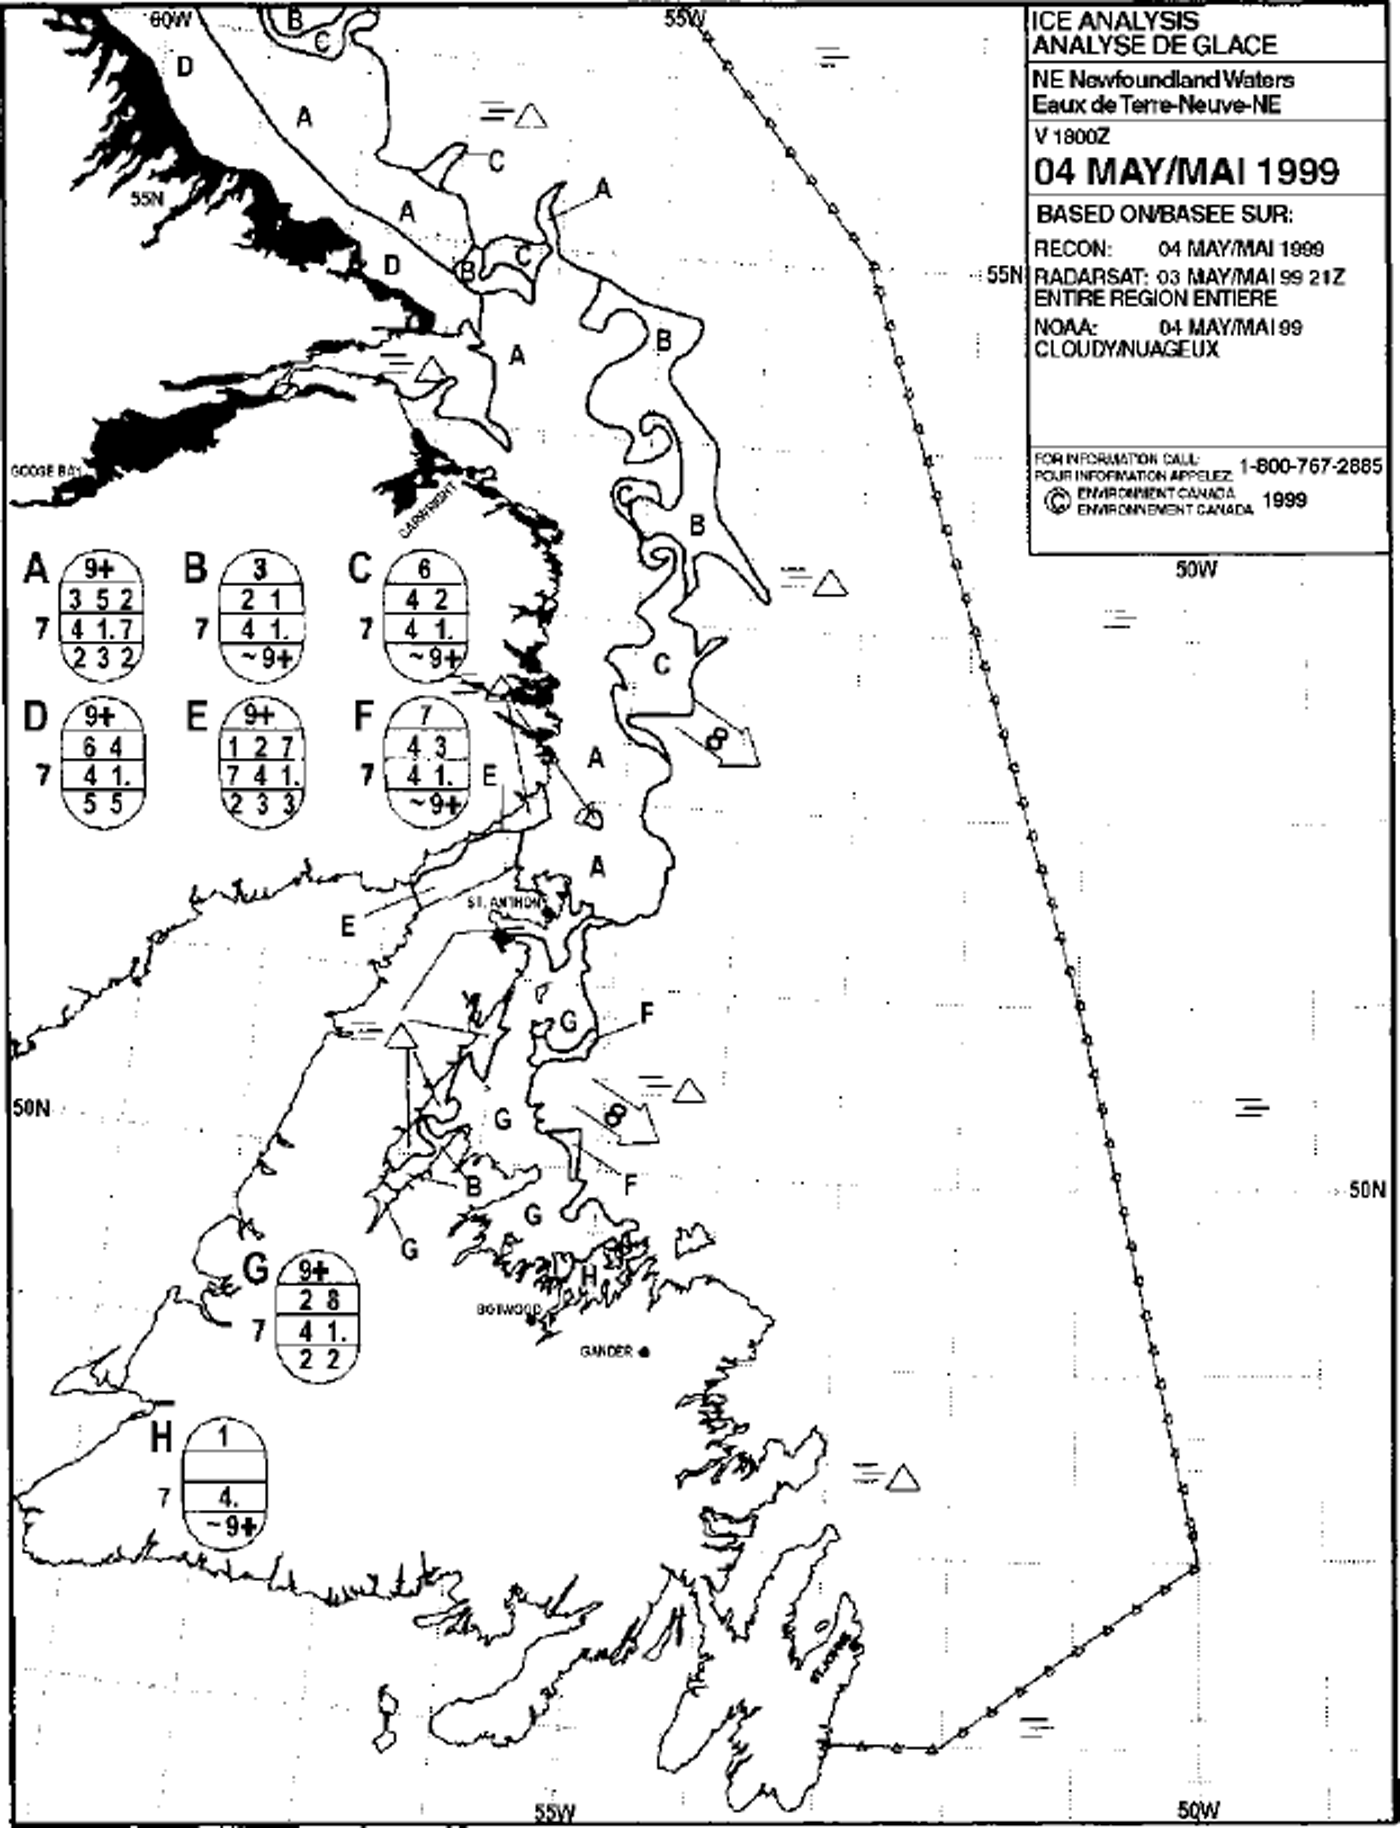
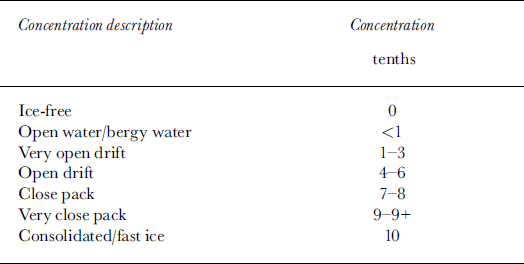
In addition to the above limitations, the ice charts are further constrained in order to increase legibility/interpretation and to compensate limitations in the observations. Ice concentrations are grouped in ranges as shown in Table 1, and ice thickness is expressed only in ranges as shown in Table 2. Based on these criteria, one can expect the ice charts to have an accuracy in ice concentration of ±10% and an accuracy in ice thickness of about ±30%.
Ice-concentration ranges used in CIS daily ice charts
Ice-thickness ranges and assumed average thickness in cm for various ice types
The ice-chart information is used in this study by first digitizing the chart on a geographic information system and then extracting the egg code information at points on a 5 km square grid. The data are then transferred to the model grid by averaging all points that fall within a model gridcell.
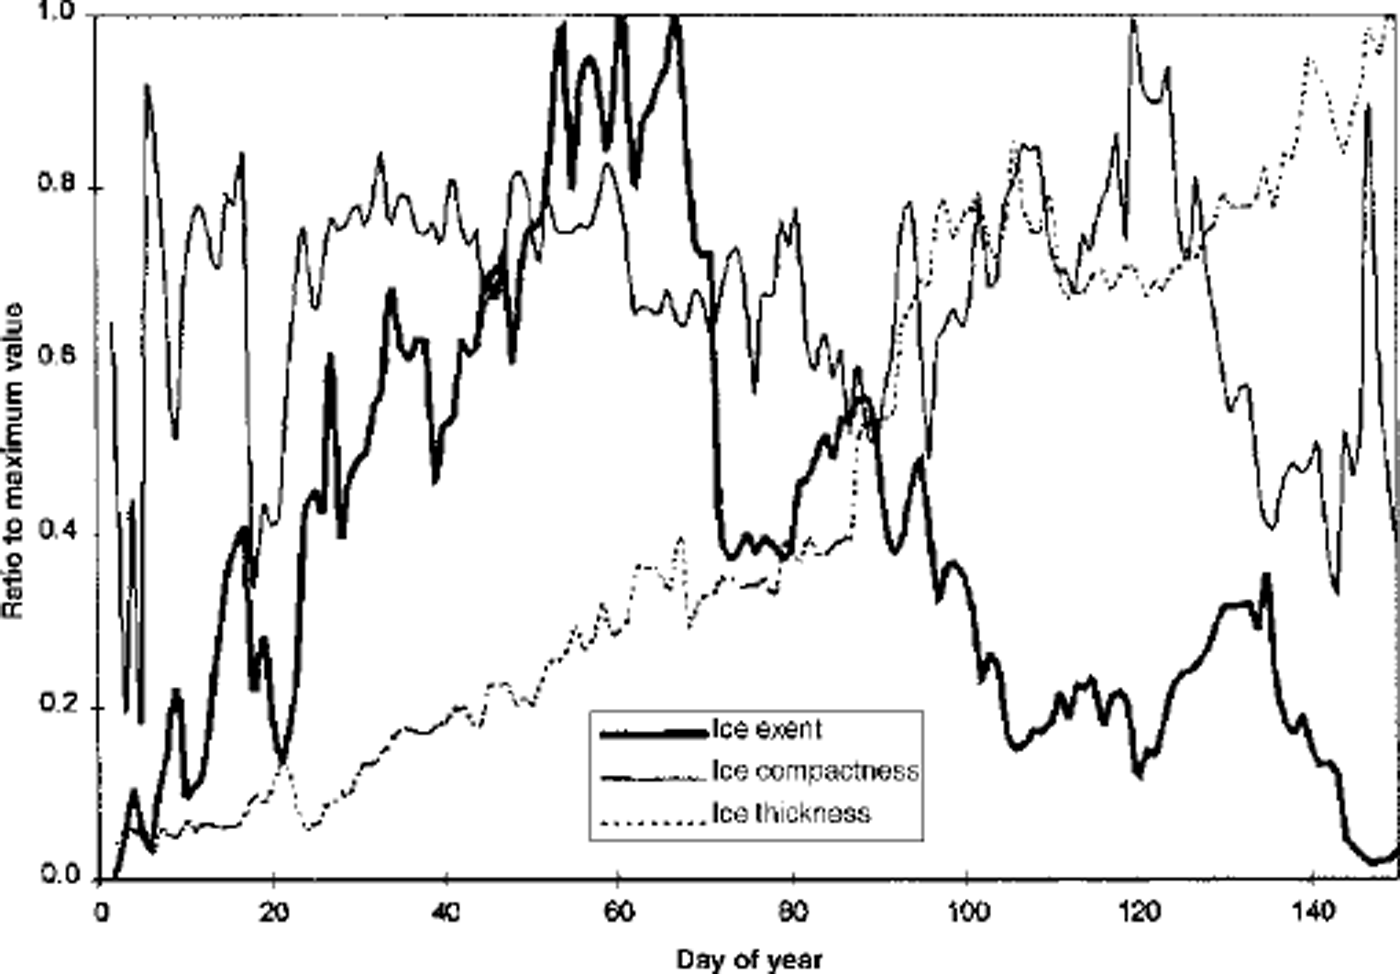
The digitized ice-chart data have been used in Figure 2 to depict the evolution of the 1999 ice season off the Canadian east coast south of 52° N. The ice extent is defined as the total area of gridcells covered with 10% or greater ice cover. The curve shows a fairly rapid increase until early March, followed by a rapid and then a more gradual decline. Superimposed on this are a number of substantial fluctuations caused by the passage of winter storm systems. The mean ice thickness is averaged only over ice-covered areas. It shows a gradual increase until mid-May, and the fluctuations at the several-day time-scale are weaker than in the ice-extent time series. The curve does not imply that ice growth continues into May, but rather that the thinnest ice is the first to melt. Only the thickest ice remains in May. The final curve is ice compactness, which is defined as the total area covered by ice divided by the ice extent. The compactness exhibits no overall trends other than a gradual increase at the start of the season and a decrease towards the end of the season. Also when the ice extent is low, ice compactness is much more subject to large fluctuations.
Evolution of average ice thickness, total ice extent and average ice compactness for the ice-covered areas south of 52° N along the Labrador and Newfoundland eastern coasts in 1999. These curves are normalized to their peak seasonal values which are: 1.36 m for average ice thickness, realized on 20 May; 97088 km2 for ice extent, realized on 2 March; and l for average ice compactness.
For the above discussion, the change in ice-chart accuracy from day to day has largely been ignored. There are days when almost no new information is available. This will cause the ice charts to start deviating from reality. Often the analyst will tend to be more conservative on these days, so forecast changes will be small. When new information becomes available, the charts will reflect this and there will often be a largejump in conditions.
For the verifications based on charts presented below, only the area south of 52° N will be considered. The ice charts in this area are considered to have the highest accuracy and this is the area of greatest concern to the CIS marine clients. The ice-chart data used here are for 1999 only.
(b) Total ice-concentration verification
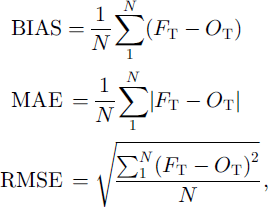
The model 24 and 48 hour forecast total ice concentration will be compared with the ice-chart total concentration. Table 3 shows the bias, mean absolute error (MAE) and root-mean-square error (RMSE) in total ice concentration in per cent between the 24 and 48 h model forecasts FT and the ˚observations" OT which come from the processed ice chart. These errors are defined as:
Total ice-concentration verification statistics (%) for 24 and 48 h model and persistence forecasts. An alternative interpretation of the latter is the change in ice concentration over these time periods
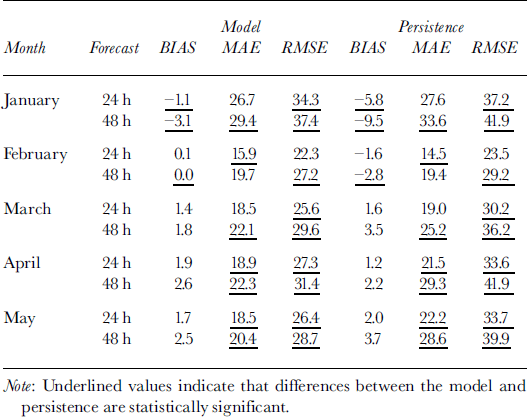
where N is the total number of grid squares with 10% or greater ice coverage in either the observations or model. Also shown in Table 3 are the error statistics for the 24 and 48 h persistence forecast. It should be noted that a persistence forecast in this marginal ice zone is often quite reasonable on a gross scale because ice-edge positions do not change significantly from day to day, as drift is often offset by melt-back. An analysis of variance has been performed using the variance ratio and the ˚F distribution" in order to show which differences between the model and persistence are statistically significant at the 95% confidence interval (these values are underlined inTable 3).
The persistence-forecast bias is negative in January and February, reflecting the expansion of ice area in these months. From March through May, the ice is melting, with a corresponding decrease in ice area and a positive bias in the persistence forecasts. The model bias is significantly smaller only in January. The MAE and RMSE scores for both sets of forecasts are rather large, with best scores achieved in February. The model exhibits significant skill in MAE over the persistence forecast in April and May. The model RMSE is consistently better than persistence, indicating that the model has fewer or smaller large errors.
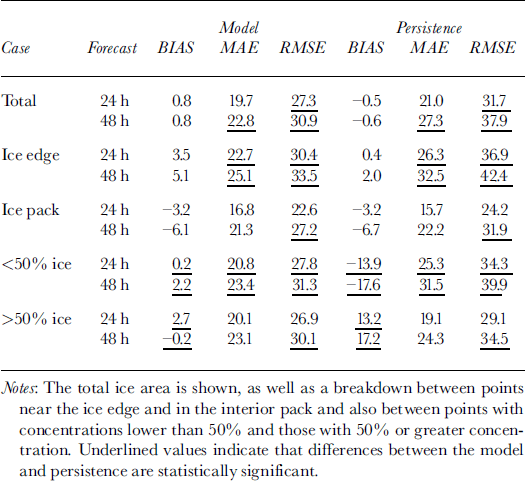
In order to identify where the differences in model and persistence occur, a further breakdown of the forecasts is shown in Table 4. In this table, data from January through May are combined and then broken down to cases where the points are on the ice edge or within the interior of the ice pack and also where ice concentrations are less than and greater than 50%. For the total of all points combined, the model again shows significant skill over persistence in RMSE. The smallest values of MAE and RMSE occur within the ice pack and in points with >50% concentration. In these areas, smaller changes are occurring and there is little to distinguish the model from persistence here. In areas with the largest change, along the ice edge and in areas of ω50% concentration, the model shows consistently significant improvement over persistence in MAE and RMSE scores. Also the model-bias score exhibits little sensitivity to ice concentration, whereas the persistence-forecast bias is strongly dependent on ice concentration.
Total ice-concentration verification statistics (%) for 24 and 48 h model and persistence forecasts
(c) Ice-chart tendency verifications
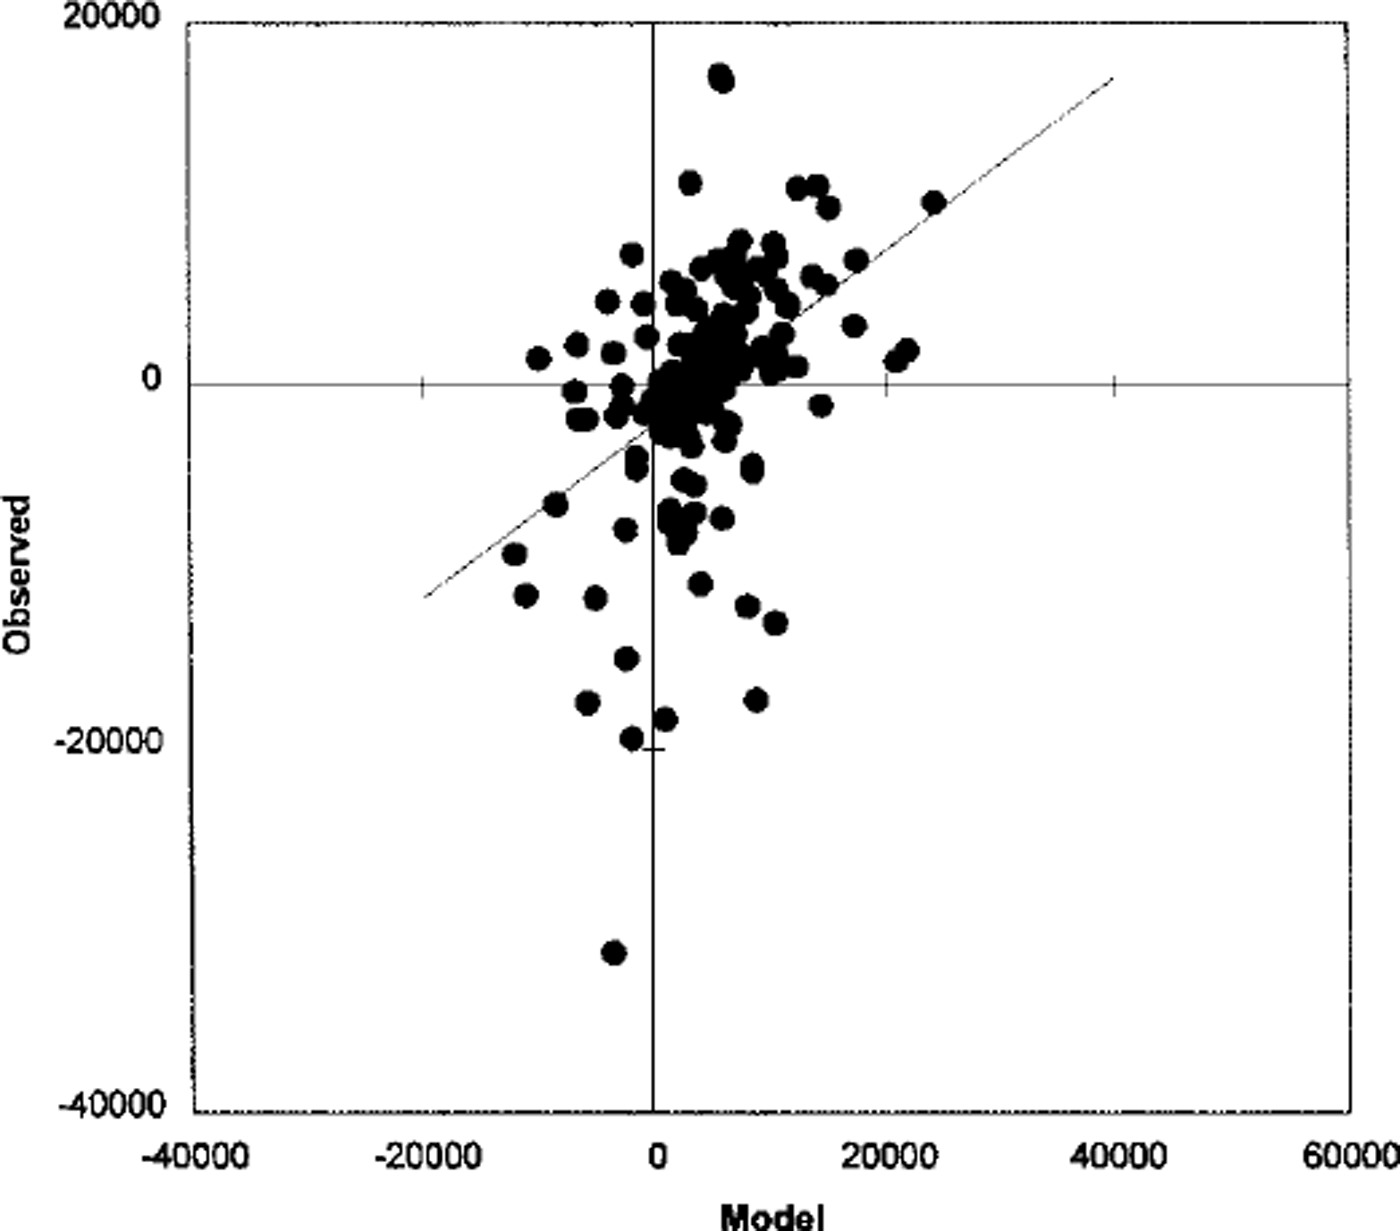
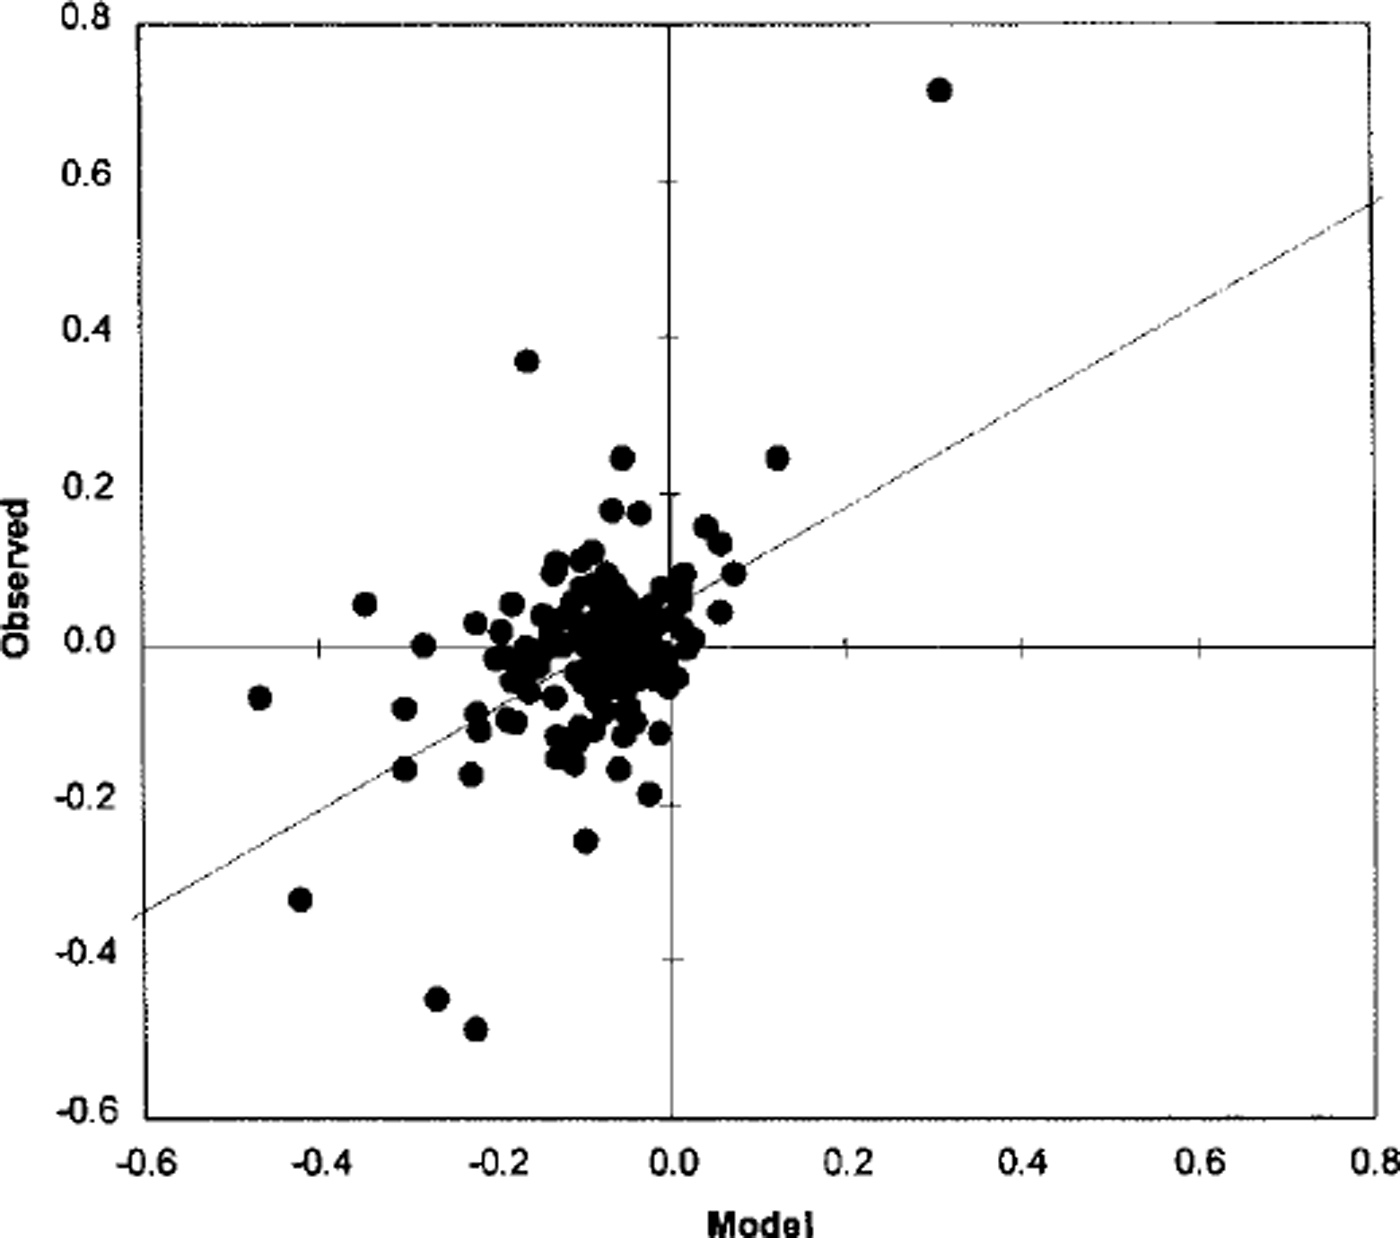
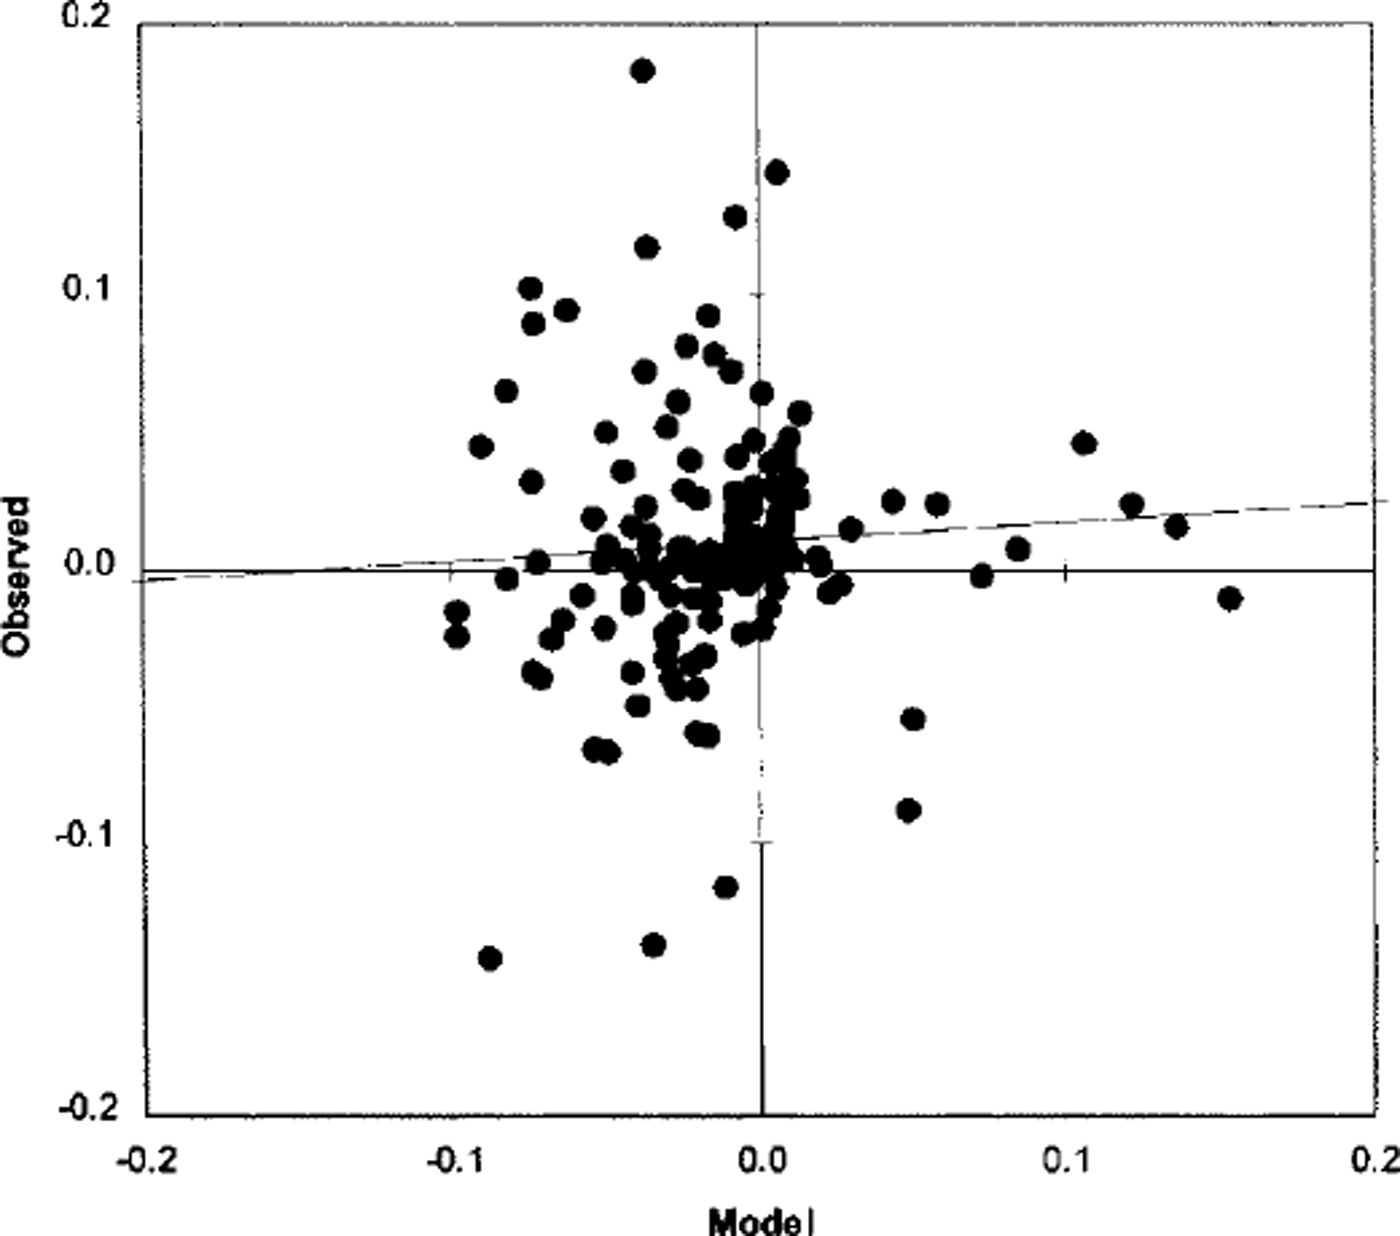
In this section, the model 0–24 and 24–48 h forecast changes in total ice extent, total ice-covered area, mean ice compactness and mean ice thickness are compared with those derived from the ice charts. A scattergram of the observed vs predicted 24 h change in ice extent is shown in Figure 3. Similar scattergrams for the 24 h change in mean ice compactness and mean ice thickness are shown in Figures 4 and 5, respectively. The scattergram for change in total ice area is very similar to that for change in total ice extent and is not presented here. The correlation and bias for the 0–24 and 24–48 h changes are shown inTable 5. This table also includes the 95% confidence intervals for the bias based on the Student’s t statistic.
Scattergram of observed vs predicted 24 h change in ice extent (km2 ).
Scattergram of observed vs predicted 24 h change in ice compactness.
Scattergram of observed vs predicted 24 h change in ice thickness (m).
Correlation and bias between modelled and observed for 0–24 and 24–48h changes in total ice extent, total ice area, mean ice compactness and mean ice thickness. The 95% confidence intervals based on the Student’s 6 statistic are also shown
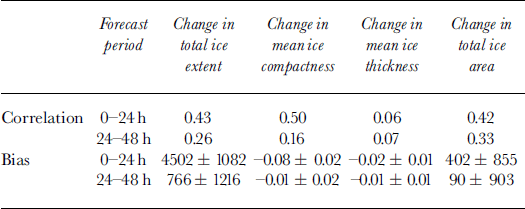
The correlation statistics indicate that the model forecasts explain up to 25% of the variance in the 0–24 h changes, but that the skill decreases to ω10% for the 24–48 h changes. This may be caused by decreasing accuracy in the atmospheric forcing with the length of the forecast. For the 0–24 h forecast period, the model has a positive bias for the change in total ice extent and a corresponding negative bias for the change in mean ice compactness. This may be caused by inconsistent specification of the initial ice and ocean conditions. Since only the ice concentration by category is updated, this may not be consistent with the ice velocities and internal ice forces, which are specified from the previous model integration. Similarly, the specified ice concentration may not be consistent with the underlying sea-surface temperature which also comes from the previous integration. The bias for the 24–48 h forecast periods is negligible, which may indicate that by this time the model ice properties have become self-consistent and also more consistent with the ocean state.
The forecast changes in ice thickness exhibit the lowest correlation with the observed changes. Recall that ice thickness is imprecisely specified on the ice charts. So while the general trend in ice thickness derived from the charts seems reasonable (see Fig. 2), the day-to-day variation is insufficiently accurate to evaluate the model forecasts. The statistics on model forecasts of ice thickness are considered inconclusive at this time.
Ice-Trajectory Verification
Ice beacons were deployed on the ice at various points off the coast of Labrador during winter 1998. These beacons were equipped with global positioning system (GPS) locators, and the data were fed back in real time through the ARGOS system. The beacons reported positions every hour, with an estimated accuracy of about 30 m. For the purposes of this verification, only the 24 h ice-beacon motion was considered, and with nine beacons deployed a total of 448 beacon days were collected.
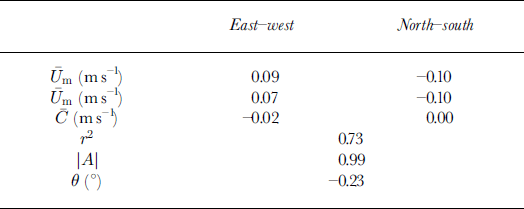
The complex regression used to correlate observed ice drift and model drift follows the form:

where the complex variables Um and U0 are the model and observed ice drift, respectively, C is the residual, \A\ is the gain and 9 is the turning angle. The results of regression are shown in Table 6. The model and observed mean drifts are similar except that the model overestimates the eastward motion. This is consistent with the earlier suggestion that the model over-predicts ice divergence. The turning angle and residual are both quite small and the gain is close to unity. The correlation coefficient is significantly higher than has been found in other model drift investigations (eg. Reference CarrieresCarrieres, 1998).
Ice-drift verification results for model trajectory forecasts vs 24 hue drifts from beacons
Conclusions
Operational forecasts from a coupled ice-ocean model have been verified using CIS daily ice charts and ice beacons. The charts provide sufficiently reliable measures of total ice concentration to produce routine model verification guidance to ice analysts and forecasters. Ice thickness derived from ice charts is considered too imprecise to evaluate model performance. While it was expected that the charts would have limited utility for determining specific model deficiencies, some trends were noted. The direct model forecasts of ice concentration exhibit skill over persistence forecasts particularly in areas which exhibit the largest fluctuations: near the ice edge and in lower concentrations. For 0–24 h forecast changes in total ice extent, the model has a positive bias but explains up to 25% of the variance. Somewhat less skill is exhibited for 0–24 h forecast change in mean ice compactness and total ice area. The model skill drops off in the 24–48 h period, although the model exhibits negligible bias. This is likely due to decreasing accuracy in the atmospheric forcing and the fact that the model is adjusting the ice properties to be more self-consistent and more compatible with the model ocean.
Model ice-trajectory forecasts have also been compared with GPS-equipped ice beacons. The model ice drifts have high correlation with observations, although there is a tendency to over-predict eastward ice motion.
Acknowledgements
The author wishes to thank T. Yao, Hai Tran and the reviewers for helpful comments on this paper. Thanks to T. Yao and G. Tang for leading the development of this model, and to Hai Tran and S. Yu for ensuring the model ran smoothly and for help in preparing the data. This work was funded by the Program for Energy Research and Development through project No. 534105.



