


Introduction
The analysis of ice cores provides a window on the past, and measurement of the composition of cores provides proxies for many climatic variables. the presence of impurities is established on a bulk scale by various analytical techniques generally involving the ice being melted, with a corresponding loss of structural information. to help our interpretation of ice-core records and our understanding of the conditions that formed the ice as we find it today, a knowledge of the microstructure becomes useful.
Polar ice sheets are composed of a polycrystalline structure which does not experience the warm summer melt that is characteristic of glaciers in temperate regions. It is formed by a combination of processes during the diagenesis of snow through firn into solid ice, which includes the formation of bubbles as pores between grains are closed off (Reference PatersonPaterson, 1994). the surface free energy of the grain boundaries in the system is reduced by the transformation of small complex grain structures into larger, close-packed structures, by the migration of grain boundaries to reduce their curvature. As well as temperature determining boundary mobility, the concentration of both soluble and insoluble impurity in the core also influences grain growth by impeding the migration of grain boundaries (Reference Alley, Perepezko and BentleyAlley and others, 1986a). A knowledge of impurity location will help to describe the extent to which grain growth rate and other mechanical deformation properties are influenced by impurity content. This distribution is also of great relevance to chemical transformations that may occur after deposition in the ice sheet (e.g. processes that might produce CO2 in ice (Reference Tschumi and StaufferTschumi and Stauffer, 2000)), since it determines whether different chemical species are able and likely to come into contact with each other. the mechanisms for the electrical conductivity of polar ice are also dependent on impurity location (Reference Wolff, Miners, Moore and ParenWolff and others, 1997).
There have been few studies on finding impurities in situ in polar ice. Work by Reference NyeNye (1991) suggests that soluble impurities could reside in a pre-melted liquid in a network of veins between the ice crystals. This has been experimentally verified by Reference MaderMader (1992) on laboratory ice at temperatures close to the melting point of pure ice. Using a scanning electron microscope (SEM) equipped with a cryo-stage, Reference Mulvaney, Wolff and OatesMulvaney and others (1988) and Reference Wolff, Mulvaney and OatesWolff and others (1988) found sulphuric acid at triple junctions (the cross-section of veins) in ice from the Antarctic Peninsula and also from Greenland (Reference Wergin, Rango and ErbeWolff and Mulvaney, 1990). Reference Fukazawa, Sugiyama, Mae, Narita and HondohFukazawa and others (1998) performed studies using Raman spectroscopy on ice from East Antarctica; they located sulphate ions and also nitrate ions directly indicating the presence of concentrated liquid acids in the ice. Further studies using the SEM by Reference Cullen and BakerCullen and Baker (2000) found soluble impurities that originated from both acids and salts located at triple junctions and grain boundaries in ice from the Greenland Ice Sheet Project 2 (GISP2) core. By sublimating ice from the surface of their specimens in the microscope (etching) they also observed inclusions of impurities apparently originating from the bulk of the ice grains.
The SEM allows the cross-sectional surface structure of ice samples to be examined with greater resolution and depth of field than is achieved with the conventional light microscope (Reference Wergin, Rango and ErbeWergin and others, 1998). It works by scanning a focused beam of electrons across the surface of the specimen. the number of electrons emitted from each point the beam passes is detected and builds up an image of the surface corresponding to variations in the topography and elemental composition. the SEM also has the advantage that it allows the composition of impurities to be determined by means of X-ray microanalysis. This is where X-rays, emitted from the target elements by excitation from the incident beam, are detected to give an emission spectrum characteristic of the target composition. the low bulk concentrations present in most polar specimens mean that if the distribution is homogeneous throughout the bulk then in situ impurities exist below current detection limits. However, if the impurity is in a concentrated form (e.g. a dust particle or an impurity at a triple junction or grain boundary), then it can be possible to detect using X-ray analysis.
This work concerns the microstructure of polar ice samples taken from deep ice cores in both Greenland and the Antarctic, at depths corresponding to both the Holocene and last glacial periods. A brief description of the method by which the SEM and X-ray analysis was used to collect data is given. the paper is presented in the form of observations for the features typically found in polar ice, such as: grain boundaries, bubbles and clathrate hydrates. A study of dust particles in situ (which cannot be resolved using the light microscope) is made to try to establish the relative proportions at grain boundaries. Images indicating the influence of dust particles on grain growth are also included. Finally, examples of specimens with soluble impurities at both grain boundaries and triple junctions are considered.
The Samples
Greenland samples were taken from the Greenland Icecore Project (GRIP) ice core (72˚34’N, 37˚37’W; elevation 3232m and mean annual temperature –32˚C) from 1312.30– 1312.85m depth drilled in 1990, aged 7915 years BP (the Holocene), and from 1979.45–1980.00m depth, drilled in 1991, aged 23200 years BP (the last glacial period) (Reference JohnsenJohnsen and others, 1997). Visible bands are present in the core from both depths, particularly in the glacial period where the bands are associated with increased abundances of microparticles (Reference AlleyAlley and others, 1997). Samples were cut from both the clear and cloudy sections of the glacial ice for comparison. Antarctic samples were taken from the Dome C core (74˚39’ S, 124˚10’ E; elevation 3240 mand mean annual temperature –53˚C) from depths of 269.50–270.05 and 500.50–501.05m, drilled in 1999, which correspond to ages of approximately 8420 and 20200 years BP in the Holocene and last glacial periods (Reference Schwander, Jouzel, Hammer, Petit, Udisti and WolffSchwander and others, 2001). Some images presented are also of samples from a Dronning Maud Land (Antarctica) core (77˚ S, 10˚W; elevation 2200m and mean annual temperature –38˚C) from 115 m, drilled in 1998, corresponding to an age of approximately 1200 years. All specimens were stored at –20˚C before examination.
Technique
Samples of approximately 5 mm diameter were cut in a cold room at –20˚C; these were attached to microscope stubs using a carbon glue, and flat surfaces were cut using a sledge microtome. Specimens were handled in the isolated environment of the cold room using cleaned forceps, with latex gloves worn to prevent condensation reaching the surfaces. In some cases, a smoother surface was achieved by leaving the specimens to stand in a sealed container for up to 1 day, a process here referred to as pre-etching. the smoothing during pre-etching is thought to occur by a combination of evaporation and re-condensation of water molecules on the surface, and the movement of a pre-melted quasi-liquid layer (Reference Dash and WettlauferDash and others, 1995) to reduce the surface free energy. the thickness of the liquid layer is significantly increased where there are soluble impurities. This could allow the dispersion of impurity across the surface from regions of high concentration such as grain boundaries and triple junctions, to equilibrate the layer thickness. It is therefore undesirable to pre-etch samples unless for the purpose of imaging a particularly smooth surface. In this work, all observations concerned with impurity location were made on specimens that have not been pre-etched. In these cases, the specimens were immediately covered by a cleaned brass cap after cutting, to prevent contamination and condensation, and then further cooled by immersion in liquid nitrogen to minimize any impurity movement on the surface. the samples were then transferred to the SEM under vacuum.
The instrument used for the study was a Leica S360 SEM, with an Oxford Instruments CT1500 cold stage and an Oxford Instruments INCA system with an ATW germanium energy-dispersive detector for X-ray microanalysis. the temperature of the cold stage was generally kept at around –150˚C, but could be raised to sublime ice from the specimen surfaces (etching). Many images presented in this paper show specimens that have had their surface etched for 1 min at –80˚C: this was found to remove a layer 6 μm thick from the surface. the removal of this layer serves to sublimate ice-cutting debris from the surface and to effectively increase the volume of ice searched when looking for dust particles. Etching does not evaporate impurities on the surface but rather can serve to concentrate them (Cullen and Baker, 2000). It is likely that etching allows impurities some mobility, although not by the mechanisms suggested for preetching because of the lower temperatures. for this reason, the technique should be used with caution when considering the origin of an impurity.
Some surfaces presented have a gold sputter coating to improve the image quality by allowing higher probe currents and accelerating voltages with fewer charging effects on the surface than on an uncoated sample. X-ray analysis was used to qualitatively determine the elemental composition of the features observed, normally with the beam accelerated to around 10 kV, and focused on a specific spot on the specimen. A more detailed description of the technique is given else where (Reference Barnes, Mulvaney, Wolff and RobinsonBarnes and others, 2002).
Observations
Grain boundaries and triple junctions
Figure 1a shows grain boundaries intersecting at triple junctions which are free from detectable impurity. the smooth surface has been achieved by pre-etching. As well as the clearly defined grain boundaries, two fine lines, indicated by arrows, can be discerned below the triple junction on the left side of the image, one of which intersects the boundary at a slight bend. We interpret these finer lines as indicating the presence of sub-grain boundaries referred to by Reference Thorsteinsson, Kipfstuhl and MillerThorsteinsson and others (1997); these may be linked to a gradual reorientation of the crystal along its basal plane. Grains of different orientations can be seen in Figure 1b, a specimen from the GRIP core (1980m) which has been etched for >21min at –80˚C. This corresponds to sublimation of approximately 125 μm of ice from the original cut surface. Under these conditions, the pattern of peaks and facets left on the surface as ice sublimes varies depending on the orientation of the lattice. the impressions left by the grain boundaries can be clearly seen and are about 20 μm wide.
(a) Grain boundaries and triple junctions from Dronning Maud Land core (115 m), pre-etched for 1day (scale bar: 20 μm). Note the faint lines below the grain boundary on the left of the image indicated by arrows, which are interpreted as subgrain boundaries. (b) An etched surface (21 min at –80˚C) from the GRIP core (1980 m) with surface texture differing between grains. the holes on the surface are impressions left by clathrate hydrates (scale bar: 500 μm).

Bubbles
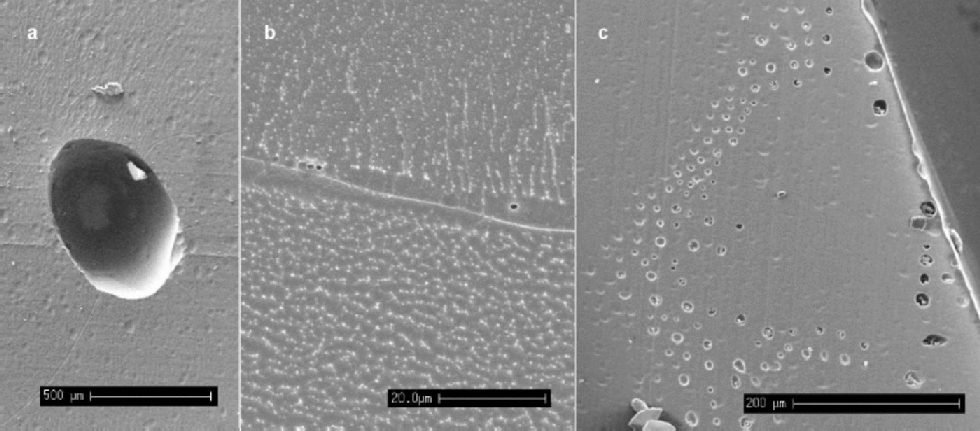
Bubbles are expected in all ice above around 1500 m depth. from depths of around 400–500m and below at Dome C, and 1000 m and below for GRIP, the occurrence of bubbles decreases and air-hydrate crystals appear and become more abundant with increasing depth (Reference Shoji, Miyamoto, Kipfstuhl, Langway and HondohShoji and others, 2000). Number densities and volume fractions of bubbles have been linked to climatic parameters (Reference Lipenkov and HondohLipenkov, 2000). the SEM is of limited use for such studies because of the small sample sizes examined. However, we note from our observations that the majority of bubbles are situated at grain boundaries, as opposed to existing internally within a crystal. Table 1 gives the numbers and location of bubbles observed in Dome C specimens, where 56% of the bubbles observed intersected grain boundaries at 270 m depth, whilst at 500 m all bubbles observed lay at grain boundaries. This difference may be linked to the difference in grain-size at the two depths and the mobility of bubbles during boundary migration. Figure 2a shows a bubble from relatively shallow ice (115m in the Dronning Maud Land core). the particles on the surface are shavings of the carbon glue that was used to stick the specimen down. Visible on the surface, which has been etched, are grain boundaries, many of which intersect at the bubble.
(a) An air bubble from the Dronning Maud Land core (115 m), situated at the intersection of several grain boundaries (scale bar: 500 μm). (b) Micro-bubbles of approximately 1 μm diameter observed whilst etching a specimen from GRIP (1980 m) (scale bar: 20 μm). There is also a filament running along this boundary, although no impurities were detectable. (c) A``rash’’of bubbles near the edge of the core of a Dronning Maud Land specimen (115) (scale bar: 200 μm).
Air bubbles and clathrate hydrates: proportions at grain boundaries (GB)

When deep ice is brought to the surface during drilling, there is a large reduction in the overburden pressure on the core. It is thought that this reduction in pressure allows gases dissolved in the ice to form micro-bubbles, possibly nucleating on dust particles, as the ice relaxes (Reference AlleyAlley and others, 1997; Reference Shoji, Miyamoto, Kipfstuhl, Langway and HondohShoji and others, 2000). In this study, micron-sized bubbles were observed, often occurring at grain boundaries in the deep samples examined. Figure 2b shows typical micro-bubbles seen at a grain boundary during etching at –80˚C; they have a diameter of around 1 μm and the sample is from the Greenland glacial period. It is likely that these bubbles have formed during storage, and their presence at the grain boundaries implies a diffusion of dissolved gases through the lattice to the high density of low-energy sites that defines the grain boundary. Figure 2c shows a ``rash’’ of bubbles found on a sample at the outside edge of the Dronning Maud Land core (115m). It is possible that they are an artefact of the drilling process, with nucleation of the bubbles caused by high stresses placed on the surrounding ice by the cutting blade of the drill.
Clathrate hydrates
As already mentioned, at depths below 1000m in the GRIP core, the formation of air hydrate crystals is expected in the ice, and such crystals can be observed using light microscopy (Reference Shoji, Miyamoto, Kipfstuhl, Langway and HondohShoji and others, 2000). Since clathrate hydrates are unstable at atmospheric pressure and cold room temperatures, they can be expected to decompose soon after exposure by cutting. If they are not decomposed before introduction to the SEM, the presence of a vacuum (approximately 10–9 bar) will ensure their decomposition within minutes unless the temperature is below about –220˚C (Reference Kuhs, Klapproth, Chazallon and HondohKuhs and others, 2000). Since no bubbles exist in the ice below depths of 1500 m, any bubble-like structures observed on surfaces of samples from below this depth are either holes left by the decomposition of clathrate hydrates, or bubbles formed from clathrate hydrate decomposition during core relaxation (possibly with the inclusion of dissolved gases). There were two main types of structure noted in the GRIP samples: globular structures and plate-like structures. the globular structures often looked similar to a bubble impression, but normally also contained ice debris suggesting the remains of an air hydrate crystal which had already partially decomposed before examination and from which the gaseous component had evaporated (Fig. 3a and b). the other globular structures had a more solid appearance, with a ``pocked’’or broken surface suggesting the remains of a solid hydrate crystal which had subsequently decomposed, possibly through a thin layer of ice at the surface (Fig. 3c and d). the globular structures were typically 100–300μm in diameter, with ``pocked’’ specimens (Fig. 3c) tending to be a little smaller. the plate-like structures were seen as thin holes in the surface, typically about 200 μm long, often filled with what appeared to be the decomposed remains of the ice component of the crystal (Fig. 3e and f). Etching the surface revealed that many of these holes had a hexagonal-plate structure, which was confirmed by examination using the light microscope. No elongated (several millimetres long) air hydrate crystals as described by Reference Shoji, Miyamoto, Kipfstuhl, Langway and HondohShoji and others (2000) were noted in the GRIP specimens. Table 1 summarizes the numbers and relative location of hydrate structures noted for the GRIP specimens. Ninety-four per cent of the globular structures observed in the GRIP samples from 1980m were located on grain boundaries, whilst only 4% of the plate-like structures were associated with boundaries. the surface shown in Figure 3g is typical of this distribution. the proportion of both types of structures at boundaries with respect to the total number of structures observed was 46%, a value close to the ratio observed by Reference Uchida, Mae, Hondoh, DuvalandV and LipenkovUchida and others (1993) in the Vostok (Antarctica) core at a similar depth. In the shallower specimens from the GRIP core (1312 m), the ratio of globular structures including both clathrate hydrate remains and bubbles lying at grain boundaries was lower at 65%. This could imply that a significant proportion of the structures observed were secondary clathrates which have fragmented (Reference Kipfstuhl, Pauer, Kuhs and ShojiKipfstuhl and others, 2001) since primary clathrates initially are formed from bubbles which are generally located on grain boundaries.
From left to right and top to bottom. (a) Hole in the surface of GRIP (1980 m) specimen, containing clathrate hydrate remains (scale bar: 100 μm). (b) Inset of (a) (scale bar: 20 μm). (c) Globular clathrate hydrate remains (GRIP, 1312 m) (scale bar: 50 μm). (d) Globular clathrate hydrate remains (GRIP, 1980 m). (e, f) Plate-like clathrate hydrate remains (scale bars: 100 and 200 μm, respectively). (g) Surface (GRIP, 1980 m) showing globular clathrate structures at grain boundaries and plate-like structures in the bulk of grains. the grain boundaries can be seen clearly due to charging effects on the surface (scale bar: 200 μm).

Dust
Dust particles were located on the surfaces of samples from both Antarctica and Greenland. Etching was used to strip away a surface layer and remove most of the cutting debris. X-ray analysis was required to distinguish between any ice debris left on the surface and genuine dust particles. It was not possible to positively identify particles of diameter 50.5 μm using X-ray analysis,so some imaged particles could notbe confirmedas dust. Figure 4ais an example of a particle found in the bulk of a grain from a GRIP specimen from the glacial period. X-ray analysis indicated that it contained: magnesium, aluminium, silicon, chlorine, potassium, calcium and iron. Silicon, usually in conjunction with magnesium and aluminium, was found in 85% of particles from both Greenland and the Antarctic, and indicates that the majority of particles are unlikely to be highly water-soluble. These dust particles may have a pre-melted liquid layer surrounding them, allowing them some mobility in the ice (Reference Rempel, Wettlaufer and WorsterRempel and others,2001). Figure 4b shows a dust particle located at a grainboundary (since the position of the grainboundary could change relative to the position of a dust particle on the surface during etching, any particle within 6 μm of a boundary after1minofetchingat–80˚Cwasconsideredtobelocated on it). the particle contained Ca, Al, Mg, Si and K, and the boundary appears to have a filament running down its centre. No impurities could be detected in this filament; however, its existence suggests that soluble impurities may be present but in quantities below the X-ray analysis detection limit. In this case, the soluble impurity would be available to react with the dust particle at the grain boundary. Figure 4c shows another example of a group of particles found on a boundary, with an enlargement of one of the particles inset.
(a) Dust particle (GRIP, 1980 m) found in the bulk of a grain on the surface (scale bar: 2 μm). (b) Particle at grain boundary (GRIP, 1980 m). the boundary has been etched for 1min at –80˚C and has a filament containing no detectable impurities at its centre. (c) Overview of particles at a grain boundary (GRIP, 1980 m); the inset image shows an enlargement of one of the particles. (d) Section of surface from specimen from GRIP (1980 m; precise depth: 1979.74 m, the centre of a cloudy band and calcium peak), which has also been etched for 1min removing approximately 6 μm from the surface. the bright specks on both the grain boundaries and the bulk of the grains correspond to dust particles, the majority containing silicon. There are also tracks of bubbles corresponding with the grain boundaries (scale bar: 20 μm). the variation in the brightness of the surface is a result of surface charging effects. (e) X-ray spectrum for particle shown in (a). (f) X-ray spectrum for particle shown in (c).

A survey of dust particles of diameter 40.5 μm was made on both the Greenland and Antarctic samples to estimate the relative proportions of particles situated at boundaries and in the bulk of the grains. the search for particles was conducted by etching a layer of 6 μm from the surface of the sample and examining all grain boundaries visible on a surface, then also searching a number of randomly chosen fields for particles. the results of the survey are summarized in Table 2. the distribution of the dust particles on the surface was found to be extremely inhomogeneous. Particles in the bulk were normally found in small clusters, and this was also the case to a lesser extent on grain boundaries. the number of specimens examined in the survey was low, which meant that the discovery of one cluster of particles on an otherwise empty surface could lead to a much higher estimate of the number density of particles in the bulk than was likely to be present in the specimen.
Dust particle survey, particle diameter 40.5 μm
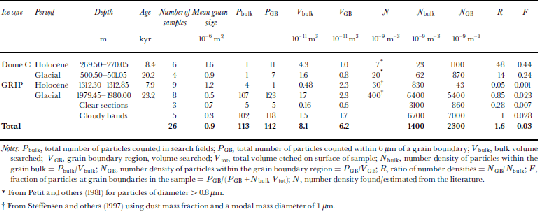
Expected abundances of dust, N, for each sample location were found from Reference Petit, Briat and RoyerPetit and others (1981) for Dome C, and were estimated using dust mass information from Reference Steffensen, Clausen, Hammer, Legrand and AngelisSteffensen and others (1997) for the GRIP core with a modal mass particle diameter of 1 μm (Table 2). the Dome C data are generalized for each climatic period and do not correspond to a single depth in the core. the data are for particles of diameter>0.8 μm; we expect the number density for particles >0.5 μm to be at least twice as great. the values of N bulk are higher for both the Holocene and the last glacial period than the predicted values of Nat both sites. This is in part due to the measurement of different particle diameters for the expected and observed distributions mentioned above; it can also be attributed to localized variations in number densities and the small sample size increasing the impacts of particle clusters on the statistics. the value for the glacial period (6.461012 m–3) is heavily skewed towards the number density found in the cloudy bands (6.761012 m–3) because the volume of ice searched in the cloudy bands was almost 10 times greater than the clear sections. As expected, N bulk is substantially higher in the glacial ice from both cores than from the Holocene, and still higher in the cloudy bands of the GRIP core.
The ratio of the number densities of particles in the grain-boundary region to the number density in the bulk of the ice, R, indicates the relative proportion of particles at the grain boundaries. A value of R close to unity indicates that the number of particles found at the boundary is no higher than expected for a random distribution of particles in the ice. R >1 implies either that some grain boundaries have been pinned by the presence of dust particles which have been situated on the boundary since deposition or that migrating boundaries have, on encountering a dust particle, dragged some of the dust with them.
The values of R in the Dome C samples are 48 and 14, and although these values should be treated with caution due to the low sample number of dust particles observed in the specimens, they indicate that more dust particles are situated on grain boundaries than would be expected in a random distribution. the fraction of dust particles at the grain boundaries, F, is estimated at 0.4 in the Holocene and 0.2 in the glacial samples. for the Greenland samples the numbers look quite different, with values of R < 1 for both the Holocene and glacial clear samples. This indicates the high uncertainties in the observed values, particularly in N bulk. These results, combined with a more reliable result from the cloudy bands, where a greater volume was searched and R = 1, suggest a random distribution of dust particles, with no preference for grain boundaries. This, however, is in contrast with some observed evidence that was discounted from Table 2. Figure 4d shows the surface from a specimen from the GRIP glacial period which was taken from one of the cloudy bands in the core. This specimen contained numerous dust particles both at grain boundaries and in the bulk of the grains. the majority of the particles contained silicon, magnesium and aluminium. the particles were too numerous to include in the survey, but examination of the image revealed that most of the visible dust lay at grain boundaries. It is also interesting to note the small grain-sizes of this specimen. the mean grain area was 1.2610–7 m2, compared to 7610–7m2 on samples from a similar depth but not from cloudy bands which contained fewer dust particles. the small grain-size implies that grain-boundary pinning, probably due to the dust particles, has prevented the growth of the grains. This is further discussed in the following subsection. from the evidence presented, it remains unclear whether a higher proportion of dust lies at grain boundaries in the GRIP core, and further investigation is required to definitively answer this.
Grain-boundary pinning
Particles have been observed located at ``bends’’ in grain boundaries, directly indicating the role that they may play in inhibiting grain-boundary migration. Figure 5a shows an example of particles found on a bend which appears as if the boundary has been held back by the particles’ presence. Figure 5b shows a bubble which similarly appears to be inhibiting boundary migration. In some cases, kinks in boundaries are observed which do not have any obvious cause (Fig. 5c), but since the image is a two-dimensional section of the boundary, it is quite possible that there may have been some structure pinning the boundary which has not been intersected by the surface. Figure 5d shows a kink in a boundary from a GRIP Holocene sample which coincides with a cluster of micro-bubbles. If micro-bubble formation has been nucleated by dust particles in this case, the bubbles in this image may indicate the presence of dust particles pinning the boundary immediately above or below the surface of the sample.
(a) Dust particles at a kink in a grain boundary (Dome C, 501m) (scale bar:10 μm). (b) A bubble apparently involved in pinning a grain boundary (Dronning Maud Land, 115 m) (scale bar: 100 μm). (c) Kink in grain boundary without obvious reason (Dome C, 501m) (scale bar: 20 μm). (d) Micro-bubbles located at a kink in a grain boundary (GRIP, 1312 m) (scale bar: 20 μm).

Reference Alley, Perepezko and BentleyAlley and others (1986b) stated that for clear ice the concentration of micro-particles was not high enough to cause significant reduction in grain growth rates if the particles are immobile, and the same was the case for bubbles where they could move rapidly by diffusion of ice through the vapour phase. for cloudy bands where there is a high concentration of dust particles, it was found that it is possible for a grain boundary to be effectively pinned in place by the dust. At GRIP the values of R suggest that the grain boundaries are able to break free from most dust encountered. However, the values of R for the Dome C samples indicate that at this site either some boundaries are being pinned by grain boundaries or some particles may be ``caught’’ by grain boundaries during their migration. This discrepancy may be linked to the temperature difference of the two sites altering the mobility of the grain boundaries, and a difference in the size distributions and hence drag of the particles. Work byReference Weiss, Vidot, Gay, Arnaud, Duval and PetitWeiss and others (2002) indicates that variations in grain-size in the Dome C core can be explained by pinning by immobile micro-particles if a significant proportion are located at grain boundaries. In the case of a particle being trapped by a grain boundary and normal boundary migration continuing, then the force driving boundary migration is less than the force required to separate the particle from the boundary and implies the particle has a degree of mobility.This could be possible if the particle were surrounded by a pre-melted layer (Reference Rempel, Wettlaufer and WorsterRempel and others, 2001).
Soluble impurities
Soluble impurities were also located on some specimen surfaces. the grain boundaries and triple junction shown in Figure 6a were found to contain both sodium and chlorine using X-ray analysis (Fig. 6e) and are from the Dronning Maud Land core at 115m. the grain boundaries, which have not been etched, are 1–2 μm thick and are darker than the surrounding ice. This was typical of the majority of grain boundaries on this specimen but was not observed in other samples from the same depth and site. the presence of salts at grain boundaries is not unexpected in samples where the summer temperature is above the NaCl eutectic point (–23˚C). the image adds to the body of evidence suggesting that salts can exist as liquids outside the ice grains, although in this case they are not specifically confined to the triple junctions. Figure 6b shows an example of trace quantities of sodium and chlorine detected at a triple junction in a Dome C glacial sample. This was not found to be typical of triple junctions from this depth, most of which contained no detectable impurity, but it does suggest that at least some of the sodium chloride in the core could be residing in veins at triple junctions. It is also likely that a significant proportion of the salts will be incorporated into the ice lattice by this depth, and further observation is required to quantitatively estimate this distribution.
(a) Triple junction and grain boundaries (Dronning Maud Land, 115 m) containing sodium and chlorine (scale bar: 20 μm). (b) Triple junction (Dome C, 501m) found to contain traces of sodium and chlorine (scale bar: 50 μm). (c) Grain boundaries (GRIP, 1312 m) with filaments in which no impurities could be detected, before etching (scale bar: 20 μm). (d) Grain boundary pictured in (c) after 6 min of etching at –80˚C (approximately 36 μm of ice removed); traces of chlorine were detected in the filament which is indicated on the image. the dark circular structure is a bubble revealed during the etching. (e) X-ray spectrum from grain boundary shown in (a) containing sodium and chlorine. (f) X-ray spectrum from filament in (d) contains chlorine; carbon is also present, but could be contamination from the glue.

By pre-etching and etching samples from the GRIP core, Cullen and Baker (2000) found sodium chloride concentrated into filaments at grain boundaries. In this study, similar filaments were noted in both the Greenland and Antarctic samples after brief periods of etching (1–3 min at –80˚C), although no impurities were detectable by X-ray analysis. Further etching of these boundaries concentrated the contents to detectable levels: Figure 6c and d show such a filament before and after etching from the GRIP core at a 1312 m depth (the top edge of a bubble has been revealed during the etching). Low levels of chlorine were detected in the filament (Fig. 6f), which could indicate the presence of hydrochloric acid or sodium chloride in the case where the sodium is still not detectable. Traces of carbon were also found but are likely to be linked to the carbon glue used to attach the sample.
Whilst we have observed soluble impurities in isolated cases so far in this study, a definitive picture of soluble-impurity location has yet to be established. Surface etching, as used in this work and that by Cullen and Baker (2000), will be a useful tool (despite questions of impurity mobility) for further investigation into the distribution of soluble impurities. Without etching, detection of impurity has proved far more difficult.
Conclusion
Many interesting surface features can be observed at high resolution in the SEM, giving insights into physical processes. However, the greatest potential of SEM is to simultaneously image and analyze small areas to assess the localization of impurities. the next step will be to examine the soluble impurity distribution at grain boundaries and triple junctions.
Acknowledgements
This work is contribution No. 38 to the ``European Project for Ice Coring in Antarctica’’ (EPICA), a joint European Science Foundation (ESF)/European Commission (EC) scientific programme, funded by the EC under the Environment and Climate Programme and by national contributions from Belgium, Denmark, France, Germany, Italy, the Netherlands, Norway, Sweden, Switzerland and the U.K.



