INTRODUCTION
It has now been well established experimentally that by directing ultra-intense laser beams at thin metallic targets, protons from hydrocarbon surface contaminants can be accelerated from the rear surface to multi-MeV energies (Clark et al., Reference Clark, Krushelnick, Zepf, Beg, Tatarakis, Machacek, Santala, Watts, Norreys and Dangor2000; Hatchett et al., Reference Hatchett, Brown, Cowan, Henry, Johnson, Key, Koch, Langdon, Lasinski, Lee, Mackinnon, Pennington, Perry, Phillips, Roth, Sangster, Singh, Snavely, Stoyer, Wilks and Yasuike2000; Snavely et al., Reference Snavely, Key, Hatchett, Cowan, Roth, Phillips, Stoyer, Henry, Sangster, Singh, Wilks, MacKinnon, Offenberger, Pennington, Yasuike, Langdon, Lasinski, Johnson, Perry and Campbell2000; Wilks et al., Reference Wilks, Langdon, Cowan, Roth, Singh, Hatchett, Key, Pennington, MacKinnon and Snavely2001; Borghesi et al., Reference Borghesi, Campbell, Schiavi, Willi, Mackinnon, Hicks, Patel, Gizzi, Galimberti and Clarke2002, Reference Borghesi, Mackinnon, Campbell, Hicks, Kar, Patel, Price, Romagnani, Schiavi and Willi2004; Pegoraro et al., Reference Pegoraro, Atzeni, Borghesi, Bulanov, Esirkepov, Honrubia, Kato, Khoroshkov, Nishihara, Tajima, Temporal and Willi2004; Robson et al., Reference Robson, Simpson, Clarke, Ledingham, Lindau, Lundh, McCanny, Mora, Neely, Wahlstrom, Zepf and McKenna2007; Badziak et al., Reference Badziak, Jabłoński, Parys, Szydłowski, Fuchs and Mancic2010). This method of acceleration has potential to one day supersede conventional forms, such as by using cyclotrons and synchrotrons, and one application of note could arise in radiotherapy. Currently, the gantries used for precisely directing beams of protons and ions into patients from various directions can be very bulky and expensive. Laser acceleration could in theory be able to reduce the footprint of such machines for radiotherapy (Bulanov & Khoroshkov, Reference Bulanov and Khoroshkov2002); however there is much progress to be made before this can be made a reality.
In many laser-plasma experiments (Breschi et al., Reference Breschi, Borghesi, Galimberti, Giulietti, Gizzi and Romagnani2004; Clarke et al., Reference Clarke, Simpson, Kar, Green, Bellei, Carroll, Dromey, Kneip, Markey, McKenna, Murphy, Nagel, Willingale and Zepf2008; Schollmeier et al., Reference Schollmeier, Harres, Nürnberg, Blazevic, Audebert, Brambrink, Fernandez, Flippo, Gautier, Geissel, Hegelich, Schreiber and Roth2008), stacks of radiochromic film (RCF) have been used as a method of proton detection with high spatial resolution and without the need for processing. In particular, GafChromic film models HD-810 and MD-55-2 tend to be used, both having the same active ingredient but in differing amounts, hence they have differing sensitivity. From a stack of RCF alone, it is possible to deconvolute the initial proton spectrum from the energy deposition (or dose) profile, if the dose due to extraneous radiation (i.e., X-rays and electrons) can be sufficiently excluded. Notable methods of RCF spectroscopy are described by Nürnberg et al. (Reference Nürnberg, Schollmeier, Brambrink, Blazevic, Carroll, Flippo, Gautier, Geissel, Harres, Hegelich, Lundh, Markey, McKenna, Neely, Schreiber and Roth2009), Breschi et al. (Reference Breschi, Borghesi, Galimberti, Giulietti, Gizzi and Romagnani2004), and Hey et al. (Reference Hey, Key, Mackinnon, MacPhee, Patel, Freeman, Van Woerkom and Castaneda2008), and often rely on stopping powers for the RCF active layers calculated by the SRIM program (Ziegler, Reference Ziegler2004) to determine the relative sensitivity of each film to protons of different energies and for calibration dose calculations.
To date, some published RCF spectroscopy methods are limited in their dosimetric accuracy due to two factors: the lack of an accurate dose calibration of RCF in a proton beam traceable to a primary standard, and the assumption that RCF dose response is independent of proton energy. It has been shown that there is a quenching of the film's response in the Bragg peak (BP), which is attributed to the significant increase in linear energy transfer (LET) (Vatnitsky, Reference Vatnitsky1997; Piermattei et al., Reference Piermattei, Miceli, Azario, Fidanzio, Canne, De Angelis, Onori, Pacilio, Petetti, Raffaele and Sabini2000). Recent work (Kirby et al., Reference Kirby, Green, Palmans, Hugtenburg, Wojnecki and Parker2010) has quantified the relative effectiveness (RE) of GafChromic film by comparing its dose response with absolute dosimetry using an ion chamber at different depths in 29 and 15 MeV proton beams. RE is defined here as the ratio of doses between the calibration and experimental beam qualities, which result in the same optical density (OD). At energies below 3 MeV, the response can be at least 25% less than for 20 MeV protons and failing to account for this will lead to a significant underestimation of proton fluence at low energies in RCF spectroscopy. Considering that the vast majority of protons produced in target normal sheath acceleration (TNSA) thus far have energies of only several MeV or less, this effect is expected to be significant when integrated over the whole spectrum and so its magnitude is investigated in this instance.
This work has three main objectives: to bring “dose-to-water” (D w) radiotherapy standards into the field of RCF spectroscopy; to use Monte Carlo simulations of RCF dose response in order to extract proton spectra from RCF depth-dose measurements; and to correct this spectrum for energy losses in the filter placed in front of the RCF stack. The filter is usually an Al foil in order to protect the stack from laser light, target debris, soft X-rays, and heavy ions. A correction to the spectrum was devised using the Monte Carlo code FLUKA (Ferrari et al., Reference Ferrari, Sala, Fasso and Ranft2005; Battistoni et al., Reference Battistoni, Muraro, Sala, Cerutti, Ferrari, Roesler, Fasso and Ranft2007) and a matrix inversion technique. A relatively simple FORTRAN routine combined all steps of the spectroscopic analysis.
METHOD
GafChromic Film Calibration
In order to obtain accurate dose information from RCF, a calibration of film OD versus absorbed dose must be carried out ideally using the same radiation quality as for experimental exposures. For spectra, which vary from shot to shot and with typical energy spreads of about 100% from laser-plasma interactions, a calibration in a controlled but representative radiation field is virtually impossible. It was decided that the RCF should be calibrated with a reliable and reproducible setup in a nominal 29 MeV proton beam from the Birmingham cyclotron.
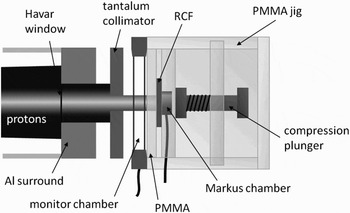
The irradiation setup consisted of a PTW plane-parallel transmission ion chamber (model 7862) used as a monitor chamber, a PMMA absorber of thickness 1.97 mm, a “PTW” brand Markus ionization chamber, and an in-house PMMA jig to hold all the components in place (Fig. 1). The Markus chamber is calibrated by the National Physical Laboratory (NPL) in Teddington, UK and the 60Co dose-to-water calibration factor, N D,w was used in conjunction with a beam quality correction factor, k Q. This links all the dosimetry performed in this work to a primary standard for absorbed dose-to-water measurements, in accordance with the latest IAEA recommendations for radiotherapy in report TRS-398 (IAEA, 2000).
Schematic of the irradiation setup for GafChromic film calibration with the Birmingham cyclotron.

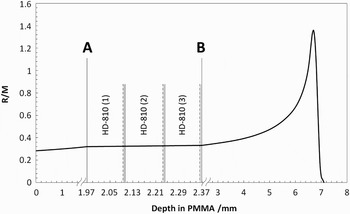
The cyclotron beam energy was tuned to give 29 MeV protons, and simulations previously made with FLUKA (Kirby et al., Reference Kirby, Green, Palmans, Hugtenburg, Wojnecki and Parker2010) found that energy of 29.15 MeV reproduced a depth-dose curve with best agreement to Markus chamber measurements. The ratio of Markus reading to monitor chamber reading (R/M) at 1.97 mm depth (referred to as depth A) was measured with a statistical accuracy of < 0.1%, allowing this depth-dose to be accurately known for any irradiation without the Markus chamber's presence. At this depth were positioned the RCF pieces for calibration with the Markus chamber directly behind. The energy in the film active layers is calculated to be 23.0 ± 1.0 MeV. The uncertainty accounts for beam energy spread as well as the small difference at each film depth. The HD-810 films were positioned with the active layer closest to the Markus chamber, while for EBT the active layers are central in the film. In total, three sheets of HD-810 and 2 of EBT were calibrated (lot numbers Q2435H810 and 47207-03I) and 11 pieces 2.5 × 2.5 cm2 were taken from each sheet of HD-810 and 12 from each sheet of EBT. A film from each sheet (of the same type) was placed in a stack at depth A. The ratio of R/M was measured behind the films for each irradiation (depth B), and a linear interpolation between depths A and B was used to determine the R/M value at the center of the active layer(s) in each film (Fig. 2). This was then multiplied by the monitor chamber reading for each irradiation to give R at the relevant depth, which is converted to dose-to-water by the following formula:

The factor k TP corrects for air temperature and pressure in the Markus chamber deviating from normal atmospheric conditions and k ion corrects for the loss of current signal due to ion recombination in the chamber. The dose rate used was 1.2 Gy s−1 that yields a value of k ion of 1.008 based on recombination parameters used previously in Kirby et al. (Reference Kirby, Green, Palmans, Hugtenburg, Wojnecki and Parker2010), which were originally obtained from Palmans et al. (Reference Palmans, Thomas and Kacperek2006). The total uncertainty at the 1σ level in the determined dose in the RCF layers was estimated to be 3.5%.
The 29 MeV depth-dose curve in terms of R/M, indicating the position of HD-810 films.

The films were read out using a Nikon Super Coolscan 5000 ED 48-bit transmission mode scanner with an array of red, green, and blue LEDs as its light source. Having no ultraviolet component, the films stay cooler during read-out than with a traditional fluorescent lamp used in most other CCD based (i.e., flat-bed) scanners. Butson et al. (Reference Butson, Yu, Cheung and Metcalfe2003) showed that GafChromic film is sensitive to ultraviolet exposure and recommends avoiding it where possible, and investigations by Klassen et al. (Reference Klassen, van der Zwan and Cygler1997) imply that the absorption spectrum of the active component shifts reversibly to shorter wavelengths with higher film temperature. This temperature effect (present with many flat-bed scanners) can be overcome by taking several scans and rejecting the first few (Lynch et al., Reference Lynch, Kozelka, Ranade, Li, Simon and Dempsey2006; Paelinck et al., Reference Paelinck, Neve and Wagter2007) as by then the scanner lamp has warmed up. The Nikon scanner avoids the need for this and with its relatively small scanning field (38 × 25 mm, optimized for 35 mm film slides) also does not require a spatial correction map for non-uniformity of the scanning light field. This effect is inherent to A4 and larger flat-bed scanners due to the higher intensity of scattered light in the centre of the field (Lynch et al. Reference Lynch, Kozelka, Ranade, Li, Simon and Dempsey2006; Ferreira et al., Reference Ferreira, Lopes and Capela2009).
In all cases, films were left for at least seven days before scanning to allow for the darkening to complete as much as possible, well exceeding the 48 hours recommended by Butson et al. (Reference Butson, Yu, Cheung and Metcalfe2003). The OD values were calculated by the following relationship:
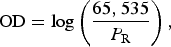
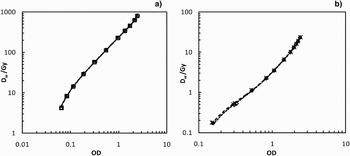
where P R is the pixel value in the red channel of the scanned image and 65,535 represents the full transmission value giving a maximum theoretical OD of 4.8. The calibration curves of D w as a function of OD for all films were fitted using the fifth order polynomials and are shown in Figure 3.
Calibration log plots of D w versus OD for (a) HD-810, sheets 1–3 (circles, squares and triangles respectively) and (b) EBT, sheets 1 and 2 (asterisks and diamonds). Each set of points has a fitted fifth order polynomial, although due to excellent consistency between sheets these fits are virtually indistinguishable.

EXPERIMENTAL METHOD
The irradiations were performed with the TARANIS Nd:Glass multi-terawatt laser using chirped pulse amplification (CPA) at Queens University Belfast. The laser is described in more detail by Dzelzainis et al. (Reference Dzelzainis, Nersisyan, Riley, Romagnani, Ahmed, Bigongiari, Borghesi, Doria, Dromey, Makita, White, Kar, Marlow, Ramakrishna, Sarri, Zaka-Ul-Islam, Zepf and Lewis2010).
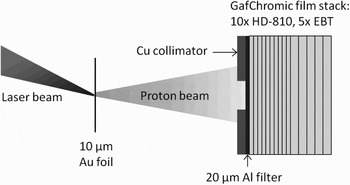
The laser was focused by an f/3 parabolic mirror onto a 10 µm Au foil, p-polarized, at an angle of 25°. An RCF stack was placed 2.5 cm away along the axis of the target normal. A 20 µm Al foil was used as a filter for soft X-rays, heavy ions, debris, and laser light. A Cu collimator of 1 cm diameter was placed in front of the stack in order for the spectrum deconvolution method to be valid, as FLUKA calculations simulated a parallel beam with a scoring plane much larger than the source diameter. It was important therefore to collimate the laser-proton source so that the plane integrated depth-dose measured was not affected by divergence causing protons to avoid the RCF layers toward the rear of the stack. As a consequence, some of the wider angle emitted protons would not be detected or accounted for in the spectroscopic analysis. By integrating the dose over the area of the beam spot, the depth dose profile of this divergent beam was equivalent to that of a parallel beam with the same energy spectrum. The experimental set-up is shown in Figure 4.
Schematic of the irradiation setup with the TARANIS laser, indicating the usual RCF stack configuration.

The RCF stack was arranged so that HD-810 was present until the expected range of the highest energy protons, and then layers of the more sensitive EBT followed, which would be able to measure the comparably small electron/X-ray background more accurately. The configuration consisted of 10 HD-810 films followed by 5 EBT films. MD-V2-55Footnote 1 was avoided because it has double the thickness of HD-810, which would result in fewer depth-dose measurements. This resulted in lower signal-to-noise near the back of the stack where proton dose was much lower, but still within the dynamic range of the film.
MONTE CARLO METHOD
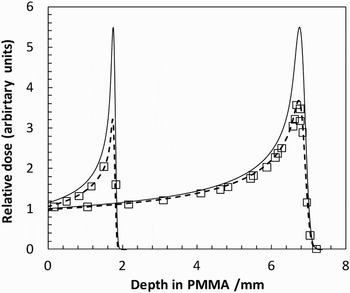
FLUKA is a multi-purpose Monte Carlo radiation transport code capable of simulating virtually any type of particle, including protons, and heavier ions. It is gaining popularity as a useful tool in hadron radiotherapy and can be modified by editing special user routines and recompiling a new FLUKA executable. The COMSCW subroutine can be customized in order to modify the amount of energy deposited scored by a specific tally (called USRBINs), and means that energy dependent response functions can be incorporated into dose scoring. Hence the RE of MD-V2-55 film as a function of energy given by Kirby et al. (Reference Kirby, Green, Palmans, Hugtenburg, Wojnecki and Parker2010) can be incorporated, therefore simulating the depth-dose curves that would be measured using this type of RCF. There are structural differences between MD-V2-55 and HD-810 however the composition of the active layer is identical, so the RE for protons of both models can be safely assumed to be the same. Figure 5 shows the FLUKA simulated depth-dose curves for 15 and 29 MeV proton beams in PMMA from the Birmingham Cyclotron, with full energy deposition and with the RE response function incorporated. This is compared to dose measurements made at various depths with GafChromic MD-V2-55 in order to confirm the accuracy of the response function, which is given below:

where E is the proton energy, and all other parameters are adjusted in order to produce a best weighted sigmoidal fit to the RE data in Kirby et al. (Reference Kirby, Green, Palmans, Hugtenburg, Wojnecki and Parker2010). The RE data in that work was relative to ion chamber dose however, so the data was recalculated to be relative to FLUKA simulated dose instead before the function was fitted. This was necessary mainly due to the small discrepancy between FLUKA and measurement of the height of the BP. The fit parameters used were RE0 = 0.536, ΔRE = 0.478, C = 4.3 and log E m = 0.56. This deliberately results in RE = 1 for the calibration energy of 23.0 MeV.
FLUKA simulated depth-dose curves for 15 and 29 MeV protons in PMMA, with full energy deposition (solid lines) and with modified energy deposition (dashed lines) to simulate the RE of GafChromic MD-V2-55 (squares) taken from Kirby et al. (Reference Kirby, Green, Palmans, Hugtenburg, Wojnecki and Parker2010).

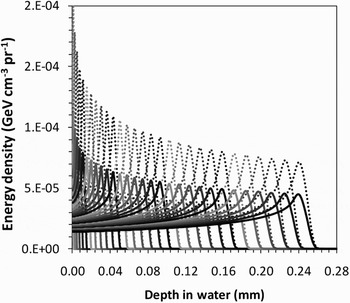
FLUKA was then used to generate a library of proton depth-response curves in water for energies from 0–15 MeV, in 0.5 MeV steps using the RE function (Fig. 6). The proton source was defined as a pencil beam with a uniform energy distribution from 0–15 MeV, and the deposited energy density was scored in a thin cylindrical mesh of thickness 5 µm and radius of 5 cm. Rather than produce 30 separate simulations for each energy bin, a more elegant method was found by modifying the COMSCW routine yet again and specifying 30 unique USRBIN cards each with same mesh geometry. For every energy deposition event during run-time, the COMSCW routine would determine the starting energy of the tracked proton and assign the energy deposition scored to the USRBIN dedicated to the relevant energy bin. Note that in FLUKA, the units of deposited energy density are in GeV cm−3 per primary proton (pr−1). For later comparison, a library of full energy deposition curves was also produced to investigate the effect of simulating the RE of HD-810.
FLUKA library of RE simulated depth-response curves (solid lines) in water for 0-15 MeV protons, in 0.5 MeV steps. Corresponding depth-dose curves without the response function are shown (dotted lines) to illustrate its magnitude.

Regarding physics options in FLUKA, secondary electrons were turned off, so the fractional energy-loss was set to only 2% for protons in order to obtain a smooth depth-dose curve. Nuclear interactions were dealt with as per the default options in FLUKA with PEANUT, which uses parameterizations of cross-section data at these relatively low energies. Transport of secondary neutrons and photons was turned off as their dose is physically insignificant for these low proton energies.
As the last part of the spectrum deconvolution process, FLUKA was also used to generate a matrix, M, to represent the degradation of the proton energy spectrum after passing through a 20 µm Al foil. Each value in the matrix represented a normalized bin height after the energy loss in the foil. The i variable represented a transmitted energy bin and j the initial energy bin. A series of 30 virtual beams were set up with the same top-hat distribution ranging from 0–15 MeV in 0.5 MeV steps. For each beam, the transmitted spectrum was scored on the rear surface of the Al foil. Any values with an uncertainty greater than a few percent were omitted and the remaining bins renormalized as including them could lead to large oscillations after matrix inversion. This only occurred in bins with a relatively negligible number of protons. To verify this inverted matrix, a simulation was performed with a completely uniform spectrum from 0–15 MeV through a 20 µm Al foil and the transmitted spectrum was matrix multiplied by M−1 as a test to reproduce the initially flat spectrum. For energy bins above 1 MeV, the mean deviation from the initial spectrum was 0.15% and the maximum was 0.58%. In the two energy bins below 1 MeV, the data is lost as all the protons stop in the foil.
SPECTRUM SEARCH ALGORITHM
First, the RCF depth doses were integrated over beam area in order for the FLUKA pencil beam simulations to be applicable. As the real situation was a diverging beam, the region of interest (ROI) used for analysis was carefully increased for each successive film so that a constant proton fluence was theoretically maintained in the ROI. The front film's ROI was determined by using the threshold tool in ImageJ (National Institute of Health, Bethesda, Maryland) to include pixels above a darkness threshold resulting in the maximum integrated dose to neglect influence from the scattered low dose “halo.” The sensitivity of decreasing the ROI threshold from 75% to 25% of the mean ROI dose was at worst a 1.5% reduction in integrated dose, and so any potential bias from poorly selecting subsequent film ROI was very small. The mean EBT area-integrated dose was subtracted as electron/X-ray background from the HD-810 film doses. The OD of this background for EBT was around 2.1 and 1.9 for shots 1 and 2, respectively, and the corresponding doses would equate to an OD of only around 0.12 for HD810.
Multiplying the mean doses by the measurement area and by the RCF active layer density yielded units of J cm−1, i.e., total energy absorbed per unit depth in the RCF stack, denoted by dE/dx|RCF (x). The FLUKA depth-doses (in GeV cm−3 pr−1) were then converted to J cm−1 pr−1 by multiplying by scoring area and the conversion factor 1.6022 × 10⁻¹⁰ J GeV−1 and are denoted by a two-dimensional array of dE/[dx*pr]|MC (E, x). In terms of units, it is clear that division of the former by the latter in the correct way will yield the number of protons.
The FORTRAN routine written to solve for the spectra would first read in the RCF depths and doses along with the FLUKA BP library. It ascertains the depth of each BP, and also the range of each energy bin by finding the depth at which the dose falls to 10% of the BP value. It calculates interpolated doses at the depth of each BP in the library using a cubic spline routine, so that each energy bin has a similar importance in the search algorithm. These interpolated doses (along with original RCF doses) form the new set of “measured” depth doses.
The routine then searches for the lowest energy with a range exceeding the last RCF depth, and divides dE/dx |RCF by dE/[dx*pr]|MC for this energy at this depth, giving the number of protons for the highest energy bin. The rest of the spectrum is initialized at this value, and a direct search takes place by modifying each energy bin in turn in order from high to low in order to find a least squares solution. The resulting depth-dose curve associated with the spectrum is evaluated at each iteration and compared to the measured values. The routine then proceeds for as many passes as required before a stable solution is found, with the step size reducing on each pass.
The spectrum is then multiplied by M−1 to reverse the effect of energy losses in the Al foil. The (generalized) pseudo- inverse matrix was obtained by using the geninv function in MathCAD® 14, as the true inverse could not be found as M had a determinant of zero.
Uncertainty propagation was performed by repeating the calculation for 1000 randomly modified RCF dose sets (within uncertainties) to obtain a mean spectrum and uncertainty for each energy bin.
RESULTS
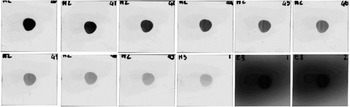
The data from two laser shots were used for analysis. Shot 1 recorded an estimated laser energy on target of 7.1 J and shot 2 recorded 7.8 J, with pulse lengths of about 550 and 600 fs, respectively. The estimated intensity was around 1.6 × 10¹⁹ W cm−2 in each shot and hence the maximum proton energy in each shot should be similar. Figure 7 shows the scanned films from the RCF stack for shot 2. The RCF depth doses are shown in Figure 8 along with the solved depth-dose curves produced by the FORTRAN routine. Note that the last point for shot 1 is from the first EBT film in the stack, which showed significant dose above the background (an OD of 2.35 compared to 2.13). All other EBT films after average background subtraction gave doses close enough to zero (i.e., so that zero was within their uncertainties) to be deemed beyond the range of the highest energy protons.
From left-to-right, top-to-bottom are the HD-810 films from shot 2 in order followed by the first two subsequent EBT films in the stack. Images are the extracted red channel presented in grayscale.

The measured values of dE/dx|RCF from HD-810 films after subtraction of electron and X-ray background measured by EBT films for shot 1 (squares) and shot 2 (diamonds). Solved depth-dose curves produced by the spectroscopic algorithm are also shown for shot 1 (dotted line) and shot 2 (dashed line). RCF thicknesses have been converted to equivalent depth in water.

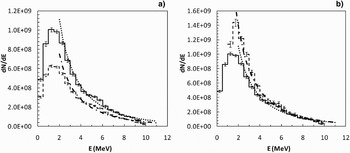
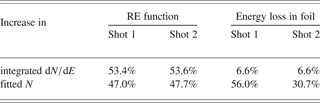
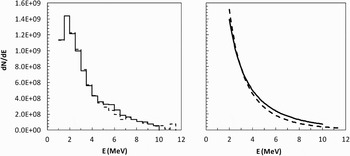
RCF data for both shots were processed by the FORTRAN routine using both the RE-simulated and full energy deposition BP libraries for comparison, and the spectra were matrix multiplied (as one-dimensional matrices in i) by M−1 to obtain the final corrected spectra. Figure 9a compares the effect of including the RE function, and Figure 9b the effect of correcting for energy losses in the Al foil. It was assumed that the proton spectrum followed a one-dimensional Maxwellian distribution and N and kT were varied to give a weighted fit. The parameter N is representative of the total number of protons, and so the effect on N of these improvements as well as on the total spectrum integrated over energy is shown in Table 1.
Plot (a) shows a comparison of proton spectra for shot 2 calculated using the RE response of HD-810 (solid line) and without, i.e., full energy deposition (dashed line). Plot (b) then compares the former spectrum (again, solid line) before and after (dashed line) multiplication by M−1 to correct for energy losses in the Al foil. All data were weight-fitted to a Maxwellian distribution (thicker dotted and dot-dashed lines).

Percentage increases in total integrated dN/dE, as well as N derived from the fitted Maxwellian distribution for both shots, occurring as a result of including the RE function of HD-810 and correcting for energy losses in the Al foil
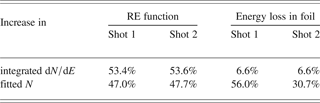
It is clear from both shots that by including the RE function of HD-810 that around 50% more protons are estimated in total. The matrix multiplication should leave the total integrated number unchanged, as it can not possibly give any information regarding protons which stopped in the foil. Its purpose is to calculate the up-shift of protons to higher energies, and the energy bins 0-1 MeV are empty in Figure 9b because all of these protons are stopped by the foil. However it appears that 6.6% extra protons appear, which will be due to uncertainties in M combined with uncertainties in the inversion process. This level of uncertainty is acceptable given that the resultant changes to the spectra correspond to large increases in N of 56% and 31%, respectively. The difference between these values is likely due to the sensitivity of N to small differences at low proton energies.
The final corrected spectra for shots 1 and 2 are shown in Figure 10. They show maximum proton energies of 11.5 MeV and 10 MeV, respectively, which concurs with the difference in range of the RCF depth-doses shown in Figure 7. Values of N and kT for weighted Maxwellian fits are given but these only represent the central portion of the beam which was transmitted through the collimator, i.e., inside a divergence half-angle of about 11°. Typically these sources have an angular energy distribution such that a higher proportion of low energy protons are emitted at wider angles than high energy protons. This may account for what appears to be a smaller proportion of low energy protons in the measured spectrum than predicted by the Maxwellian model.
Final corrected spectra for shot 1 (dashed line) and shot 2 (solid line). Due to the similarity of the spectra, for clarity the Maxwellian fits are presented separately.

CONCLUSIONS
Measurements traceable to a primary standard for absorbed dose-to-water used in radiotherapy were applied to the calibration of GafChromic HD-810 and EBT at a proton energy of 23.0 ± 1.0 MeV. The RE of HD-810 as a function of proton energy was implemented into Monte Carlo depth-response curves in water using the FLUKA code, and a BP library for proton energies 0–15 MeV was generated. These depth-dose curves were iteratively summed by a FORTRAN routine using a direct search algorithm to solve for the measured RCF depth-dose. Using a separate library of standard depth-dose curves, it was found that the effect of including the RE function accounted for an increase in N by about 50%. Due to the collimation of the beam, the preferentially lower energy, wide-angle emitted protons were not included in the analysis and so it is possible that inclusion of these protons would lead to an even larger percentage increase. The additional correction for proton energy losses in a 20 µm Al foil was found to give further increases in N of 31% and 56% for each shot.
In conclusion, failure to consider the relative response of RCF to lower proton energies and neglecting energy losses in a RCF stack filter foil can potentially lead to significant underestimates of the total number of protons in RCF spectroscopy. It is expected however that these effects will be reduced for higher energy spectra.
ACKNOWLEDGMENTS
The authors wish to thank Mike Smith for operating the Birmingham cyclotron. This work was supported by EPSRC (grant no EP/E035728/1) and the LIBRA consortium.