INTRODUCTION
Extensive forests of central Africa are unusual in the tropics in having a single very abundant species, much like temperate and boreal forests (Hart Reference HART1990, Lebrun & Gilbert Reference LEBRUN and GILBERT1954, Richards Reference RICHARDS1996). The most widespread of these monodominant forests is called mbau from the common name for Gilbertiodendron dewevrei. Forests dominated by this species can be found in patches ranging from a hectare to several thousand hectares (Hart Reference HART1990, Hart et al. Reference HART, HART and MURPHY1989, Lebrun & Gilbert Reference LEBRUN and GILBERT1954). Mixed forests, which have several common species and little or no G. dewevrei, surround the mbau patches.
We have been studying the boundary between mbau and mixed forest in the Ituri forest of eastern Democratic Republic of Congo and documenting the composition of the two types (Makana et al. Reference MAKANA, HART, HIBBS, CONDIT, Losos and Leigh2004a). Gilbertiodendron dewevrei – the mbau tree – comprises 63% of the basal area in some patches, but other equally large patches have no mbau and are dominated instead by Julbernardia seretii and Cynometra alexandri. The dominance of mbau means that it is key to forest structure and productivity, and shifts in its range could have implications for the diverse central African flora and fauna (Torti et al. Reference TORTI, COLEY and KURSAR2001). Indeed, Africa has over 30% of the world's tropical forests, so region-wide changes in biomass and community structure could matter at a global scale.
In recent years, several studies of forest dynamics have shown increases in tree turnover rates and above-ground biomass in tropical forests (Baker et al. Reference BAKER, PHILLIPS, MALHI, ALMEIDA, ARROYO, FIORE, ERWIN, HIGUCHI, KILLEEN, LAURANCE, LAURANCE, LEWIS, MONTEAGUDO, NEILL, NUNEZ VARGAS, PITMAN, SILVA and VASQUEZ MARTINEZ2004, Chave et al. Reference CHAVE, CONDIT, MULLER-LANDAU, THOMAS, ASHTON, BUNYAVEJCHEWIN, CO, DATTARAJA, DAVIES, ESUFALI, EWANGO, FEELEY, FOSTER, GUNATILLEKE, GUNATILLEKE, HALL, HART, HERNÁNDEZ, HUBBELL, ITOH, KIRATIPRAYOON, LAFRANKIE, LAO, MAKANA, NOOR, KASSIM, SAMPER, SUKUMAR, SURESH, TAN, THOMPSON, TONGCO, VALENCIA, VALLEJO, VILLA, YAMAKURA, ZIMMERMAN and LOSOS2008, Lewis et al. Reference LEWIS, PHILLIPS, BAKER, LLOYD, MALHI, ALMEIDA, HIGUCHI, LAURANCE, NEILL, SILVA, TERBORGH, LEZAMA, MARTINEZ, BROWN, CHAVE, KUEBLER, VARGAS and VINCETI2004a, Phillips & Gentry Reference PHILLIPS and GENTRY1994, Phillips et al. Reference PHILLIPS, BAKER, ARROYO, HIGUCHI, KILLEEN, LAURANCE, LEWIS, LLOYD, MALHI, MONTEAGUDO, NEILL, VARGAS, SILVA, TERBORGH, MARTINEZ, ALEXIADES, ALMEIDA, BROWN, CHAVE, COMISKEY, CZIMCZIK, FIORE, ERWIN, KUEBLER, LAURANCE, NASCIMENTO, OLIVIER, PALACIOS, PATINO, PITMAN, QUESADA, SALIDAS, LEZAMA and VINCETI2004). African forests have now been included in these analyses and likewise show biomass gains (Lewis et al. Reference LEWIS, LOPEZ-GONZALEZ, SONKÉ, AFFUM-BAFFOE, BAKER, OJO, PHILLIPS, REITSMA, WHITE, COMISKEY, DJUIKOUO, EWANGO, FELDPAUSCH, HAMILTON, GLOOR, HART, HLADIK, LLOYD, LOVETT, MAKANA, MALHI, MBAGO, NDANGALASI, PEACOCK, PEH, SHEIL, SUNDERLAND, SWAINE, TAPLIN, TAYLOR, THOMAS, VOTERE and WÖLL2009). These shifts may result from global climatic change, including elevated atmospheric CO2, temperature or increasing drought (Condit et al. Reference CONDIT, HUBBELL and FOSTER1996, Lewis et al. Reference LEWIS, MALHI and PHILLIPS2004b, Reference LEWIS, LOPEZ-GONZALEZ, SONKÉ, AFFUM-BAFFOE, BAKER, OJO, PHILLIPS, REITSMA, WHITE, COMISKEY, DJUIKOUO, EWANGO, FELDPAUSCH, HAMILTON, GLOOR, HART, HLADIK, LLOYD, LOVETT, MAKANA, MALHI, MBAGO, NDANGALASI, PEACOCK, PEH, SHEIL, SUNDERLAND, SWAINE, TAPLIN, TAYLOR, THOMAS, VOTERE and WÖLL2009; Phillips et al. Reference PHILLIPS, BAKER, ARROYO, HIGUCHI, KILLEEN, LAURANCE, LEWIS, LLOYD, MALHI, MONTEAGUDO, NEILL, VARGAS, SILVA, TERBORGH, MARTINEZ, ALEXIADES, ALMEIDA, BROWN, CHAVE, COMISKEY, CZIMCZIK, FIORE, ERWIN, KUEBLER, LAURANCE, NASCIMENTO, OLIVIER, PALACIOS, PATINO, PITMAN, QUESADA, SALIDAS, LEZAMA and VINCETI2002). On the other hand, biomass increase in Africa may represent recovery from large-scale natural or anthropogenic disturbance of the past (Gloor et al. Reference GLOOR, PHILLIPS, LLOYD, LEIS, MALHI, BAKER, LOPEZ-GONZALEZ, PEACOCK, ALMEIDA, DEOLIVEIRA, ALVAREZ, AMARAL, ARROYO, AYMARD, BANKI, BLANC, BONAL, BRANDO, CHAO, CHAVE, DAVILA, ERIN, SILVA, DIIFIORE, FELDPAUSCH, FREITAS, HERRERA, HIGUCHI, HONORIO, JIMENEZ, KILLEEN, LAURANCE, MENDOZA, MONTEAGUDO, ANDRADE, NEILL, NEPSTAD, NUNEZ-VARGAS, PENUELA, PEÑACRUZ, PRIETO, PITMAN, QUESADA, SALOMÃO, SILVEIRA, SCHWARZ, STROPP, RAMIREZ, RAMÍREZ, RUDAS, TERSTEEGE, SILVA, TORRES, TERBORGH, VASQUEZ and VANDERHEIJDEN2009, Körner Reference KÖRNER2009, Lewis et al. Reference LEWIS, LOPEZ-GONZALEZ, SONKÉ, AFFUM-BAFFOE, BAKER, OJO, PHILLIPS, REITSMA, WHITE, COMISKEY, DJUIKOUO, EWANGO, FELDPAUSCH, HAMILTON, GLOOR, HART, HLADIK, LLOYD, LOVETT, MAKANA, MALHI, MBAGO, NDANGALASI, PEACOCK, PEH, SHEIL, SUNDERLAND, SWAINE, TAPLIN, TAYLOR, THOMAS, VOTERE and WÖLL2009, Muller-Landau Reference MULLER-LANDAU2009). Dramatic climatic shifts in Africa occurred as recently as 2500 y ago, and prehistoric human activities affected forest cover since (Brncic et al. Reference BRNCIC, WILLIS, HARRIS and WASHINGTON2007, Giresse et al. Reference GIRESSE, MALEY and BRENAC1994, Hart & Carrick Reference HART and CARRICK1996, Maley Reference MALEY2002, Servant et al. Reference SERVANT, MALEY, TURCQ, ASY, BRENAC, FOURNIER and LEDRU1993, van Groenendael et al. Reference VAN GROENENDAEL, BULLOCK and PÉREZ JIMENEZ1996, White & Oates Reference WHITE and OATES1999).
We set out to study the long-term dynamics of forests near the boundary between mbau and mixed forest at Ituri, following a standard protocol employed worldwide (Condit Reference CONDIT1995, Hubbell & Foster Reference HUBBELL, FOSTER, Whitmore, Chadwick and Sutton1983, Manokaran & Kochummen Reference MANOKARAN and KOCHUMMEN1987). Four 10-ha forest plots were established, with all stems ≥ 1 cm dbh mapped, measured and identified (Makana et al. Reference MAKANA, HART, EWANGO, LIENGOLA, HART, CONDIT, Losos and Leigh2004b). Subsequent censuses were carried out in 2001 and 2007. This paper describes changes in biomass and stand density as well as demographic rates, with a focus on individual species. We test the following hypotheses: (1) the Ituri forest is increasing in biomass, as are many closed-canopy tropical forests (Lewis et al. Reference LEWIS, MALHI and PHILLIPS2004b, Reference LEWIS, LOPEZ-GONZALEZ, SONKÉ, AFFUM-BAFFOE, BAKER, OJO, PHILLIPS, REITSMA, WHITE, COMISKEY, DJUIKOUO, EWANGO, FELDPAUSCH, HAMILTON, GLOOR, HART, HLADIK, LLOYD, LOVETT, MAKANA, MALHI, MBAGO, NDANGALASI, PEACOCK, PEH, SHEIL, SUNDERLAND, SWAINE, TAPLIN, TAYLOR, THOMAS, VOTERE and WÖLL2009; Phillips et al. Reference PHILLIPS, BAKER, ARROYO, HIGUCHI, KILLEEN, LAURANCE, LEWIS, LLOYD, MALHI, MONTEAGUDO, NEILL, VARGAS, SILVA, TERBORGH, MARTINEZ, ALEXIADES, ALMEIDA, BROWN, CHAVE, COMISKEY, CZIMCZIK, FIORE, ERWIN, KUEBLER, LAURANCE, NASCIMENTO, OLIVIER, PALACIOS, PATINO, PITMAN, QUESADA, SALIDAS, LEZAMA and VINCETI2002); (2) changes in biomass are observed in a majority of species, not just a few abundant taxa; (3) the mbau tree, G. dewevrei, is gaining biomass and advancing into the mixed forest (Hart et al. Reference HART, HART and MURPHY1989, Torti et al. Reference TORTI, COLEY and KURSAR2001); and finally, (4) mortality and growth rates are increasing through time, as has also been observed at many sites worldwide.
METHODS
Site description and plot censuses
The Ituri Forest Dynamics Plots were established in 1994 in the 1.35 million-hectare Okapi Faunal Reserve (1°–3° N, 28°–30° E). The topography of the area is gentle, with occasional rolling hills. Elevation varies from 600 m asl in the west to over 1000 m in the east, the latter at the transition from closed-canopy forest to savanna woodland (Hart et al. Reference HART, HART, DECHAMPS, FOURNIER, ATAHOLO, van der Maesen, van der Burgt and van Medenbach de Rooy1996). Average annual rainfall is 1700 mm, with a dry season from December to February during which monthly rainfall is < 100 mm (Hart & Carrick Reference HART and CARRICK1996, Makana & Thomas Reference MAKANA and THOMAS2005).
The vegetation in the Ituri river basin is composed chiefly of two forest types: monodominant evergreen forest, with Gilbertiodendron dewevrei (De Wild.) J. Léonard comprising at least half the canopy, and semi-deciduous mixed forest dominated by Cynometra alexandri C.H. Wright and Julbernardia seretii Troupin. We also sometimes use the local name, mbau, for G. dewevrei, both for the species and the monodominant forest type. All three are in the subfamily Caesalpinioideae of the Fabaceae. (The complete species list from the plots, with authority and family, is provided at http://ctfs.arnarb.harvard.edu/Public/Datasets/IturiForestChange.) Other vegetation types present in the Ituri basin include swamp forest along streams and xerophytic vegetation on the tops of rocky hills, but both are far less widespread than the two main forest types (Hart et al. Reference HART, HART, DECHAMPS, FOURNIER, ATAHOLO, van der Maesen, van der Burgt and van Medenbach de Rooy1996).
We established four rectangular plots of 200 × 500 m (10 ha each) in 1994. These plots were arranged in pairs, with two 10-ha plots separated by 500 m comprising a pair; the two pairs are 30 km apart. One of the sites, called Lenda, was placed in a monodominant forest area, at 1°18′ N, 28°39′, south of the town of Epulu. The other pair was established at 1°34′ N, 28°32′ E, in a mixed forest north of Epulu, at a site named Edoro. Both study sites are relatively flat, with < 25 m elevation change within plots (Makana et al. Reference MAKANA, HART, EWANGO, LIENGOLA, HART, CONDIT, Losos and Leigh2004b). In all analyses presented here, we pool the two plots at each site, so compare 20 ha of forest at Lenda with 20 ha of forest at Edoro. There is, of course, variation within each site, but our present purpose was the cross-site comparison and how it changed through time.
The entire 40-ha was surveyed into a 20-m grid, and all trees ≥10 mm dbh were tagged, mapped relative to the grid, and identified. The diameter of each stem was measured at 1.3 m above the ground (diameter at breast height, or dbh), unless there were buttresses or swelling there. In those cases, the measurement was taken above or below, wherever the stem was regular (Condit Reference CONDIT1998). An individual tree was defined as all stems connected to one root base. Branches < 1.3 m above the stem base were counted as additional stems when calculating biomass, whether they emerged separately from the ground or forked from the main trunk.
An initial census of all four 10-ha plots was carried out during 1994–1996, and subsequent censuses were completed in 2001 and 2007. During recensuses, trees from the previous census were remeasured or recorded as dead; a tree was considered dead if all its stems and branches were either visibly dead or could not be found. Trees that were snapped but resprouted, or lost some stems or branches but not all, were considered alive, even if surviving stems were < 10 mm dbh. Newly recruited stems that met the minimum dbh of 10 mm were added to the census. More detailed information on the census methods and study site can be found in Condit (Reference CONDIT1998) and Makana et al. (Reference MAKANA, HART, EWANGO, LIENGOLA, HART, CONDIT, Losos and Leigh2004b).
The three censuses of four plots included 342 893 individual trees with 409 896 stems. All but 2050 of the trees were classified into 423 consistently identified taxonomic units, including 410 identified to species and 13 where we know the genus but have not been able to find a match to any herbarium specimen. We are confident these represent 423 distinct tree species. Specimens of each were collected and deposited at the Wageningen Herbarium (WAG). The remaining 2050 individual trees, or 0.6% of the trees and 0.3% of the above-ground biomass, have uncertain identity; we do not yet know whether they are unrecognized individuals of the 423 known species, or novel species. All results on tree species refer to the identified taxa, but forest totals include the unidentified trees as well.
Biomass
Above-ground dry biomass was calculated for each stem ≥10 mm dbh using a pan-tropical allometric equation for moist forests (Chave et al. Reference CHAVE, ANDALO, BROWN, CAIRNS, CHAMBERS, EAMUS, FÖLSTER, FROMARD, HIGUCHI, KIRA, LESCURE, NELSON, OGAWA, PUIG, RIÈRA and YAMAKURA2005),

where AGB is above-ground dry biomass, ρ is wood density, D is dbh, ln the natural logarithm, and exp the exponential function (exp(x) = ex). For trees measured above or below breast height, we still used the observed diameter, uncorrected for height. For 101 of the species, wood density was taken from the compilation in Chave et al. (Reference CHAVE, COOMES, JANSEN, LEWIS, SWENSON and ZANNE2009). Another 224 species were not reported in Chave et al. (Reference CHAVE, COOMES, JANSEN, LEWIS, SWENSON and ZANNE2009), so we used the mean wood density of all species in the matching genus in Chave et al. (Reference CHAVE, COOMES, JANSEN, LEWIS, SWENSON and ZANNE2009); for 96 more species we used the mean for the family, because neither genus nor species appeared. There were two species in the plots for which the family did not appear: Huaceae and Lepidobotryaceae, and for those, the mean wood density for all species in the Ituri plot was used. Using a single, average allometry (Eq. 1) for all species, and the genus-wide average wood density for many species, may produce substantial error in estimated biomass for some species and individuals, but stand-wide biomass is correctly estimated as long as the averages are unbiased. Wood densities applied in Equation 1 are provided at http://ctfs.arnarb.harvard.edu/Public/Datasets/IturiForestChange, along with an indication whether they came from a genus or family average. We refer to above-ground biomass as simply biomass; we have no information about below-ground biomass.
Tree demography
Population size N was defined as the number of individual trees following the definition given above (one tree includes all stems from one base). Mortality rate was defined as
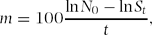
where N 0 is the number alive at the outset and St the number surviving until time t (Condit et al. Reference CONDIT, HUBBELL and FOSTER1995, Reference CONDIT, HUBBELL and FOSTER1996; Makana & Thomas Reference MAKANA and THOMAS2005). The time was defined as the mean census interval in years for all individuals in a category. Multiplying by 100 makes it a percentage and more convenient for presentation; m is close to (but not exactly) the per cent of individuals that die each year.
Growth was calculated for individual stems that were alive and could be measured at the same stem position in two censuses. Annual growth increment was defined as
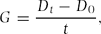
where D is dbh of the single largest stem on a tree (growth of minor stems was excluded). We report the mean of G for species and dbh categories after excluding outliers (defined as stems that grew ≥75 mm y−1 or shrunk by ≥4 s, where s is standard deviation of dbh measurement error, s = 0.9036 + 0.006214D, Condit et al. Reference CONDIT, AGUILAR, HERNANDEZ, PÉREZ, LAO, ANGEHR, HUBBELL and FOSTER2004, Reference CONDIT, ASHTON, BUNYAVEJCHEWIN, DATTARAJA, DAVIES, ESUFALI, EWANGO, FOSTER, GUNATILLEKE, GUNATILLEKE, HALL, HARMS, HART, HERNANDEZ, HUBBELL, ITOH, KIRATIPRAYOON, LAFRANKIE, LAO, MAKANA, NOOR, KASSIM, RUSSO, SUKUMAR, SAMPER, SURESH, TAN, THOMAS, VALENCIA, VALLEJO, VILLA and ZILLIO2006).
Trees not censused
The purpose of a forest plot is to measure every tree within, but among the 340 000 individuals tagged, we failed to measure some during recensuses. Many were difficult-to-measure trees that required special attention after the main census, and logistical problems arose that made it impossible to return. In the second census, 367 trees were thus missed, and these trees had 11.1 Mg ha−1 biomass in the first census; in the third census, 242 of those were alive and measured and accounted for 11.5 Mg ha−1. This suggests that the census-two biomass of the missed trees was 11.1–11.5 Mg ha−1, so we assigned each survivor the mid-point of its biomass from censuses one and three; non-survivors were assigned zero biomass in census two. This leads to an unknown error, but it is unlikely the error amounts to > 0.2 Mg ha−1, which is < 0.1% of the forest total. For demographic estimates, based on numbers of trees, the error caused by 367 missed trees is negligible.
In census three, we failed to measure 134 trees (neither a dbh nor a code indicating death were noted), and these had 4.3 Mg ha−1 in census two. We believe they were alive during the third census, but without a fourth census, we cannot check this. For census three, we assigned those trees their census-two biomass; if all were alive, this is a modest underestimate, but we acknowledge the possibility that some might have died, meaning we overestimated census-three biomass by as much as 4.3 Mg ha−1 (in case every tree omitted was really dead). We revisit this potential error in the discussion.
Statistical confidence
To estimate confidence limits, we used a spatial bootstrap method based on square hectares of the plots (Chave et al. Reference CHAVE, CONDIT, MULLER-LANDAU, THOMAS, ASHTON, BUNYAVEJCHEWIN, CO, DATTARAJA, DAVIES, ESUFALI, EWANGO, FEELEY, FOSTER, GUNATILLEKE, GUNATILLEKE, HALL, HART, HERNÁNDEZ, HUBBELL, ITOH, KIRATIPRAYOON, LAFRANKIE, LAO, MAKANA, NOOR, KASSIM, SAMPER, SUKUMAR, SURESH, TAN, THOMPSON, TONGCO, VALENCIA, VALLEJO, VILLA, YAMAKURA, ZIMMERMAN and LOSOS2008, Valencia et al. Reference VALENCIA, FOSTER, VILLA, CONDIT, SVENNING, HERNANDEZ, ROMOLEROUX, LOSOS, MAGARD and BALSLEV2004, Reference VALENCIA, CONDIT, MULLER-LANDAU, HERNANDEZ and NAVARRETE2009). At each site, the 20 ha were divided into 100 × 100-m subplots, thus producing 20 subsamples at each forest. One bootstrap replicate was created by randomly drawing 20 of those subplots, with replacement (in the average draw, about eight of the subplots were chosen once, four subplots were chosen twice, and one subplot three times; the remaining seven subplots were not chosen). Each draw produced a bootstrapped forest which, on average, had the same biomass and stem density as the real forest. One hundred bootstrapped forests were created, and from them a variance, σ2, was calculated for every statistic presented. Confidence limits were defined as ±1.96σ, and non-overlapping confidence limits between any two estimates are highlighted as statistically significant.
RESULTS
Biomass standing stock
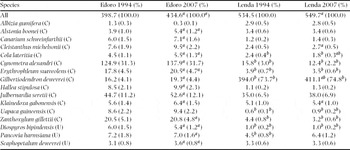
The monodominant mbau forest at Lenda had a high standing stock of above-ground biomass, over 550 Mg ha−1. The mixed forest at Edoro had considerably less, 435 Mg ha−1 (Table 1). At Lenda, the mbau tree accounted for 75% of the total, while in the mixed forest at Edoro, Cynometra alexandri comprised 32% (Table 1). There was nearly as much biomass in the mbau tree at Lenda as in the entire Edoro forest (Table 1).
Biomass of trees (Mg ha−1) in the first and last censuses at Edoro and Lenda, for the entire forest and the 16 most important species: all 13 species at Edoro with > 4.5 Mg ha−1 and all 10 at Lenda with > 2.85 Mg ha−1. (Biomass of every species can be found at http://ctfs.arnarb.harvard.edu/Public/Datasets/IturiForestChange.) The per cent contribution of each species to its site's total biomass is given in parentheses. Note a indicates a significant difference between censuses, and appears with the 2007 column at whichever site changed. Note b indicates a significant difference between Edoro and Lenda, appearing with the Lenda column for the census interval that differed. C = canopy tree; U = understorey tree or treelet

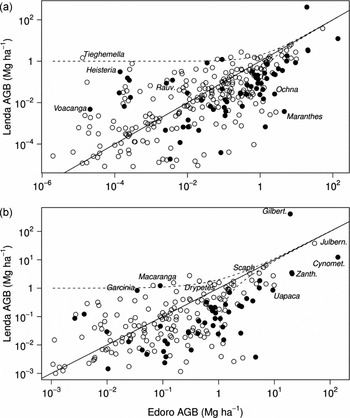
Despite the high dominance of Gilbertiodendron dewevrei at Lenda, species diversity was high and comparable to the mixed forest at Edoro. In the 1994 census, the Edoro forest had 355 species, and Lenda had 348. Biomass per species varied by more than seven orders of magnitude in both forests (Figure 1). At one extreme, for example, the canopy tree Tieghemella africana was represented by a single sapling weighing 146 g at Edoro; it added just 7.3 × 10⁻⁶ Mg ha−1 to forest biomass, while Cynometra alexandri contributed 138 Mg ha−1. In other cases, though, species with very small populations in terms of individual trees made vastly disproportionate contributions to biomass. For example, Tieghmella africana at Lenda had only one individual, but it was 1340 mm in dbh and held 28 Mg of dry mass above ground; alone, that one tree placed its species in the 22nd rank in biomass at Lenda, out of 348 species (Figure 1). Biomass and abundance for every species are presented at http://ctfs.arnarb.harvard.edu/Public/Datasets/IturiForestChange.
A comparison of species’ biomass between Edoro and Lenda, from the 2007 census, including all species (a) and abundant species on expanded axes (b). The line is at y = x, not a regression; points above it indicate species that had more biomass at Lenda, and points below more at Edoro. Filled circles indicate statistically significant differences, based on confidence limits estimated by boot-strapping. Dashed curves show a difference of 1 Mg ha−1. Axes are logarithmic. Species identified: Cynometra alexandri, Drypetes bipindensis, Garcinia smeathmannii, Gilbertiodendron dewevrei, Julbernardia seretii, Heisteria africanum, Maranthes glabra, Ochna afzelii, Scaphopetalum dewevrei, Tieghemella africana, Uapaca guineensis, Voacanga bracteata and Zanthoxylum gillettii. (Family names and authorities can be found at http://ctfs.arnarb.harvard.edu/Public/Datasets/IturiForestChange.)

The two forests 30 km apart were similar in biomass composition per species, with the correlation in log(biomass) between sites having an r 2 = 0.4, despite 10- to 100-fold differences in biomass between sites for many species (Figure 1). Conspicuous in Figure 1 is the way Gilbertiodendron dewevrei had elevated biomass at Lenda relative to Edoro, while other important species were the opposite. There were 51 species other than G. dewevrei at Edoro with ≥ 1 Mg ha−1, and every one had less biomass at Lenda (Figure 1); those species accounted for 341 Mg ha−1 at Edoro and only 106 Mg ha−1 at Lenda. All told, there were 61 species with significantly less biomass at Lenda than at Edoro, and only six the opposite, one of the latter being, of course, G. dewevrei (Figure 1).
Biomass change
The Edoro forest grew in biomass, from 399 Mg ha−1 in 1996 to 419 Mg in 2001 and then 435 Mg in 2007 (Table 1). The mbau forest at Lenda also increased, but not consistently, rising from 535 Mg ha−1 in 1996 to 554 Mg in 2001, but then declining to 550 Mg in 2007 (Table 1). Both sites thus increased by 19 Mg ha−1 during the first census interval, but Edoro maintained this increase during 2001–2007 while Lenda did not. The gain in biomass at both sites was nearly entirely due to growth of trees already censused: at Edoro, the gain of 36 Mg ha−1 over 12 y included only 0.9 Mg ha−1 of newly recruited individuals, and at Lenda the gain of 15 Mg ha−1 included 0.4 Mg ha−1 of recruits.
At Edoro, most individual species gained biomass. Among the most abundant, 10 of 12 species with ≥5 Mg ha−1 in 1994 gained biomass by 2007, and most of those changes were significant (Table 1). This pattern held through rare species, too, with 65% of all the species gaining in biomass (232 of 355). As a percentage of the forest at Edoro, nine of 12 abundant species also gained, but only one species significantly so (Table 1). Gilbertiodendron dewevrei ranked fifth in biomass at Edoro in both censuses, though by 2007 it had become slightly closer to the third and fourth ranks, Zanthoxylum gillettii and Erythrophleum suaveolens.
At Lenda, 208 of the 348 species, or 60%, showed increases in biomass from 1994–2007, less than the 65% at Edoro. The dominant G. dewevrei gained biomass, as did the next-ranking species, Julbernardia seretii, but the third-ranking species, Cynometra alexandri, lost 3.4 Mg ha−1 and was the only dominant species showing a large loss in biomass in either forest. Four of the next five ranks lost biomass, and outside the top four species, which together gained 17 Mg ha−1, the rest of the Lenda forest lost 2 Mg ha−1 over 12 y (Table 1).
Tree density
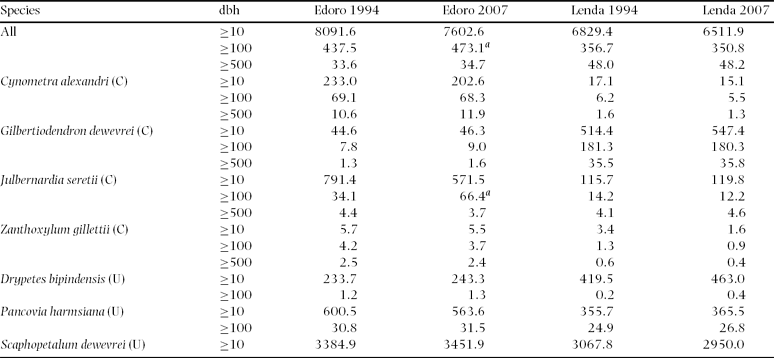
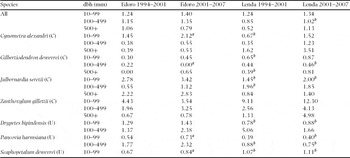
Sapling density at Edoro was higher than at Lenda, but in larger trees, the pattern reversed (Table 2). The mbau tree accounted for 79% of the trees ≥500 mm dbh at Lenda, but just <10% of the saplings. Though a much smaller component at Edoro, mbau showed the same pattern there of greater representation at larger sizes. The understorey treelet Scaphopetalum dewevrei had a density of nearly 3000 individuals ha−1 in both forests, over 40% of the entire forest, and two other understorey species had densities similar to those of the saplings of the dominant trees (Table 2). Despite the significant difference in density of most species between sites, the correlation of log(abundance) was fairly high, with r 2 = 0.54. This pattern held because abundance varied across four orders of magnitude between species within a site, while most species differed by one to two orders of magnitude between sites.
Density of trees (individuals ha−1) in the first and third censuses at Edoro and Lenda, for the entire forest and seven important species (including the five most abundant at each site plus Zanthoxylum gillettii), in three dbh categories. (Abundance of every species can be found at http://ctfs.arnarb.harvard.edu/Public/Datasets/IturiForestChange.) Note a indicates a significant change through time, and appears with the rate for 2007 at whichever site changed. The note indicating significant site differences was omitted because nearly every case was significant (only the largest category for Julbernardia seretii, Pancovia harmsiana and Scaphopetalum dewevrei were not).
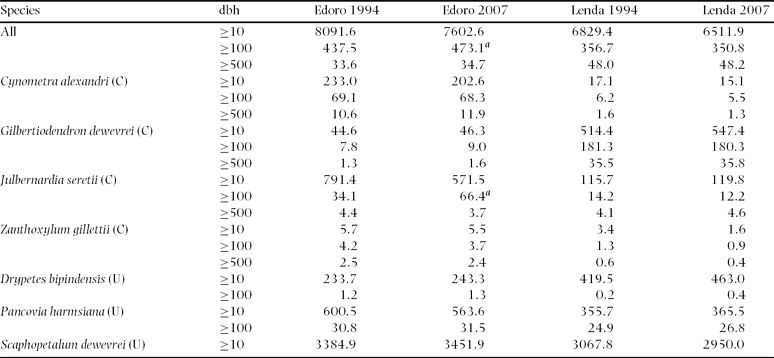
At both forests, the total density of trees ≥10 mm dbh declined by 5% over 12 y. In the big trees, however, those ≥500 mm dbh, density increased (Table 2). The mbau tree increased in density, as both saplings and large trees. The other big canopy species, Cynometra alexandri and Julbernardia seretii, declined in sapling density at Edoro, and the former also did at Lenda. Both the latter species gained biomass at Edoro despite large losses in saplings (Tables 1 and 2).
Mortality
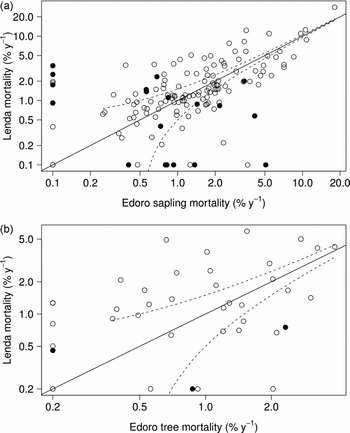
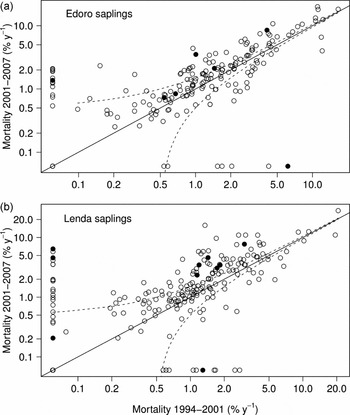
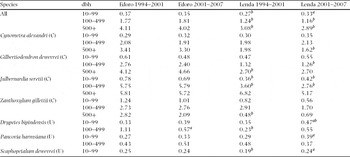
Mortality rates were low, with stand-wide and most species’ means being <1.5% y−1 in both forests (Figure 2, Table 3). Sapling mortality rates in the two forests were similar, both for individual species (Figure 2) and the entire forest (Table 3). In larger trees, the cross-site comparison for individual species and the stand (Table 3) did not correspond: whereas Lenda had lower mortality forest-wide (as in trees 100–500 mm dbh, Table 3), individual species often had higher mortality at Lenda, as for example in Cynometra alexandri and Gilbertiodendron dewevrei. This apparent paradox is driven by the abundance of the mbau tree, which had very low mortality at all sizes (Table 3). Because mbau so dominated the stand at large dbh, it drew down the mortality of the Lenda forest relative to Edoro, but much more so in large diameter classes.
A comparison of species’ mortality rates between Edoro and Lenda in saplings, 10–99 mm dbh (a) and trees 100–499 mm dbh (b). Only species with > 10 individuals at both plots in the given dbh category are included. The line is at y = x, not a regression; points above it indicate species with higher mortality at Lenda, and vice versa. Axes are logarithmic. Species with no deaths are shown at a rate of 0.1 for saplings, 0.2 for trees; other rates were not altered. Dashed curves show a difference of 0.5 (for example, if m = 0.6% y−1at one site and m = 1.1% y−1at the other). Filled circles indicate statistically significant differences.

Mortality rates (% y−1) of trees over the first and second census intervals at Edoro and Lenda, for the entire forest and seven important species. Note a indicates a significant difference between intervals, and appears with the 2001–2007 rate at whichever site changed. Note b indicates a significant difference between Edoro and Lenda, appearing with the Lenda rate for the interval that differed.

Mortality was higher in the second interval than the first, though the difference was subtle and not significant in many individual tests. The pattern was clearest in individual species, because most had elevated mortality in the second interval (Figure 3, Table 3). In Edoro saplings, for instance, 66% of 186 species with ≥10 individuals showed increasing mortality; the proportion at Lenda was 71%, and this held for common and rare species (Figure 3). The median sapling mortality rate across species at Edoro increased from 1.1% to 1.5%, and at Lenda from 1.1% to 1.4%; only a few species showed a significant change as saplings, but always in the direction of increasing mortality (Figure 3). In larger trees, 100–499 mm dbh, mortality rates also tended to be elevated during 2001–2007, and the species median rose from the first interval to the second, from 0.6% to 1.3% at Edoro and from 0.8% to 1.3% at Lenda, but samples were small and no species by itself showed a significant difference.
Change through time in sapling mortality rates of individual species at (a) Lenda and (b) Edoro. Only species with > 10 individuals in the first census in the given dbh category are included. The line is at y = x, not a regression; points above it indicate species with increasing mortality, while those below decreased. Axes are logarithmic. Species with no deaths are shown at a rate of 0.06% y−1; other rates were not altered. Dashed curves show a change of 0.5. Filled circles indicate statistically significant changes.

Stand-wide, mortality rates were higher in the second interval, though only significantly so in the medium dbh category at Edoro (Table 3). There was much higher mortality during 2001–2007 of the biggest trees at Lenda in all the common canopy species: for the entire stand, there were 961 large trees at Lenda in 1994, and 29 died while 56 recruited before 2001. In the next interval, 68 died and only 44 recruited, so there were 964 trees in 2007. These differences were not, however, statistically significant.
Diameter growth
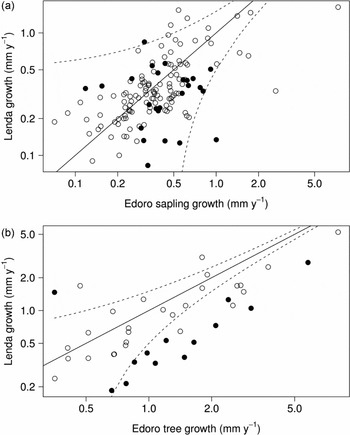
Growth rates were also low, with nearly all species averaging < 1 mm y−1 and the forest as a whole < 0.5 mm y−1 dbh increment as saplings (Figure 4, Table 4). Stand-wide growth was slightly lower at Lenda than at Edoro in saplings, significantly so in the first census (Table 4), but individual species were divided, with some growing significantly faster at Lenda and others at Edoro (Figure 4). In larger trees, growth was conspicuously lower at Lenda than at Edoro, and Gilbertiodendron dewevrei itself grew at half the rate in the stand it dominated (Table 4). Stand-wide mean growth of large trees was 3 mm y−1 at Lenda versus 4 mm y−1 at Edoro. None of the dominant species grew >6 mm y−1.
A comparison of species’ dbh growth rates between Edoro and Lenda in saplings, 10–99 mm dbh (a) and trees 100–499 mm dbh (b). Only species with > 10 individuals at both plots in the given dbh category are included. The line is at y = x, not a regression; points above it indicate species with higher growth at Lenda, and vice versa. Axes are logarithmic. Dashed curves show a growth difference of 0.5 (for example, between 0.6 mm y−1and 1.1 mm y−1). Filled circles indicate statistically significant differences.

Growth rates (mm y−1) of trees over the first and second census intervals at Edoro and Lenda, for the entire forest and seven important species. Note a indicates a significant change through time, and note b a significant difference between Edoro and Lenda (as in Table 3).

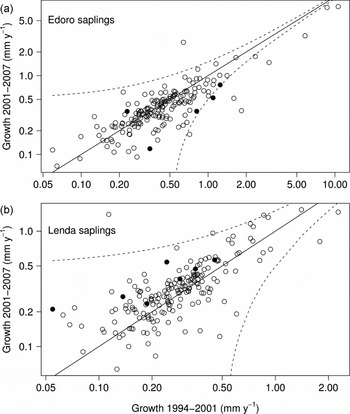
Sapling growth did not change through time at Edoro, neither for the stand (Table 4) nor for individual species; 44% of the species with ≥10 individuals had higher growth in the second interval (Figure 5, Table 4). At Lenda, in contrast, there was a pattern toward higher growth in the 2001–2007 interval: seven species had significantly elevated growth (three are in Table 4), and 64% of 199 species showed increasing growth (Figure 5). In trees ≥100 mm dbh, there was no pattern for increasing or decreasing growth through time at either site.
Change through time in sapling growth rates of individual species at (a) Lenda and (b) Edoro. Only species with > 10 individuals in the first census in the given dbh category are included. The line is at y = x, not a regression; points above it indicate species with increasing mortality, and those below decreasing. Axes are logarithmic. Dashed curves show a change of 0.5. Filled circles indicate statistically significant changes.

DISCUSSION
The purpose of this intensive study was to understand the dynamics of the forest species-by-species. Small-scale studies do not monitor individual species, and because high diversity is what makes tropical forests interesting, we need to understand the diversity of demography. We believe this is one of the first studies to trace shifts in carbon stocks of entire forests to the species.
Forests at two sites in the eastern Congo gained biomass, and in the mixed forest at Edoro, the increase was widespread, with two-thirds of all species and all the abundant species gaining biomass. The Edoro forest as a whole increased by 9% over 12 y, or 3 Mg ha−1 y−1. Forest biomass at the other site, Lenda, increased at the same rate during 1994–2001, but then declined in the second interval, and the biomass gain there was not so consistent across species: other than the dominant Gilbertiodendron dewevrei, the forest lost biomass.
The lost biomass at Lenda during 2007 can be traced to increased mortality among large trees after 2001: whereas 29 trees ≥500 mm dbh died in the first 6 years, 68 did so in the second, meaning 39 extra deaths. Since large trees carry an average of 8 Mg body mass, this accounts for 16 Mg ha−1. We speculate that one big wind-storm killed these trees. Despite the extra deaths, the Lenda forest maintained its population of 48 large trees ha−1 due to recruitment – the forest would have gained 39 big trees without this mortality event.
The forest-wide increase in biomass observed across species at Edoro is consistent with a broad climatic driver, something that impacts most species the same way, such as temperature, rainfall or CO2 (Lewis et al. Reference LEWIS, LOPEZ-GONZALEZ, SONKÉ, AFFUM-BAFFOE, BAKER, OJO, PHILLIPS, REITSMA, WHITE, COMISKEY, DJUIKOUO, EWANGO, FELDPAUSCH, HAMILTON, GLOOR, HART, HLADIK, LLOYD, LOVETT, MAKANA, MALHI, MBAGO, NDANGALASI, PEACOCK, PEH, SHEIL, SUNDERLAND, SWAINE, TAPLIN, TAYLOR, THOMAS, VOTERE and WÖLL2009, Phillips et al. Reference PHILLIPS, BAKER, ARROYO, HIGUCHI, KILLEEN, LAURANCE, LEWIS, LLOYD, MALHI, MONTEAGUDO, NEILL, VARGAS, SILVA, TERBORGH, MARTINEZ, ALEXIADES, ALMEIDA, BROWN, CHAVE, COMISKEY, CZIMCZIK, FIORE, ERWIN, KUEBLER, LAURANCE, NASCIMENTO, OLIVIER, PALACIOS, PATINO, PITMAN, QUESADA, SALIDAS, LEZAMA and VINCETI2004). But the result at Lenda, where dominant species gained while the rest of the forest did not, may be more consistent with long-term recovery from past disturbance, with current climate playing no part.
Logistical problems hampered work, especially in the second census, and some big trees were missed; we do not wish to conceal this source of uncertainty. Fortunately, most were still alive in the third census, so this group added little error to our estimates for 1994–2001. In the third census, though, missed trees may have led us to overestimate biomass and thus biomass gain during 2001–2007, possibly by 4 Mg ha−1 though most likely less. This is a small amount relative to the 12-y gain at both sites, but is not trivial relative to the 2001–2007 change at Lenda. We hope the fourth census will help overcome this uncertainty in the third census.
An additional potential error would be trees overlooked in the first census but located in the second census, making it appear the forest gained biomass. Since our census included saplings as small as 10-mm diameter, individuals recruited between censuses were small and carried little biomass; big trees appearing for the first time in census two would be obvious. Indeed, recruits contributed a negligible amount to the biomass gain, <2% of the total increase. Evidently, we did not miss large amounts of biomass in the first census.
The dominance of the mbau tree at Lenda was not surprising, because dominance in terms of basal area has been reported (Hart Reference HART1990). Striking, however, was the high biomass of the forest that went along with this dominance: Gilbertiodendron dewevrei by itself had 411 Mg ha−1, almost as much biomass as the entire mixed forest at Edoro. In a survey of 11 tropical forests, Chave et al. (Reference CHAVE, CONDIT, MULLER-LANDAU, THOMAS, ASHTON, BUNYAVEJCHEWIN, CO, DATTARAJA, DAVIES, ESUFALI, EWANGO, FEELEY, FOSTER, GUNATILLEKE, GUNATILLEKE, HALL, HART, HERNÁNDEZ, HUBBELL, ITOH, KIRATIPRAYOON, LAFRANKIE, LAO, MAKANA, NOOR, KASSIM, SAMPER, SUKUMAR, SURESH, TAN, THOMPSON, TONGCO, VALENCIA, VALLEJO, VILLA, YAMAKURA, ZIMMERMAN and LOSOS2008) found only one site (Sarawak, Malaysia) with more biomass than the mbau tree alone at Lenda. There are temperate, coniferous forests in north-western North America, though, with much higher biomass. Interestingly, these are also monodominant stands, for example where Douglas fir (Pseudotsuga menziesii) or redwood (Sequoia sempervirens) dominate (Grier & Logan Reference GRIER and LOGAN1977).
Other than the mbau tree, the forests at Lenda and Edoro are similar. Nearly all common species at Edoro were also common at Lenda, but with reduced biomass. Previous work has failed to find any differences in soil or climate between the two areas, which are on similar, homogeneous terrain (Hart et al. Reference HART, HART and MURPHY1989). In this respect, it appears that the mixed community at Edoro is the mbau forest, but without mbau. When mbau enters the forest, other species are suppressed but not eliminated. Counterintuitively, the total forest biomass increases when mbau invades. Biomass productivity here does not associate with high diversity: one species is more productive than the mixed forest it displaces.
One of our major purposes in placing plots on either side of the boundary of mbau forest was to test whether the mbau tree is spreading into the mixed forest. The Edoro plots have a small patch of Gilbertiodendron dewevrei, and it increased its share of forest biomass from 4.1% to 4.4%. But this result was not as easy to interpret as we had hoped, because the two major canopy species at Edoro – Cynometra alexandri and Julbernardia seretii – also increased their share of biomass. Thus, if there is directional change in relative proportions, it is not simply toward an mbau-dominated forest, but rather toward a forest more dominated in general, with less mass in rare species. A more precise test of whether mbau is invading will be to examine the boundaries of the small mbau patch at Edoro to see whether they advanced into mixed forest.
Sapling densities suggest that the mbau tree may indeed be on a long-term increase at Edoro: although the forest as a whole declined in sapling density, Gilbertiodendron dewevrei increased, suggesting it recruited well relative to the rest of the forest. The loss in saplings through time, and the lower sapling density in the mbau forest relative to mixed forest, can be understood as a trade-off between canopy and understorey: as big trees gain in density and the forest increases in biomass, the understorey must receive less light, and thus sapling density declines. Whatever causes an increase in canopy density, whether it is long-term advance of the highly shade-tolerant mbau, or recent climatic fluctuations, it has to led to a lower understorey density. But G. dewevrei and several highly shade tolerant understorey species were able to gain sapling density despite the competition from above. The mbau tree persists exceedingly well as a sapling in deep shade, and thus becomes a more dominant part of the forest at large diameters (Hart Reference HART1990). All changes in the Ituri forest proceeded slowly, though, as it has low mortality and growth relative to other tropical forests and many temperate forests (Condit et al. Reference CONDIT, ASHTON, BUNYAVEJCHEWIN, DATTARAJA, DAVIES, ESUFALI, EWANGO, FOSTER, GUNATILLEKE, GUNATILLEKE, HALL, HARMS, HART, HERNANDEZ, HUBBELL, ITOH, KIRATIPRAYOON, LAFRANKIE, LAO, MAKANA, NOOR, KASSIM, RUSSO, SUKUMAR, SAMPER, SURESH, TAN, THOMAS, VALENCIA, VALLEJO, VILLA and ZILLIO2006, Stephenson & van Mantgem Reference STEPHENSON and VAN MANTGEM2005).
The forests in Ituri demonstrated a small increase in mortality through time, as described in Amazonia (Lewis et al. Reference LEWIS, PHILLIPS, BAKER, LLOYD, MALHI, ALMEIDA, HIGUCHI, LAURANCE, NEILL, SILVA, TERBORGH, LEZAMA, MARTINEZ, BROWN, CHAVE, KUEBLER, VARGAS and VINCETI2004a). No previous study has examined individual species dynamics, and we were able to show that the increasing trend is widespread across rare and common species. Growth rates increased only at the monodominant site, also across most species. A simple driver for increasing mortality would be increasing biomass and the subsequent reduction of understorey light (Lewis et al. Reference LEWIS, MALHI and PHILLIPS2004b). The tendency for growth rates to be lower at Lenda compared to Edoro matches this hypothesis, since Lenda has higher canopy density and thus darker understorey. The trend for increased growth through time at Lenda, however, does not fit the hypothesis – increasing biomass should mean lower sapling growth. Likewise, the large gain in biomass at Edoro should lead to reduced growth, but we could not detect this.
We have documented that forests of the Congo are high in biomass relative to most of the tropics, and that the mbau forest has 25% more biomass than mixed forest, with both gaining through time. Should the mbau tree, Gilbertiodendron dewevrei, spread and occupy a greater area in coming decades, Congo's forest would accumulate carbon. If 10% of the Congo basin forest – 60 million ha – shifts to mbau dominance, more than 109 Mg carbon would be added. Conversely, if 10% of the forest is lost, well over 109 Mg would be lost from the system. It has been suggested that secondary forests can recoup the carbon lost due to deforestation (Wright Reference WRIGHT2005), however, old-growth mbau forests in Central Africa hold high biomass in species with slow dynamics. Carbon stored in mbau could be lost quickly if felled but subsequently take centuries to recuperate. Shifts in species composition, forest dynamics and ecosystem services affected by changes toward or away from mbau dominance can only be predicted with information about the demography of many individual species, the major purpose of pursuing this large-scale study into a fourth census and beyond.
ACKNOWLEDGEMENTS
Civil war reached the Okapi Reserve several times between censuses, and our thanks need to be amplified in this light: one of us – C. N. E. – was captured by rebels while at the research site. He was later awarded the Goldman Environmental Prize for his efforts to maintain botanical research during war. Many other individuals and organizations maintained support despite the difficulties imposed: the Wildlife Conservation Society through its conservation project in the Okapi Faunal Reserve; J. Madidi, P. Umunay, F. Bujo, and J. Mukinzi through their field work; M.N. Ndiu and P. Umunay by maintaining the database. The Institut Congolais pour la Conservation de la Nature graciously provided the research permit, while S. Davies, E. Bermingham, and I. Rubinoff provided direction and financial support for the international plot network via the Smithsonian Tropical Research Institute and the Arnold Arboretum at Harvard University. The Ituri plots were supported by funding from the Wildlife Conservation Society, the Peninsula Foundation, and the Smithsonian Scholarly Studies Program. Analyses reported here were developed during workshops sponsored by the National Science Foundation (grants DEB-0090311 and DEB-9806828) and the Peninsula Foundation.