


Introduction
The James Ross Basin (JRB) as defined by Elliot (Reference Elliot1988) is a back-arc basin that developed to the east of an evolving magmatic arc, now represented by the easternmost part of northern Antarctic Peninsula (Fig. 1). Pre-Cenozoic terrane accretion and collision, resulting in the orogenic domains of Antarctic Peninsula, are described by Vaughan & Storey (Reference Vaughan and Storey2000). According to many authors (e.g. Crame et al. Reference Crame, Pirrie, Riding and Thomson1991, Whitham Reference Whitham1993, Pirrie et al. Reference Pirrie, Crame, Lomas and Riding1997, Riding et al. Reference Riding, Crame, Dettmann and Cantrill1998), the James Ross Basin contains one of the most complete Jurassic-Paleogene sedimentary successions in the Southern Hemisphere, as well as a Cretaceous/Tertiary (K–T) boundary section on Seymour Island. The JRB is a northern sub-basin of the large Larsen Basin (del Valle et al. Reference del Valle, Elliot and Macdonald1992, Hathway Reference Hathway2000). It is now generally accepted that sedimentation in the Larsen Basin started in Jurassic times, in the early stages of continental rifting to the east of the Antarctic Peninsula (e.g. Francis et al. Reference Francis, Crame and Pirrie2006). The JRB formed as a back-arc basin to the east of the volcanic arc that was active from the Jurassic to the Paleocene or Eocene (del Valle et al. Reference del Valle, Elliot and Macdonald1992). The important role of basin development and characterisation of episodic accretionary processes, including the addition and translation of continental and oceanic fragments described Vaughan & Livermore (Reference Vaughan and Livermore2005) and the summary of the mechanism responsible for the subduction of a significant area of the Weddell Sea spreading centre at the eastern offshore of the Antarctic Peninsula, is presented by Bohoyo et al. (Reference Bohoyo, Galindo-Zaldivar, Maldonado, Schreider and Surinach2002). The arc was formed by the south-eastward subduction of Protopacific crust beneath the southern margin of Gondwana (Whitham Reference Whitham1993, Hathway Reference Hathway2000). The JRB continuously subsided, providing the accommodation space for the deposition of more than 5 km of marine sedimentary rock through the Late Jurassic to Late Eocene (e.g. Crame et al. Reference Crame, Pirrie, Riding and Thomson1991, Pirrie et al. Reference Pirrie, Duane and Riding1992, Riding et al. Reference Riding, Crame, Dettmann and Cantrill1998, Marenssi et al. Reference Marenssi, Net and Santillana2002).
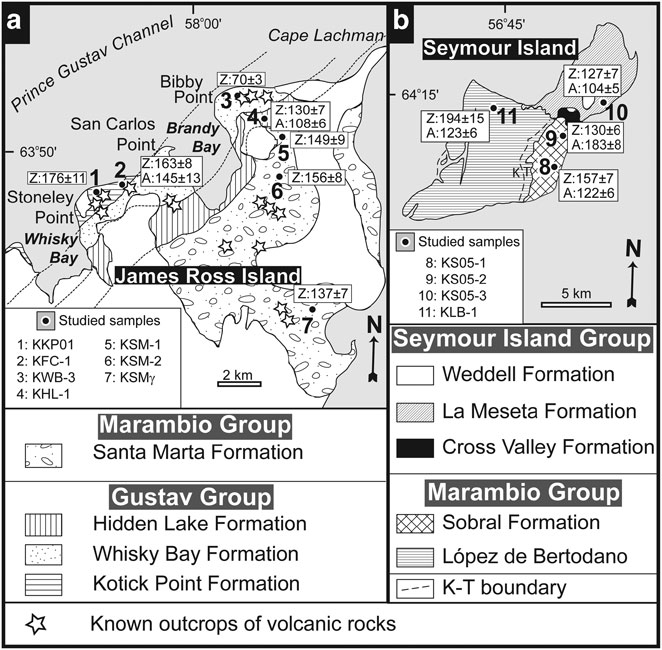
In order to reconstruct the low-temperature evolution of potential sources of sediment (provenance ages) and post-sedimentary succession in the JRB, this paper reports new fission track (FT) geochronology data on detrital zircons and apatites reported from the James Ross Basin sedimentary rocks. The FT data presented were obtained from sandstones (Aptian/Albian to Eocene stratigraphic age) collected from the James Ross and Seymour islands (Figs 1 & 2). Their individual stratigraphic and depositional classifications, together with FT ages, are shown in Tables I & II. In addition, two-dimensional thermal modelling of detrital apatites permitted an estimation of exhumation/denudation rates for the sedimentary basin fill.
A schematic map showing the location of James Ross Island and the surrounding islands and the locations of the studied samples. Boxes (dashed lines) show locations of geological maps in Fig. 2a & b; inset top left and inset top right shows the position of James Ross Island at the northern end of the Antarctic Peninsula.

Geological sketch map of the Cretaceous-Tertiary sedimentary rocks on a. northern James Ross Island, b. Seymour Island, and a summary of stratigraphy (modified from Whitham & Marshall Reference Whitham and Marshall1988, Pirrie et al. Reference Pirrie, Duane and Riding1992, Marenssi et al. Reference Marenssi, Net and Santillana2002).
Zircon fission-track analytical data.

JRI = James Ross Island, SI = Seymour Island; individual depositional ages are based on the combination of microfossil biostratigraphy and strontium isotope stratigraphy, ρs = spontaneous track density of a sample, Ns = number of tracks counted to determine ρs, ρi = induced track density of a sample measured in a muscovite external detector, Ni = number of tracks counted to determine ρi, ρd = induced track density of glass dosimeter IRMM 540R measured in a muscovite external detector, Nd = number of tracks counted to determine ρd, T = fission track age with its 1σ error, n = number of grains counted, P(χ2), probability of obtaining the observed value of χ 2 parameter, for N degree of freedom, where N = (number of counted crystals)-1 [Galbraith 1981, Green 1981b], L = mean length of horizontal confined fission tracks (HCTs)>60° to c-axis, with 1 standard error (s.s.), N = number of measured tracks to determine L, σ = standard deviation for the length distribution of confined fission tracks>60° to c-axis, Lall = mean length of HCTs in all crystallographic orientations, with 1 s.e., Nall = number of measured tracks to determine Lall, σall = standard deviation for the length distribution of confined fission tracks in all crystallographic orientations. HCT with angles to the crystallographic c-axis of>60° are selectively used for analysis hereafter, considering the various orientation factors which affect the track length measurement.
Apatite fission-track analytical data.

JRI = James Ross Island, SI = Seymour Island; individual depositional ages are based on the combination of microfossil biostratigraphy and strontium isotope stratigraphy; ρs = spontaneous track density of a sample, Ns = number of tracks counted to determine ρs, ρi = induced track density of a sample measured in a muscovite external detector, Ni = number of tracks counted to determine ρi, ρd = induced track density of glass dosimeter CN5 measured in a muscovite external detectors, Nd = number of tracks counted to determine ρd, T = fission track age with its 1σ error, n = number of grains counted, P(χ2) = probability of obtaining the observed value of χ 2 parameter, for N degree of freedom, where N = (number of counted crystals)-1 [Galbraith 1981, Green 1981b], L = mean length of horizontal confined fission tracks with 1 standard error (S.E.) in all crystallographic orientations, N = number of measured tracks to determine L, n.d. = not determined, σ = standard deviation for the length distribution of confined fission tracks.
Depositional history of the James Ross Basin
The thickness of the JRB fill estimated from the thicknesses of individual formations cited in the literature (cf. Ineson et al. Reference Ineson, Crame and Thomson1986, Elliot Reference Elliot1988, Riding et al. Reference Riding, Crame, Dettmann and Cantrill1998, Francis et al. Reference Francis, Crame and Pirrie2006) ranges from 4.8 to 8.0 km. Geophysical sounding revealed a cumulative thickness of 5–6 km in the central part of basin (Macdonald et al. Reference Macdonald, Barker, Garrett, Ineson, Pirrie, Storey, Whitham, Kinghorn and Marshall1988). We used the vitrinite reflectance studies of Whitham & Marshall (Reference Whitham and Marshall1988), Pirrie et al. (Reference Pirrie, Ditchfield and Marshall1994) and Scasso & Kiessling (Reference Scasso and Kiessling2001) to establish the burial/erosional history of JRB sediments, which we compared with the individual thicknesses of each formation listed in Table IV. However, the use of vitrinite reflectivity measurements alone without the known heat flux in the lithosphere does not allow for assessment of the exact burial depths of individual formations. Therefore, we combined them with the bottom sea temperatures of various time intervals given by Pirrie & Marshall (Reference Pirrie and Marshall1990) and Dingle & Lavelle (Reference Dingle and Lavelle2000) and with direct depth-temperature measurements in similar basins. It was found from borehole measurements in the Vienna Basin (Franců et al. 1989, Reference Franců, Müller, Šucha and Zatkalíková1990) that the vitrinite reflectivity values of 0.4–0.5%, which were measured by Whitham & Marshall (Reference Whitham and Marshall1988) and Scasso & Kiessling (Reference Scasso and Kiessling2001) for Gustav Group sediments on northern JRI, may be expected in depths of ∼2–2.5 km. The vitrinite reflectivity values of 0.2–0.35% measured for Marambio Group sediments by Whitham & Marshall (Reference Whitham and Marshall1988) and Whitham in Pirrie et al. (Reference Pirrie, Ditchfield and Marshall1994) indicate burial depths < 1.5 km. The vitrinite reflectivity value of 0.5% corresponds to temperatures ∼90–120°C (Franců et al. Reference Franců, Rudinec and Šimánek1989), which may produce partial fission track annealing in apatite. Accordingly, the burial thicknesses discussed in the paper of Whitham & Marshall (Reference Whitham and Marshall1988) may have been slightly underestimated. The geothermal gradient of 30°C/1000 m fits best for the JRB sediments. The assessed depths and calculated temperatures for individual time intervals are compiled in Table III. The comparison of geological evidence with FT dating and modelling of burial and uplift for individual samples was designed to bring additional information on the Mesozoic-Cenozoic geological history of this part of the Antarctic Peninsula.
Time-temperature burial/erosional history of individual samples according to geological evidence.

Maximum thickness of the James Ross Basin formations and their stratigraphic range (see text for details).
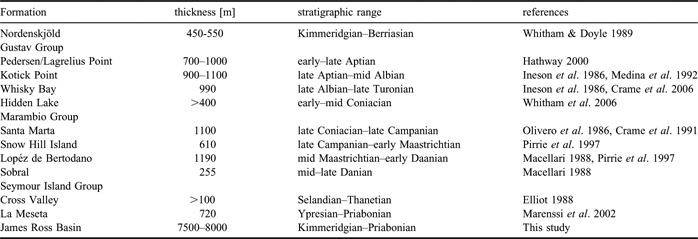
Four major sedimentary units have been defined in the JRB marine sedimentary rocks (e.g. Ineson et al. Reference Ineson, Crame and Thomson1986, Olivero et al. Reference Olivero, Scasso and Rinaldi1986, Pirrie et al. Reference Pirrie, Duane and Riding1992). The oldest known sedimentary unit of the JRB is the Nordenskjöld Formation (Farquaharson Reference Farquaharson1982) cropping out on the eastern coast of the Antarctic Peninsula only (Whitham & Doyle Reference Whitham and Doyle1989). On James Ross Island, this formation is represented by large isolated allochthonous glide blocks within the younger sedimentary rocks of the Kotick Point and Whisky Bay formations (Ineson Reference Ineson1985, Whitham & Doyle Reference Whitham and Doyle1989, Pirrie et al. Reference Pirrie, Duane and Riding1992). The Nordenskjöld Formation, with an overall thickness of 450–550 m assigned to the Kimmeridgian–Berriasian (Whitham & Doyle Reference Whitham and Doyle1989), represents the lowest known unit of the basin. The subsequent deposits of the Gustav Group comprises five defined formations: Pedersen, Lagrelius Point, Kotick Point, Whisky Bay and Hidden Lake Formations (Ineson et al. Reference Ineson, Crame and Thomson1986, Riding & Crame Reference Riding and Crame2002, Crame et al. Reference Crame, Pirrie and Riding2006). The Pedersen Formation crops out only at the Pedersen Nunatak and on the Sobral Peninsula and has an overall exposed thickness of 700–1000 m (Hathway Reference Hathway2000). It is thought to be laterally equivalent to the Lagrelius Point Formation exposed on north-western James Ross Island (JRI; Riding & Crame Reference Riding and Crame2002). The Lagrelius Point Formation has a total thickness of c. 250 m (Buatois & Medina Reference Buatois and Medina1993) and was dated as early Aptian by Riding et al. (Reference Riding, Crame, Dettmann and Cantrill1998). This coarse-grained succession was deposited primarily from sediment gravity flows in a deep marine environment (Buatois & Medina Reference Buatois and Medina1993). The succeeding Kotick Point Formation with an overall thickness of 900–1100 m (Ineson et al. Reference Ineson, Crame and Thomson1986, Medina et al. Reference Medina, Buatois, Strelin and Martino1992) is interpreted as a slope apron and/or a submarine fan succession (Ineson Reference Ineson1989, Hathway Reference Hathway2000) of late Aptian to mid Albian age (Riding & Crame Reference Riding and Crame2002). An overall thickness of approximately 990 m was identified for the Whisky Bay Formation in the Brandy Bay area (Ineson et al. Reference Ineson, Crame and Thomson1986, Riding & Crame Reference Riding and Crame2002, Crame et al. Reference Crame, Pirrie and Riding2006); this formation is also referred to a submarine fan or slope apron environment (Ineson Reference Ineson1989, Crame et al. Reference Crame, Pirrie and Riding2006). This formation has been assigned an Albian to late Turonian age (Crame et al. Reference Crame, Pirrie and Riding2006).
A major sedimentological change occurred at the Whisky Bay Formation/Hidden Lake Formation transition. The Hidden Lake formation was deposited by concentrated density flows at a base of a slope environment (in the lower part of the formation) following by localised volcanoclastic fan-delta deposited in the northern part of the succession, succeeded by mud-dominated basin floor sediments (Whitham et al. Reference Whitham, Ineson and Pirrie2006). According to strontium isotope and macrofossil data, the formation was deposited during a short interval in early to mid Coniacian times (McArthur et al. Reference McArthur, Crame and Thirlwall2000, Crame et al. Reference Crame, Pirrie and Riding2006). The measured thickness of the Hidden Lake Formation is about 360 m in the Brandy Bay area (Crame et al. Reference Crame, Pirrie and Riding2006), and at least 400 m at its southern outcrop (Whitham et al. Reference Whitham, Ineson and Pirrie2006).
The next sedimentary group, the Marambio Group defined by Rinaldi et al. (Reference Rinaldi, Massabie, Morelli, Rosenman and del Valle1978), consists of four formations (Santa Marta, Snow Hill, López de Bertodano and Sobral) cropping out on the James Ross, Vega, Humps, Cockburn, Snow Hill and Seymour islands (Pirrie et al. Reference Pirrie, Duane and Riding1992, Pirrie et al. Reference Pirrie, Crame, Lomas and Riding1997). The volcaniclastics of the Hidden Lake Formation, the uppermost formation of the Gustav Group, are conformably overlain by fine-grained low-energy shelf sedimentary rocks of the Santa Marta Formation, which was first subdivided into three members by Olivero et al. (Reference Olivero, Scasso and Rinaldi1986). Crame et al. (Reference Crame, Pirrie, Riding and Thomson1991) assigned the Alpha and Beta members of Olivero et al. (Reference Olivero, Scasso and Rinaldi1986) to the Lachman Crags Member and the Gamma Member of Olivero et al. (Reference Olivero, Scasso and Rinaldi1986) to the Herbert Sound Member. Various members of the Santa Marta Formation were defined by Pirrie et al. (Reference Pirrie, Crame, Lomas and Riding1997) in the Admiralty Sound region in the southeastern part of JRI. The Santa Marta Formation is ∼1100 m thick (Olivero et al. Reference Olivero, Scasso and Rinaldi1986, Crame et al. Reference Crame, Pirrie, Riding and Thomson1991, Scasso et al. Reference Scasso, Olivero and Buatois1991) and was deposited from late Coniacian to late Campanian times (McArthur et al. Reference McArthur, Crame and Thirlwall2000). The thickness of the Santa Marta Formation in the Admiralty Sound region is < 1000 m (Pirrie et al. Reference Pirrie, Crame, Lomas and Riding1997). The overlying Snow Hill Island Formation, with an overall thickness of > 610 m, was defined by Pirrie et al. (Reference Pirrie, Crame, Lomas and Riding1997) from Snow Hill and Seymour Islands. The Snow Hill Island Formation was deposited during the late Campanian to early Maastrichtian times (McArthur et al. Reference McArthur, Crame and Thirlwall2000) in a middle- to outer-shelf environment. The López de Bertodano Formation was introduced by Rinaldi et al. (Reference Rinaldi, Massabie, Morelli, Rosenman and del Valle1978), but was later extended by Pirrie et al. (Reference Pirrie, Crame, Lomas and Riding1997) to the strata cropping out on the north-east Spath Peninsula, Snow Hill Island and Seymour Island with the overall thickness of 1190 m (Macellari Reference Macellari1988). This formation developed in a marine shelf environment in mid Maastrichtian and early Danian times (Pirrie et al. Reference Pirrie, Crame, Lomas and Riding1997). The uppermost formation of the Marambio Group is the Sobral Formation, which was deposited in a prograding delta environment during the earliest Paleocene (Danian). The formation, which crops out only on Seymour Island, has a measured thickness of 255 m (Macellari Reference Macellari1988).
The youngest sedimentary group of the JRB, the Seymour Island Group, is of Palaeogene age and crops out on the Seymour Island only. It comprises two formations: the Cross Valley and La Meseta formations (Elliot & Trautman Reference Elliot and Trautman1982, Porebski Reference Porebski1995, Marenssi et al. Reference Marenssi, Net and Santillana2002). The Cross Valley Formation is 105 m thick and was deposited in a submarine canyon environment in late Paleocene times (Elliot Reference Elliot1988); the La Meseta Formation is a 720 m thick composite incised-valley system cut into the emergent marine shelf (Porebski Reference Porebski1995, Reference Porebski2000, Marenssi et al. Reference Marenssi, Net and Santillana2002). The latter provides a complete record of the Eocene with a glacial event capping the succession, close to the Eocene/Oligocene boundary (Ivany et al. Reference Ivany, Van Simaeys, Domack and Samson2006).
Fission track thermochronology
Analytical and experimental methods
All sandstone samples were about 5 kg in weight. We collected 13 samples, and only 11 samples yielded sufficient numbers of grains or measurable tracks for fission track (FT) dating (Figs 1 & 2). Apatite and zircon concentrates were prepared using a conventional crushing and separation technique. Analytical FT procedures follow the technique outlined by Hurford (Reference Hurford1990) for apatites and by Tagami et al. (Reference Tagami, Lal, Sorkhabi, Ito and Nishimura1988) and Murakami & Svojtka (Reference Murakami and Svojtka2007) for zircons. Apatite grains were mounted in EPOFIX® resin, while zircons in a PFA Teflon® sheets. To reveal internal surfaces, both apatite and zircon mounts were ground and polished in diamond pastes and then chemically etched. In the case of zircons, the grains mounted in the PFA Teflon® sheets were repeatedly ground and polished with grains arranged in the same direction, parallel to the c-axis. After grinding and polishing, the spontaneous tracks in the apatites were etched in 2.5% HNO3 for 70 seconds at room temperature, and the zircons were etched in a molten NaOH-KOH eutectic etchant at 225 ± 1°C. In order to normalize length measurement in zircons, spontaneous tracks were etched step-by-step until surface tracks perpendicular to crystallographic c-axes became ∼1 μm wide (∼25 hrs for most of samples) for age determination and ∼2 ± 0.5 μm wide for length determination for a maximum number of suitable grains in each mount (Yamada et al. Reference Yamada, Tagami and Nishimura1995a). After micas were attached to mineral mounts and to dosimeter glasses (IRMM 540R for zircons, CN5 for apatites), the samples were stacked and packed in a PE-tube for irradiation in a nuclear reactor (TRIGA Mk. II Research Reactor, The Oregon State University-OSTR). After irradiation, the external mica detectors were detached and etched in 38% HF at 32°C for 8 minutes for zircons, and in 38% HF at 20°C for 20 minutes for apatites. The densities and lengths of tracks were counted using an Axioplan 2 (Zeiss) microscope with a magnification of 1600× (using a dry objective) equipped with an automated Autoscan™ stage. A drawing tube attachment to the microscope and digitising tablet were used for length measurements. The fission track length and angles to the c-axes of horizontal confined tracks (HCT; Laslett et al. Reference Laslett, Kendull, Gleadow and Duddy1982) were measured in transmitted light with a precision of ∼± 0.1 μm and ± 1°. Only track lengths with widths of 1 ± 0.5 μm were measured to minimise the overetching bias. We have adopted orientation criteria to distinguish the tracks at an angle of 60° or higher to the c-axis (Fig. 3 and Table I) with the aim to eliminate the effect of anisotropic annealing (Yamada et al. Reference Yamada, Tagami, Nishimura and Ito1995b).
Data analysis
Analytical data recently obtained are summarized in Tables I & II and Figs 3 & 4. FT ages were calculated using zeta calibration (Hurford & Green Reference Hurford and Green1982) with a ζIRMM540R = 292 ± 8 and ζCN5 = 303 ± 8 for apatites and ζIRMM540R = 184 ± 3 for zircons. Error estimates follow the conventional approach of Green (Reference Green1981a) and are quoted as ± 1σ. The probability of grains counted in a sample belonging to a single population of ages is assessed by a chi-squared test (Galbraith Reference Galbraith1981). Accordingly, the FT ages were determined as mean ages for P(χ2)-values > 5% and pooled ages for P(χ2)-values < 5% (Galbraith Reference Galbraith1981, Tables I & II). The microprobe analyses are determined using a Cameca SX100 microprobe equipped with WDS analysing mode. The microprobe data are listed in Table V as an average for individual rock samples. Age data on the radial plot and histograms (Figs 3 & 4) were drawn by the Trackkey program (Dunkl Reference Dunkl2002).
Microprobe analyses of apatite grains described as average values with standard deviations.

Operating parametrs for samples KFC-1. KHL-1. KSM-2. KLB-1: 2 μm beam size. 15 kV acceleration voltage. 20 nA. Standard names: SiO2 (Si). Y Al garnet (Y). MgO (Mg). Hg2Cl2 (Cl). barite (S. Ba). coelestine (Sr). diopside (Ca). apatite (P. F). Fe2O3 (Fe). spinel (Mn). monazite (Ce. La. Nd). REE3 (Pr). Operating parametrs for sample KS05-2: measuring of Cl – cond.1: 2 μm beam size. 15 kV. 10 nA; measuring of other elements – cond. 1: 2 μm beam size. 15 kV. 2 nA; cond.2: 2 μm beam size. 15 kV.20 nA. Standard names: SiO2 (Si). Y Al garnet (Y). tugtupit (Cl). barite (S. Ba). coelestine (Sr). apatite (P. Ca). Fe2O3 (Fe). spinel (Mn). monazite (Ce. La. Nd). REE3 (Pr). flourite (F). jadeite (Na). Al2O3 (Al). leucit (K). Major a trace elememts are in wt.%. nd - under detection limit. n – not measured. Errors are referred to the final digits.
Results and interpretations
In order to reconstruct the timing of possible heating or denudation events, the relationships between the ages and mean track lengths of apatites and zircons are demonstrated in Figs 3 & 4. Fission tracks are thermally unstable, and thermal annealing is reflected by the track length shortening. For a given period of time and temperature, they will partially (PAZ: partial annealing zone) or even totally disappear due to the restoration of the crystal lattice. Geological annealing temperatures have been reliably determined as being between ∼210 and 320°C (± 60°C at ± 2σ) for zircon and in the range of ∼60°–125°C for apatite, depending on the model used (e.g. Green et al. Reference Green, Duddy, Gleadow, Laslett and Tingate1986, Wagner & Van den haute Reference Wagner and Van den haute1992, Yamada et al. Reference Yamada, Tagami and Nishimura1995a, Tagami et al. Reference Tagami, Galbraith, Yamada and Laslett1998). The distributions of the FT age spectra can be generally classified into three types (cf. Tagami et al. Reference Tagami, Carter and Hurford1996): a) all age components are older than, or equal to, the depositional age (i.e. for unannealed grains; T max < T PAZ). b) Partially reset samples, with T max = span of PAZ, where a significant number of grains are younger than the depositional age if samples are heated up to the PAZ; the age spectrum contains different age peaks. c) Samples heated above the PAZ in totally reset samples, where T max > PAZ. The samples studied are mostly sandstones, which contain detrital zircon and apatite grains derived from various rocks. The minerals therefore retain inherited sources, reflecting their potential provenance areas, and FT dating of detrital minerals with a wide spread in single-grain ages has been used in provenance analysis, for stratigraphic correlation and to reconstruct source terrane exhumation (e.g. Carter Reference Carter1999).
Zircon fission track results
Zircon FT ages range between 70 ± 3 and 194 ± 15 Ma and, apart from one sample (KS05-2), are older than the ages indicated by apatites from the same sample. With the exception of three samples (KS05-2, KSM-2, KWB-3), all analyses passed the P(χ2)-test at 5% criterion. The mean track lengths (L; Table I) of most zircons fall within the range of 9.2 to 10.4 μm, with a standard deviation of 0.9 to 1.5 μm accompanied by a limited number of short tracks of about 6–7 μm. Most measured track length distributions are characterised by unimodal, slightly negatively skewed distributions (Fig. 3).
Two zircon samples from the Gustav Group, NW James Ross Island (Table I; Fig. 3a), passed the χ2-test at 5% criterion (KKP01, KHL-1), and their ages should therefore represent well-clustered single-grain ages of unreset samples (T max < ∼230°C). Detrital zircons reflect the contribution of an inherited component from different age sources. In the case of sample KWB-3 (and partially KFC-1) from the Gustav Group, north-west James Ross Island, that failed the χ2-test, a significant number of ages younger than depositional ages can be explained either by heating to the zircon PAZ or, alternatively, by slow cooling after the heating above the zircon PAZ. Three samples (KKP01, KFC-1, and mainly KWB-3) were collected in proximity of a volcanic stock, and thus, short tracks found in the samples can probably be explained as a result of heating after deposition.
Zircon single-grain fission track age data from the James Ross Island (Gustav Group), Antarctica. Data are presented as: (A) age histogram with a probability spectrum; (B) radial plots of ages, and (C) horizontal lengths histogram. Listed in the age spectra diagrams are the numbers of crystals (n) dated, mean fission-track ages (T) with± 1σ errors and probability (P) of χ2 values. Mean track length with 1 standard error and number of measured tracks are plotted for tracks in all crystallographic orientations as well as for only those that are > 60° to c axis (Yamada et al. Reference Yamada, Tagami and Nishimura1995a). Shaded zone in the age spectrum and radial plots represent the depositional age (see Table I) estimated from biostratigraphic data. For the locations of samples see Figs 1 & 2.

Zircons from the Kotick Point Formation (KKP01 and KFC-1) potentially yielded two groups of ages: less than ∼100 Ma (with range of 80–100 Ma) and more than ∼130 Ma. In the case of zircons from KKP01, two sets of ages were recognised. The first one is a younger spectrum of the Late Cretaceous ages (3 grains; ∼94 ± 15 Ma), whilst the second is of Early Jurassic ages (20 grains; ∼186 ± 15 Ma). The distributions of the two sets of ages are similar for KFC-1 and KHL-1 (Kotick Point and Hidden Lake Formations, respectively). These two samples are more or less slightly annealed to the zircon PAZ as indicated by the appearance of a proportion of short tracks between 7–8 μm in length.
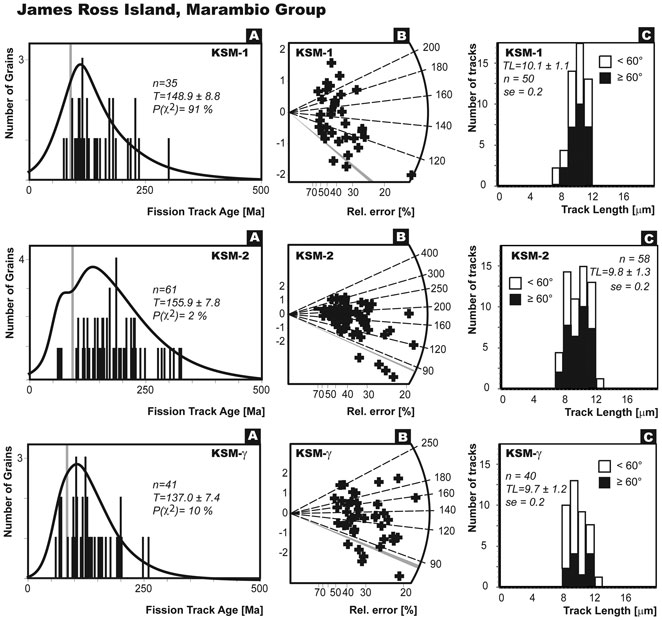
Three samples from the James Ross Island were from the Santa Marta Formation, which is the basal formation of the Marambio Group. Sample KSM-1 is from the lower Lachman Crags Member (basal α-member of Olivero et al. Reference Olivero, Scasso and Rinaldi1986) of the Santa Marta Formation (Upper Coniacian–Lower Santonian depositional age), whereas sample KSM-2 is from the upper Lachman Crags Member (middle β-member of Olivero et al. Reference Olivero, Scasso and Rinaldi1986). The third sample (KSMy) was collected from the Herbert Sound Member (γ-member of Olivero et al. Reference Olivero, Scasso and Rinaldi1986) of the Santa Marta Formation, which has been dated on the basis of microfossils to be of Campanian age (Pirrie Reference Pirrie1994, McArthur et al. Reference McArthur, Crame and Thirlwall2000). These samples show FT ages (Fig. 3b) that range from Middle/Lower Jurassic age (155.9 ± 7.8 Ma, 148.9 ± 8.8 Ma) to Lower Cretaceous (137.0 ± 7.4 Ma), overlapping within their 1 σ errors (Table I). Track length distributions (Fig. 3b) vary from the unimodal character of samples KSM-1 and KSMy to a bimodal pattern in sample KSM-2. The single-grain ages in each of these three slightly annealed samples have two to five grains with ages about ∼80 Ma, which lie close to the depositional age (see Table I). The rest of the grains have varied ages, which tend to range between ∼90 and 350 Ma and probably represent various source components with different ages (see for further details discussion below).
Zircon single-grain fission track age data from the James Ross Island (Marambio Group), Antarctica. Data are presented as: (A) age histogram with a probability spectrum; (B) radial plots of ages, and (C) horizontal lengths histogram. Listed in the age spectra diagrams are the numbers of crystals (n) dated, mean fission-track ages (T) with ± 1σ errors and probability (P) of χ2 value. Mean track length with 1 standard error and number of measured tracks are plotted for tracks in all crystallographic orientations as well as for only those that are > 60° to c axis (Yamada et al. Reference Yamada, Tagami and Nishimura1995a). Shaded zone in the age spectrum and radial plots represent the depositional age (see Table I) estimated from biostratigraphic data. For the locations of samples see Figs 1 & 2.
Zircon single-grain fission track age data from the Seymour Island (Marambio and Seymour Island Group), Antarctica. Data are presented as: (A) age histogram with a probability spectrum; (B) radial plots of ages, and (C) horizontal lengths histogram. Listed in the age spectra diagrams are the numbers of crystals (n) dated, mean fission-track ages (T) with ± 1σ errors and probability (P) of χ2 values. Mean track length with 1 standard error and number of measured tracks are plotted for tracks in all crystallographic orientations as well as for only those having > 60° to c axis (Yamada et al. Reference Yamada, Tagami and Nishimura1995a). Shaded zone in the age spectrum and radial plots represent the depositional age (see Table I) estimated from biostratigraphic data. For the locations of samples see Figs 1 & 2.

Four zircon ages (Table I) were obtained from Seymour Island (Marambio and Seymour Island groups). These ages plotted on the graph (Fig. 3) show a wide range of Lower Jurassic FT ages (194.1 ± 15.2 for KLB-1), Upper Jurassic FT ages (156.8 ± 7.0 for KS05-1 and 129.8 ± 6.1 for KS05-2) and a Lower Cretaceous FT age (126.5 ± 6.7 for KS05-3) (Table I). Most samples passed the χ2-test at the 5% level (except for KS05-2, which failed the χ2-test), indicating that the measured mean ages may represent the time of cooling across the PAZ of the zircon system. A consistent unimodal track length distribution (TL = ∼9.2–10.4 μm) was obtained with a slight track shortening.
All dated FT zircon ages yield cluster of ages between ∼90–80 Ma, indicating a uniform regional cooling episode documented by Brix et al. (Reference Brix, Faundeez, Hervé, Solari, Fernandez, Carter and Stöckhert2007) over wide areas of the entire Antarctic Peninsula.
Apatite fission track results
Only six apatite FT ages (Table II) were successfully obtained from the rock samples due to the low number of dated grains and the insufficient number of tracks in low-uranium distributions. Because of very low U concentrations, only two samples (KLB-1, KS05-2) revealed satisfactory numbers of horizontal tracks. In contrast to zircon grains, most apatite grains have extremely low χ2 probabilities P(χ2), lower than 1% except for sample KFC-1, indicating that the single-grain ages possess non-Poissonian variation, and that samples should probably evidence slightly reduced provenance ages (Table II). This suggests that the samples were reheated to temperatures up to the PAZ. Most apatites have oval shapes and a whitish colour, indicative of their detrital origin.
Two samples from the Gustav Group in north-west James Ross Island display a broad range of single-grain ages from ∼60 to ∼200 Ma (Fig. 4a). Unfortunately, insufficient numbers of horizontal confined tracks were detected in both samples (KFC-1, KHL-1). While the sample from the Kotick Point Formation (KFC-1) has a relatively high P(χ2) (20%), the fine-grained sandstone sample KHL-1 (Hidden Lake Formation) failed the χ2-test at the 5% criterion. Apatite FT pooled and mean ages range from 144.9 ± 13.0 Ma to 108.4 ± 5.6 Ma, both statistically older than their depositional ages. Both of these samples contain many grains with individual ages, but an obvious trend is the age spectrum of partially reset samples to apatite PAZ with grains younger than the depositional age.
Apatite single-grain fission track age data from the James Ross Island (Gustav Group), Antarctica. Data are presented as: (A) age histogram with a probability spectrum; and (B) radial plots of ages. Listed in the age spectra diagrams are the numbers of crystals (n) dated, mean fission-track ages (T) with ± 1σ errors and probability (P) of χ2 values. Shaded zone in the age spectrum and radial plots represent the depositional age (see Table II) estimated from biostratigraphic data. For the locations of samples see Figs 1 & 2.

Four samples were taken from the Marambio and Seymour Island groups on Seymour Island. The distribution of lengths (Fig. 4b) has a unimodal pattern for sample KLB-1 (López de Bertodano Formation) with a shape typical for slowly cooled rocks (Wagner & Van den Haute Reference Wagner and Van den haute1992) to a bimodal pattern (KS05-2, Sobral Formation). The observed grain-age distribution is generally older than the depositional age, but contains a minor sub-set of younger depositional ages (cf. KLB-1, KS05-3, Fig. 4b). A χ2 probability of less than 0.1% denotes a non-Poissonian variation for all samples.
Apatite single-grain fission track age data from the Seymour Island (Marambio and Seymour Island Group), Antarctica. Data are presented as: (A) age histogram with a probability spectrum; and (B) radial plots of ages. Listed in the age spectra diagrams are the numbers of crystals (n) dated, mean fission-track ages (T) with ± 1 σ errors and probability (P) of χ2 values. Shaded zone in the age spectrum and radial plots represent the depositional age (see Table II) estimated from biostratigraphic data. For the locations of samples see Figs 1 & 2.

Mineral chemistry of apatites
As the annealing kinetics of fission tracks in apatite are affected by chemical composition, especially the chlorine content (e.g. Barbarand et al. Reference Barbarand, Carter, Wood and Hurford2003), individual apatite grain compositions were measured by microprobe WDS analysis. Table V shows the mean values for each of the five rock samples. All measured apatite grains are higher in fluorine content (fluorapatites) and are relatively homogeneous in their chlorine contents. No correlation was found between single-grain ages and chlorine content. The apatites have variable iron contents; other elements show homogeneous distributions.
Discussion: geological interpretations
Fission track analysis is a geochronological method and a powerful tool for a variety of different applications. It is primarily used to determine the ages of various geological processes, including exhumation (denudation) and cooling of metamorphic and igneous rocks (e.g. Brown et al. Reference Brown, Summerfield and Gleadow1994), but is equally useful in sedimentary provenance studies (e.g. Carter Reference Carter1999). Since the most reliable age assessment of the James Ross Basin sedimentary rocks is that based on biostratigraphy and geochronology (e.g. Olivero et al. Reference Olivero, Scasso and Rinaldi1986, Crame et al. Reference Crame, Pirrie and Riding1991, Reference Crame, Pirrie, Riding and Thomson2006, Pirrie et al. Reference Pirrie, Duane and Riding1992, McArthur et al. Reference McArthur, Crame and Thirlwall2000), our aim was to reconstruct provenance ages and the lower-temperature history of the JRB sedimentary rocks by combining the newly obtained FT ages and the previously published biostratigraphic and geochronological age determinations.
Pre-depositional and burial history
The north-west James Ross Island and Seymour Island FT samples reveal a wide spread of ages (see Tables I & II) compatible with the main magmatic episodes between ∼240 Ma and 10 Ma (e.g. Pankhurst Reference Pankhurst1982, Leat et al. Reference Leat, Scarrow and Millar1995, Millar et al. Reference Millar, Willan, Wareham and Boyce2001), during the Jurassic break-up of Gondwana and subsequent segmentation of West Antarctica (Millar et al. Reference Millar, Willan, Wareham and Boyce2001). On northern Palmer Land (Antarctic Peninsula), the emplacement of granitic magma (∼230 to 200 Ma) started in the Triassic (Millar et al. Reference Millar, Pankhurst and Fanning2002) in response to the initial stages of subduction along the Gondwana margin (Pankhurst Reference Pankhurst1982). However, Vaughan & Livermore (Reference Vaughan and Livermore2005) have argued that this magmatism is in response to a Pangaea-wide episode of tectonism and magmatism in this interval. Available geochronological data suggest a Permian-Triassic age of the weakly metamorphosed sequence of the Trinity Peninsula Group (TPG), and that the plutonism associated with the Antarctic Peninsula Volcanic Group (APVG) is of Late Triassic age (Pankhurst Reference Pankhurst1982).The most important plutonic events occurred in the Early Jurassic (∼180–160 Ma; Pankhurst Reference Pankhurst1982, Leat et al. Reference Leat, Scarrow and Millar1995), Early Tertiary (∼60–50 Ma; e.g. Pirrie Reference Pirrie1994) and, most importantly, in the Cretaceous (∼145–80 Ma; e.g. Pankhurst Reference Pankhurst1982, Vaughan et al. Reference Vaughan, Wareham, Johnson and Kelley1998) for volcanic succession in the northern Antarctic Peninsula region.
Sedimentary rocks from the north-western James Ross Island (cf. samples KFC-1, KHL-1, KSM-2 and KSMy, Figs 1 & 2) were buried to a maximum depth of 400–2700 m during the Early Maastrichtian time (∼70 Ma); see Table III for further details. The maximum burial of the Gustav Group samples reached 3 km, indicative of heating to temperatures up to ∼100°C. It is evident that the calculated burial temperatures (Table III) are not sufficient to change fission track lengths in zircons, as they are below the lower limit of the PAZ (∼210°C). In addition, all zircon grains are characterised by mean track lengths of ∼10–11 μm and show a dominantly unimodal distribution without systematic reduction of FT length. Accordingly, the possible shortening of tracks in zircon populations from the north-western part of the James Ross Island may reflect some thermal influence on the crystals before deposition, because the samples contain older grains subjected to heating before deposition. Alternatively, the samples were possibly subjected to local advective heating and have been heated and annealed only mildly by the later possible volcanic influence. We think that the latter case is probably more appropriate.
In the case of apatites, ages younger than the depositional age suggest that apatites have been strongly annealed and that the host rock might have experienced the more heated part of the PAZ for apatites.
Zircon and apatite FT samples from James Ross Island (Gustav and Marambio groups) could have been transported into the James Ross Basin from the westerly lying Mount Reece–Mount Bradley region to the west, where granitic rocks of the Antarctic Peninsula batholith are present. Triassic FT ages (>∼200 Ma), which were determined for a significant number of grains, particularly in the Kotick Point Formation samples, possibly relate to Triassic TPG rocks or to the Late Triassic initial phase of granitic magma emplacement in the Late Triassic proposed by Millar et al. (Reference Millar, Pankhurst and Fanning2002). Sedimentary rocks from Seymour Island (Marambio and Seymour Island groups) display a wide scatter of individual ages ranging from > ∼300 Ma to 60 Ma. Permian and Triassic FT ages (>200 Ma) are probably compatible with an origin from the TPG units to the west and north-west, whereas the dominant Jurassic and Cretaceous FT ages probably relate to the younger plutonic phase (mainly 130–100 Ma) of the APVG.
The coarse-grained sedimentary rocks of the Gustav Group represent rapidly deposited proximal accumulations in the subsiding back-arc JRB along the fault-controlled western margin of the basin (e.g. Ineson Reference Ineson1989, Pirrie et al. Reference Pirrie, Duane and Riding1992). These sedimentary rocks are strongly tilted toward the south-east and south, with dips between 85° and 35° due to the progressive syndepositional tilting (Whitham & Marshall Reference Whitham and Marshall1988, Hathway Reference Hathway2000 and unpublished data of the authors). The high input of sedimentary rocks resulted in a filling of the basin and in changes in its geometry. The Kotick Point Formation sedimentary rocks (Aptian to Albian) were buried to the maximum depth of ∼2.5 to 2.8 km close to the Campanian/Maastrichtian boundary. The Early Upper Cretaceous Whisky Bay Formation (Late Albian to Late Turonian) was buried to the maximum depth of ∼1.5–2 km at the Campanian/Maastrichtian boundary (see Table III for further details). The youngest formation of the Gustav Group, the Hidden Lake Formation together with the overlying Marambio Group, was deposited in more stable distal shelf environments and influenced by the diminished rate of the arc uplift (Elliot Reference Elliot1988). These formations are also much less tilted toward the south-east (usually 5° to 15°, max. to 30°, Whitham & Marshall Reference Whitham and Marshall1988, Whitham et al. Reference Whitham, Ineson and Pirrie2006 and unpublished data of the authors) than sedimentary rocks of the lower Gustav Group (Ineson et al. Reference Ineson, Crame and Thomson1986, Crame et al. Reference Crame, Pirrie and Riding2006). The Coniacian strata of the Hidden Lake Formation were buried to the depth of > 1 km close to the Campanian/Maastrichtian boundary (see Table III for details).
During the deposition of fine-grained sandstones and siltstones of the Santa Marta Formation (in the Late Campanian), the JRB was divided by a large-scale NE–SW reverse fault (Pirrie et al. Reference Pirrie, Crame, Lomas and Riding1997). Based on our field observations, we suggest that it was a system of parallel faults, as this trend is morphologically prominent throughout JRI, even in its general configuration; as exemplified by the NE–SW orientation of the island’s major morphological divide defined by Croft Bay and Röhss Bay. It is thought likely that no further deposition after this tectonic event has occurred in the north-western James Ross Island, as the proximal portion of the basin underwent inversion (Hathway Reference Hathway2000), but the basinward progradation of shallow-marine sedimentary rocks continued in the south-western part of the James Ross Basin. The Santa Marta Formation sedimentary rocks may have therefore been buried to depths of only 0.4–1.1 km at the Campanian/Maastrichtian boundary. We assume that the beginning of the denudation of sedimentary strata in the north-western JRI started approximately at the Campanian/Maastrichtian boundary (∼70 Ma).
The Seymour Island samples may have been buried to very variable maximum depths during the Latest Eocene (∼35 Ma), at the end of sediment deposition in the basin (Marenssi et al. Reference Marenssi, Net and Santillana2002, Ivany et al. Reference Ivany, Van Simaeys, Domack and Samson2006). Consecutively, the Marambio Group samples were buried to a depth between 1 and 2 km (see Table III for further details) and possibly exposed to temperatures of ∼30° to > 50°C. Even for the sample KLB-1, the burial temperature lies close to the lower limit of the apatite PAZ (∼60°C); although the sample may have experienced limited post-depositional annealing.
Final uplift - T-t modelling
Two of the apatite fission track data sets reported above were inverse-modelled using the HeFTy modelling software (Ketcham Reference Ketcham2007) in order to constrain the low-temperature history of sedimentary rocks consistent with the measured horizontal confined tracks and single-grain ages (Fig. 5). Modelling by HeFTy was used with the annealing formula of Ketcham et al. (Reference Ketcham, Donelick and Carlson1999), which is sensitive from the PAZ temperature up to 21°C. This programme generates the possible time-temperature paths by the Monte Carlo algorithm.
“Best-fit” thermal histories obtained from modelling of apatite fission-track data (samples KLB-1 and KS05-2, see text for details) by HeFTy software (Ketcham Reference Ketcham2007). Modelled results in the T-t diagram are indicated by three different reliability levels: (a) horizontal hatching envelope as acceptable fit; (b) grey envelope as good fit; and (c) black line is the path with the best fit (trajectory marked by dashed-line is potential T-t path bellow PAZ). Independent geological constraints are indicated by a dashed-line rectangle.

Unfortunately, samples taken in north-western James Ross Island did not yield a sufficient number of horizontal confined tracks in apatites and could not therefore be used for modelling the burial/erosional history of the Gustav Group and Marambio Group sedimentary rocks.
The mean track lengths of two apatite fission track samples (Seymour Island, Marambio and Seymour Island groups; KLB-1 and KS05-2) range from 11 ± 2.3 to 12.9 ± 1.3 μm (± 1 σ uncertainties) with a relatively well-defined peak in the range of 12 to 14 μm. Such track length distributions are typical for samples that have undergone annealing below the PAZ and subsequent cooling history (Wagner & Van den Haute Reference Wagner and Van den haute1992). Regardless of the limited number of track length measurements, both apatite samples show a similar thermal history style (Fig. 5), involving a period of total thermal annealing, subsequent cooling, when the samples were above 120°C until about the Late Triassic (∼230 to 200 Ma), and a period of steady cooling through the whole apatite PAZ to the minimum temperature in the Paleocene/Early Eocene (cf. Table III). On the basis of FT analysis, the most rapid denudation of the north-western JRI strata occurred during the Paleogene, with average rates of ∼50–70 m/Ma with a progressive reduction in the rate of denudation in the Neogene and Quaternary. The maximum reburial of sedimentary rocks dates to the Eocene (∼35 Ma), and the final accelerated uplift of the Seymour Island sedimentary rocks (Marambio Group) started at ∼35 to 20 Ma, which is in agreement with the thermal history proposed from geological evidence given in Table III.
This final exhumation is connected with the end of deposition in the James Ross Basin, which coincides with the first traces of glaciation in the Seymour Island area (Ivany et al. Reference Ivany, Van Simaeys, Domack and Samson2006). Glacial erosion was a very strong agent in removing especially in the fine-grained Marambio and Seymour Island Group sedimentary rocks. During the last ∼30 Ma, the surface of Seymour Island was carved to its present shape. Although the volcanic record of the James Ross Island Volcanic Group started as early as at 10 Ma (Dingle & Lavelle Reference Dingle and Lavelle1998, Smellie Reference Smellie1999) and continued until relatively recently, with the youngest recorded intrusions at c. 130 ka (Smellie et al. Reference Smellie, McArthur, McIntosh and Esser2006), evidence of associated volcanic rocks on the Seymour Island is still scarce. Our geological mapping recorded occurrences of doleritic dykes (1–2 m thick) on the Seymour Island, which provides evidence of volcanic activity. Thus, the volcanic occurrences on Seymour Island were tested by T-t modelling for different geological constraints. Modelling of Seymour Island FT data shows that the time-temperature trajectory of the measured confined horizontal tracks and obtained FT ages gives the best statistical fit under the same conditions that were observed for the James Ross Island volcanic record mentioned above (∼10 Ma to 130 ka). Therefore, we hypothesise that it underwent similar volcanic activity as in the surroundings of the James Ross Island; this proposed volcanic event is shown in Fig. 5.
Conclusions
Based on the outcrops on the James Ross and Seymour islands, detrital zircons and apatites were dated using fission track analysis. FT provenance ages of individual zircons and apatites from the study area show a wide spread from the Carboniferous to the Early Paleogene (∼315 to 60 Ma, see Figs 3 & 4).
It is probable that the FT dating and track shortening of individual zircons and apatites from the samples taken on north-west James Ross Island and Seymour Island reveal the pre-depositional history of individual crystals before entering the James Ross Basin (i.e. the varied source terranes, see Pirrie Reference Pirrie1991). Age components younger than the depositional ages suggest heating up to or across the zircon PAZ (T max < ∼250–320°C), and the grains thus retain slightly reduced provenance ages. Sedimentary rocks from north-western James Ross Island (Gustav and Marambio Group) and Seymour Island (Marambio and Seymour Island Group) yielded two main clusters of zircon FT ages: Early to Late Jurassic and Lower Cretaceous. In the case of apatites, samples have been affected by annealing in their PAZ to a higher degree than zircons. Jurassic–Cretaceous ages of sedimentary grains in the northwest James Ross Island sections can be explained by sediment influx from the westerly lying Mount Reece and Mount Bradley region to the west compatible with palaeocurrent and provenance data (Ineson Reference Ineson1989, Buatois & Medina Reference Buatois and Medina1993) All FT dated sedimentary rocks sampled on Seymour Island were probably derived from the Trinity Peninsula Group and Antarctic Peninsula Volcanic Group.
The remarkable aspect of the recently obtained FT data is the clustering of the zircon FT data around 90 Ma from samples covering the whole of James Ross Island, confirming a uniform regional cooling episode documented from different geological units over wide areas of the Antarctic Peninsula (Brix et al. Reference Brix, Faundeez, Hervé, Solari, Fernandez, Carter and Stöckhert2007).
The FT data suggest that the sedimentary rocks of north-western James Ross Island were buried to different maximum depths. Based on biostratigraphic data, the Gustav Group sedimentary rocks were buried to 1 to 3 km with maximum temperatures of ∼50–100°C. Sedimentary rocks of the Marambio Group were buried to 0.4–1.1 km only (with maximum temperatures ∼25–45°C) during the Early Maastrichtian (∼70 Ma), when the basin fill was segmented by a large-scale NE–SW reverse fault. North-western James Ross Island strata experienced denudation after that time, the most rapid denudation occurring during the Paleogene with average rates of ∼50–70 m/Ma with a progressive reduction in denudation rate in the Neogene and Quaternary. The Seymour Island samples were possibly buried to variable maximum depths during the latest Eocene (∼35 Ma), after the end of sediment deposition. Consequently, the Marambio Group samples from Seymour Island were buried to a depth between 1 and 2 km and could have reached a temperature of ∼30 to > 60°C. The maximum burial of the Seymour Island Group sedimentary rocks was on the order of first hundreds of a few metres with only negligible burial temperatures.
Acknowledgements
Support provided through the project of the Ministry of Education, Youth and Sports (1K05030), AVOZ30130513 and SPII1a9/23/07 (Ministry of the Environment of the CR) is gratefully acknowledged. We are indebted to Drs Charles W. Naeser (Fish Canyon Tuff - FC3) and Andrew Carter (Buluk Member Tuff - BM) for providing fission track age standards. The fieldwork of DN and PM during the 2004-2005 expeditions to the James Ross Island was financed by the R & D project VaV/660/1/03 of the Ministry of the Environment of the Czech Republic granted to the Czech Geological Survey. Thanks are due to Jan Košler and Bedřich Mlčoch for their assistance in the field. We also wish to express our thanks to Vlasta Böhmová for microprobe analyses, Jana Rajlichová for drawing two figures, and František Veselovský for his help with mineral separation. Constructive reviews from Jon Ineson and Manfred Brix as well as editorial handling of manuscript by Alan Vaughan significantly improved the manuscript.



