
I. INTRODUCTION
Uranium molybdenum fuel is a candidate material for both fast and research reactors. The U–Mo fuel shows a higher melting point (solidus temperature) with increasing the Mo content, in the range of 8–40 at.% Mo. Among that, the alloy with ∼33 at.% Mo forms a tetragonal U2Mo phase below ∼600 °C. However, during reactor operation, the cubic γ-(U) phase will remain in the metastable state even below 600 °C due to irradiation-induced phase reversion. Reference Meyer, Gan, Jue, Keisar, Perez, Robinson, Wachs, Woolstenhulme, Hofman and Kim1 As the cubic phase is isotropic, it provides the advantage of isotropic expansion and uniform thermo-physical property, like thermal conductivity. The cubic BCC phase also has the advantage of higher solubility of the alloying elements, which minimizes fuel constituent migration. Reference Mariani, Porter, Blackwood, Jones, Olson, Mishra, Kennedy and Hayes2 Higher melting point of the fuel ensures a higher safety margin for fuel melting during the off-normal condition. The higher melting point also ensures a larger temperature range for reactor operation. In our earlier article of experimental investigations of the U–Mo fuel, Reference Chakraborty, Choudhuri, Banerjee, Agarwal, Khan and Kumar3 four different compositions of this system were studied. Among them, U–33 at% Mo has the highest melting point (∼1236 °C) compared to that of U–22 at.% Mo (∼1183 °C). Even a rise of ∼50 °C in the melting point (solidus point) is significant for metallic fuels as these alloy compositions have a reasonably high thermal conductivity ∼30 W/mK. The high thermal conductivity prevents a rapid temperature rise of the fuel during normal operations and in the off normal state. The higher melting point also restricts the severity of the fuel clad chemical interaction. Reference Chang4 Modification in neutronics and reactivity due to addition of a higher amount of Mo (2.6 barn neutron cross section) can be compensated with an improved reactor and fuel design. Reference Mariani, Porter, Hayes and Kennedy5
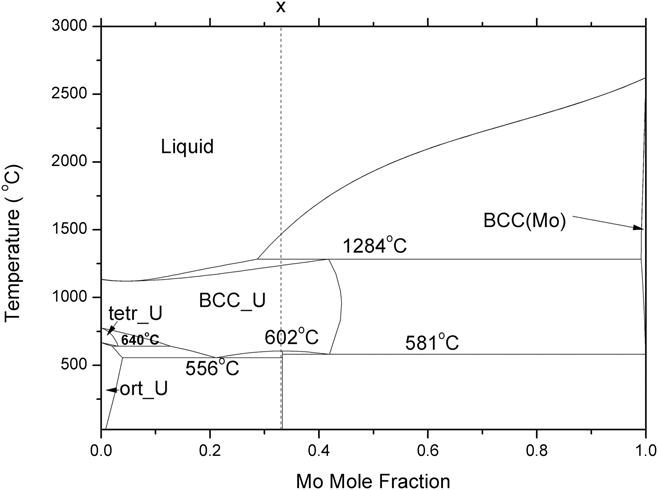
India has a robust, fast breeder reactor program to utilize metallic fuel in future fast breeder reactors. Worldwide, there is renewed interest in U–Pu–Mo metallic fuel as it has higher thermal conductivity, lower thermal expansion, and a higher melting point than that of U–Pu–Zr. Reference Landa, Soderlind, Grabowski, Turchi, Ruban and Vitos6 To understand the properties of the U–Pu–Mo ternary system, a complete understanding of its binary systems is vital. Due to higher fractions of uranium and molybdenum in this ternary fuel, understanding the U–Mo binary system is imperative for property estimations of the U–Pu–Mo system. Figure 1 shows the U–Mo phase diagram calculated using optimized Gibbs energy interaction parameters given by Zhang. Reference Zhang, Cui, Xu, Zhu, Liu, Yin and Jin7 Uranium has three allotropic forms viz. α (base centered orthorhombic), β (tetragonal), and γ (BCC) with a melting point of 1135 °C. Mo remains in the BCC crystal structure up to its melting point at 2623 °C. Due to significant solubility of molybdenum in the BCC-γ-(U) phase, the later gets stabilized to a wider temperature range. As seen from Fig. 1, the U–Mo melt with >29 at.% Mo goes through a peritectic equilibrium at 1284 °C during cooling, liq. (29 at.% Mo) + (Mo) (99 at.% Mo) = γ-(U) (42 at.% Mo). The liquid alloys containing less than 28.7 at.% Mo freeze to form the γ-(U) phase. When liquid alloys containing 29–42 at.% Mo are cooled, first the BCC (Mo) phase precipitates out, which has ≤0.9 at.% U. Further cooling results in a peritectic reaction at 1284 °C, under equilibrium condition. Below this temperature, the system has stable γ-(U) and liquid phases. The temperature of complete disappearance of the liquid varies with the original composition of the melt. The melt with 42 at.% Mo gets frozen into γ-(U) just below the peritectic temperature, 1284 °C. However, this is true only for very slow cooling of the melt, maintaining conditions of complete equilibrium. The (Mo) solid phase, which appears first during cooling of the melt, will remain in the nonequilibrium state due to lower diffusion rates of elements in this phase at temperatures much below its melting point. Further cooling of the system results in precipitation of peritectic γ-(U) at 1284 °C on the surface of the (Mo) dendrite. Hence, the peritectic reaction does not complete during cooling. Alloys containing 29–42 at.% Mo are expected to be single phase γ-(U) below ∼1200 °C, as per the equilibrium phase diagram. Due to nonequilibrium cooling, the resultant microstructure contains both γ-(U) and (Mo) phase. Similarly, most of the fabrication processes involve rapid cooling of the melt, thus generating nonequilibrium conditions in liquid and solid phases. Fast cooling conditions are expected during casting of the arc-melt alloys (∼100 °C/s). Reference Velikanova, Bodar, Artyukh, Bilous, Firstov, Miracle, Senkov, Miracle and Fristov8 Many authors Reference Schaffnit, Stallybrass, Konrad, Stein and Weinberg9 have simulated these cooling processes through the Scheil–Gulliver model. However, the phase field model (PFM) is a much more advanced model than the Scheil–Guilliver model for two reasons. Firstly, the Scheil–Guilliver model assumes complete mixing in the liquid phase (i.e., infinite diffusivity in liquid) and has zero diffusivity in solid. However, in reality, atoms in the liquid and solid phase have a finite diffusion coefficient, and significant difference in the diffusion rates exists in the liquid and solid phase. Due to this, PFM assumes finite diffusivity in the solid and liquid phase, which is a huge improvement over the Scheil-Gulliver model. Secondly, PFM takes into consideration the effect of the interface which the Scheil-Gulliver model fails to take into account.
The optimized U–Mo phase diagram.

Dendritic solidification is a multilength scale pattern formation problem. For the last three decades, it has been proven that the phase field technique is one of the most advanced techniques to study dendritic crystal growth in the mesoscale. Reference Lavernia and Srivatsan10–Reference Boettinger and Warren17 The growth of dendritic crystal is an interface dominated phenomena. In the diffuse interface model, the interface is modeled as a mixture of parent and product phases. Thermal supercooling and compositional super saturation in the solid–liquid interface have pronounced effects on the growth process. Dendritic microstructure under nonequilibrium cooling can be formed under both low undercooling (≤1 °C) and high undercooling (≥100 °C). Reference Lavernia and Srivatsan10 At large undercooling, the dendritic tip velocity is in the range of 1–100 m/s. This velocity range comes in the domain of rapid solidification growth. Reference Schwarz, Arnold, Aziz and Herlach11 At low undercooling, the interface is considered to be in local equilibrium condition. The local equilibrium condition ensures that the Gibbs–Thomson condition has been met and that the flux remains conserved across solid–liquid boundaries.
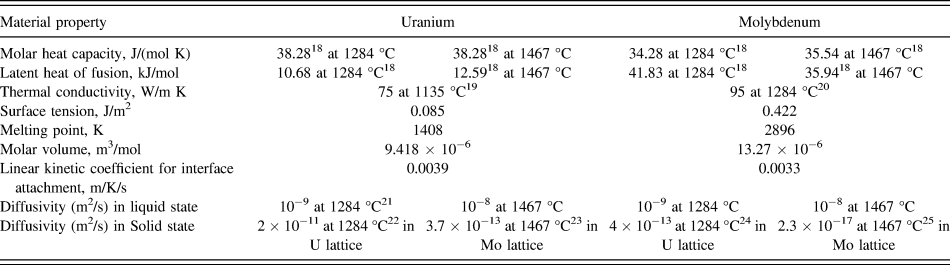
The main objective of this article is to study the microstructural evolution of U–33 at.% Mo during solidification and associated micro-segregation of Mo in dendritic microstructures during casting of the U–Mo metallic fuel. Phase field modeling helps us to understand the effect of liquidus temperature, diffusivity, thermal conductivity, enthalpy of fusion, molar volume, and other basic parameters of the system on microsegregation and crystal growth processes. The present work is focused on interpretation of scanning electron microscopy (SEM) results along with energy dispersive spectroscopy (EDS) results of crystal growth during solidification of the alloy (U–33 at.% Mo) with the help of PFM. The evolution of γ-(U) and BCC-(Mo) dendrites has been studied with PFM and characterized using SEM along with EDS and electron back scattered diffraction (EBSD). An EBSD analysis has been carried out to know the orientation relation between different grains, as well as microsegregation in the as-cast microstructure. The computational results calculated using the PFM were compared with the experimental results. The physical parameters used in the model for the U–Mo system were taken from the literature and are listed in Table I. Reference Dinsdale18–Reference Askill and Tomlin25
Material parameters for the U–Mo system for simulation of γ and Mo rich dendrite.

II. EXPERIMENTAL
U–33 at.% Mo alloys were prepared by arc-melting with required amounts of starting metallic uranium slug (99.86 wt%) and 99.9 wt% pure Mo. After that, cast samples were homogenized at 900 °C for 24 h and then furnace cooled. The SEM samples were metallographically prepared to achieve 1 μm mirror finish. To remove the mechanically deformed layer generated due to polishing, electropolishing was carried out at 15 V DC with a mixture of 25 gm chromic acid (CrO3), 25 cc glacial acetic acid, and 30 mL distilled water for 12 s. The elemental analysis of different phases was carried out using an EDS attached to the SEM. For EBSD works, after getting 1 μm surface finish in mechanical polishing, electro polishing has been carried out using an agitated solution of 45% ethanol, 27% ethylene glycol, and 27% phosphoric acid at 15 V DC for approximately 7 s as the previous electropolishing did not yield the desired surface finish for getting the EBSD pattern. The EBSD scans were carried out in LaB6 CS3200L SEM fitted with a NordlysMAX detector (HKL Technology A/S, Hobro, Denmark) at 20 KV with a step size of 1 μm. The HKL Channel 5 software (HKL Technology A/S) was used for data analysis.
III. PHASE FIELD MODEL (PFM) FOR SOLIDIFICATION
PFM applies a continuum field, i.e., a phase field characterized by a set of conserved [concentration (c) and temperature (T)] and nonconserved [crystal order-parameter (φ)] phase field variables. In the liquid–solid phase transformation, the continuously varying phase-field variable (φ) was taken as 0 in the solid phase, 1 in liquid phase, and changed from 0 to 1 at the solid–liquid interface.
In the model, Reference Loginova and Singer26 it has been considered that the entropy of the system will be maximized during dendritic crystal growth. The entropy function (S) of an isotropic system over volume ‘V’, which is a function of ‘φ’, ‘c’ (concentration of Mo in U–Mo alloy), and ‘e’ (internal energy density which manifests as the temperature of the system), can be written as:
 $$S = \int_V {\left( {{s_{\rm{b}}}\left( {\varphi ,c,e} \right) - {{\varepsilon _\varphi ^2} \over 2}{{\left| {\nabla \varphi } \right|}^2} - {{\varepsilon _{\rm{c}}^2} \over 2}{{\left| {\nabla c} \right|}^2} - {{\varepsilon _{\rm{e}}^2} \over 2}{{\left| {\nabla e} \right|}^2}} \right)} {\rm{d}}V\quad .$$
In the above Eq. (1), the first integral expression (s b(φ, c, e)) represents the bulk-entropy-density for bulk phases. The next three expressions represent gradient energy changes for phase-field-variables ‘φ’, ‘c’, and ‘e’, respectively. The gradient coefficients, εφ, εc, and εe are constant. To simplify these calculations, some acceptable assumptions are made: (i) due to the reasonable thermal conductivity of the metallic system, thermal gradient across the interface is negligible, so εe was ignored and (ii) in the narrow diffuse-interface region, the concentration gradient was considered to be negligible, so εc was ignored.
Evolution equation Reference Loginova and Singer26 for φ is:
 $$\dot{\varphi } = {M_\varphi }\left( {{{\partial {s_{\rm{b}}}} \over {\partial \varphi }} + {\varepsilon _\varphi }^2\nabla \varphi } \right)\quad .$$
The interface mobility (M φ) is a function of the interface diffusivity. It is assumed that the interface mobility of an individual atom depends on alloy composition, interface attachment coefficient, and melting temperature of the elements. The model calculates interface mobility in the following way:
 $${M_\varphi } = \left( {1 - c} \right){M^{\rm{U}}} + c{M^{{\rm{Mo}}}}\quad ,$$
 $${M^{{\rm{U/Mo}}}} = {{{{\left( {T_{\rm{m}}^{{\rm{U/Mo}}}} \right)}^2} \times {\beta ^{{\rm{U/Mo}}}}} \over {6\sqrt 2 {L^{{\rm{U/Mo}}}}\delta }}\quad ,$$
here, M
U/Mo is the mobility of the individual element, L
U/Mo are the latent heats of fusion, δ is the phase field interface thickness, βU/Mo are the kinetic attachment coefficients, and
 $T_{\rm{m}}^{{\rm{U/Mo}}}$
are the melting points of U and Mo, respectively. The latent heat of fusion of U/Mo
 $\hbox( {L_{{\rm{U/Mo}}}^T} \hbox)$
is a function of the temperature [Eq. (5)], whereas, other components are assumed to be independent of temperature.
 $$L_{{\rm{U/Mo}}}^T = L_{{\rm{U/Mo}}}^{{T_{\rm{m}}}} + \int_{{T_{\rm{m}}}}^T {\left( {{c_{P_{{\rm{U/Mo}}}^{\rm{l}}}} - {c_{P_{{\rm{U/Mo}}}^{\rm{s}}}}} \right)} {\rm{d}}T\quad .$$
The heat capacity of the liquid phase is higher than that of the solid phase
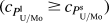 $\hbox( {{c_{P_{{\rm{U/Mo}}}^{\rm{l}}}} \ge {c_{P_{{\rm{U/Mo}}}^{\rm{s}}}}} \hbox)$
. Therefore, the second term in Eq. (5) will be negative when T < T
m and positive when T > T
m. Due to the high melting point of molybdenum, computational temperatures in the present work are lower than those of
 $T_{\rm{m}}^{{\rm{Mo}}}$
; therefore,
 $L_{{\rm{Mo}}}^{\rm{T}} \lt L_{{\rm{Mo}}}^{{T_{\rm{m}}}}$
. Moreover, on further cooling, the latent heat of Mo will continue to decrease. But, in case of uranium, both the liquidus and peritectic temperatures are higher than
 $T_{\rm{m}}^{\rm{U}}$
; therefore,
 $L_{\rm{U}}^T > L_{\rm{U}}^{{T_{\rm{m}}}}$
, but the latent heat difference of U and Mo decreases on cooling.
Evolution equations for conserved concentration and energy are:
 $$\dot{c} + \nabla \cdot {J_{\rm{c}}} = 0\quad ,$$
 $$\dot{e} + \nabla \cdot {J_{\rm{e}}} = 0\quad ,$$
where, J c and J e are concentration and energy flux. g(φ) is a double-well interpolation function of φ and can be represented by:
 $$g\left( \varphi \right) = \left( {{\varphi ^2} - 2{\varphi ^3} + {\varphi ^4}} \right)\quad .$$
The interpolation function p(φ) can be represented by
 $$p\left( \varphi \right) = {\varphi ^3}\left( {10 - 15\varphi + 6{\varphi ^2}} \right)\quad .$$
Accordingly, the model for energy density for pure materials is:
 $${e^{{\rm{U/Mo}}}}\left( {T,\varphi } \right) = {e^{{\rm{U/Mo,s}}}}\left( T \right)\left( {1 - p\left( \varphi \right)} \right) + {e^{{\rm{U/Mo,L}}}}\left( T \right)p\left( \varphi \right)\quad ,$$
where, e U/Mo,s are energy densities for the U and Mo solid phases, and e U/Mo,L are the energy densities for the U and Mo liquid phases. Similarly, other physical properties inside the diffuse interface are interpolated with p(φ). And the final equations are given below.
 $$\dot{\varphi } = {M_\varphi }\left[ {{\varepsilon ^2}{\nabla ^2}\varphi - {\partial \over {\partial x}}\left( {\varepsilon \varepsilon '{{\partial \varphi } \over {\partial y}}} \right) + {\partial \over {\partial y}}\left( {\varepsilon \varepsilon '{{\partial \varphi } \over {\partial x}}} \right) - {W^{\rm{U}}}g'\left( \varphi \right)\left( {1 - c} \right) - 30g\left( \varphi \right){L_{\rm{U}}}\left( {{1 \over T} - {1 \over {T_{\rm{m}}^{\rm{U}}}}} \right)\left( {1 - c} \right) - {W^{{\rm{Mo}}}}g'\left( \varphi \right)c - 30g\left( \varphi \right){L_{{\rm{Mo}}}}\left( {{1 \over T} - {1 \over {T_{\rm{m}}^{{\rm{Mo}}}}}} \right)c - {1 \over T}{{{\rm{d}}\Omega } \over {{\rm{d}}\varphi }}c\left( {1 - c} \right)} \right]\quad ,$$
 $$\dot{c} = {1 \over {{D_{\rm{L}}}}}\nabla \cdot {{{V_{\rm{m}}}} \over R}c\left( {1 - c} \right){D_{{\rm{eff}}}}\left[ {\left( {{R \over {{V_{\rm{m}}}}}{1 \over {c\left( {1 - c} \right)}} - {2 \over T}\Omega \left( \varphi \right)} \right)\nabla c + \left( {{1 \over T}{{{\rm{d}}\Omega } \over {{\rm{d}}\varphi }}\left( {1 - 2c} \right) + {W^U}g'\left( \varphi \right) + 30g\left( \varphi \right){L_{\rm{U}}}\left( {{1 \over T} - {1 \over {T_{\rm{m}}^{\rm{U}}}}} \right) - {W^{{\rm{Mo}}}}g'\left( \varphi \right) - 30g\left( \varphi \right){L_{{\rm{Mo}}}}\left( {{1 \over T} - {1 \over {T_{\rm{m}}^{{\rm{Mo}}}}}} \right)} \right)\nabla \varphi } \right]\quad ,$$
 $$C\dot{T} = \nabla K\nabla T - 30g\left( \varphi \right)\left( {\left( {1 - c} \right){L_{\rm{U}}} + c{L_{{\rm{Mo}}}}} \right)\dot{\varphi }\quad .$$
W
U and W
Mo are constants which represent energy humps at the solid–liquid interface of pure U and Mo and are given by
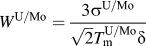 ${W^{{\rm{U/Mo}}}} = {{3{\sigma ^{{\rm{U/Mo}}}}} \over {\sqrt 2 T_{\rm{m}}^{{\rm{U/Mo}}}\delta }}$
. C is the weight average heat capacity, and K is the weight average thermal conductivity of the alloy, and
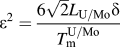 ${\varepsilon ^2} = {{6\sqrt 2 {L_{{\rm{U/Mo}}}}\delta } \over {T_{\rm{m}}^{{\rm{U/Mo}}}}}$
. Diffusivities (D
s, D
L) and regular solution parameters (Ωs, ΩL) of the solid and liquid phase are combined with the interpolating function p(φ) to form D
eff and Ω(φ), respectively,
 $${D_{{\rm{eff}}}} = {D_{\rm{s}}}\left( {1 - p\left( \varphi \right)} \right) + {D_{\rm{L}}}p\left( \varphi \right)\quad ,$$
 $$\Omega \left( \varphi \right) = {\Omega _{\rm{s}}}\left( {1 - p\left( \varphi \right)} \right) + {\Omega _{\rm{L}}}p\left( \varphi \right)\quad .$$
The interface thickness (δ) for γ-(U) dendrite was assumed to be 1.1 × 10⁻⁸ m and for BCC-(Mo) dendrite it was 1.0 × 10⁻⁹ m.
The microscopic solvability theory has established that the magnitude of crystalline anisotropy affects the dendritic crystal growth morphology, tip radius, and tip velocity. Reference Hoyt, Asta and Karma27,Reference Hoyt, Asta and Karma28 In this model, the anisotropic linear kinetic coefficient for interface attachment (β), surface energy, and interface thickness (δ) has been considered. β takes care of the attachment process at the solid–liquid interface. It generates anisotropic mobility and relates with the moving front (planer or dendritic tip) velocity (V n) with the undercooling (ΔT) through the following relations:
 $${V_{\rm{n}}} = \beta \left( \theta \right)\Delta T\quad ,$$
 $$\beta \left( \theta \right) = {\beta _0}\left( \theta \right)\left( {1 - {\varepsilon _{\rm{k}}}\cos 4\theta } \right)\quad ,$$
where, β0(θ) is the modulus of attachment coefficient, εk is the amplitude of kinetic attachment coefficient anisotropy, and θ is
 $\arctan \left( {{{{{\partial \varphi } \over {\partial y}}} \over {{{\partial \varphi } \over {\partial x}}}}} \right)$
. The anisotropic surface energy (σ) is calculated from surface energy of the pure metals (σ0) using
 $$\sigma = {\sigma _{\rm{o}}}\left( {1 + \gamma \cos 4\theta } \right)\quad ,$$
where, γ is the strength of anisotropy. The γ has been taken equal to 0.05 in both the simulations. Coriell and Turnbull
Reference Coriell and Turnbull29
have proposed the reduced crystal-melt interfacial tension through the equation,
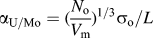 ${\alpha _{{\rm{U/Mo}}}} = {\hbox( {{{{N_{\rm{o}}}} \over {{V_{\rm{m}}}}}} \hbox)^{{\rm{1/3}}}}{\sigma _{\rm{o}}}{\rm{/}}L$
, where V
m is the molar volumes of pure U and Mo, N
o is the Avogadro’s number, σ0 is the surface free energy of pure elements, and L is the latent heat of fusion. We have taken α = 0.427
Reference Vinet, Magnusson, Fredriksson and Desre30
for molybdenum. The value for U, which has bcc (A2) structure, is assumed to be equal. This value of α has been used for calculating the surface energy (σo) of U and Mo. It has been shown by Hoyt et al.
Reference Hoyt, Asta and Karma27,Reference Hoyt, Asta and Karma28
that the kinetic parameter of anisotropy is almost one order of magnitude larger than the surface energy anisotropy and interface thickness anisotropy factor.
The evolution equations [Eqs. (11)–(13)] are solved by finite element method using implicit time stepping and an adaptive unstructured grid. Reference Loginova and Singer26 A small nucleus of the solid phase has been taken as the equilibrated nucleus. The marginal stability analysis postulates that selective instabilities, created from stochastic noise at under-cooled solid liquid interface, grow into a dendrite structure. However, recent theories postulate that the periodic oscillations at the interface are the results of an interaction between the shape and interfacial energy anisotropy. Reference Glicksman, Lowengrub and Li31 A recent study Reference Glicksman32,Reference Mullis33 indicates that even in the absence of any type of noise (mesh induce or additional thermal noise), side branching appears at a high undercooling, supporting the deterministic model proposed by Glicksman. In this simulation, for generation of the secondary branch, the stochastic noise dendrite has been introduced implicitly using the random number generator. The size of the domain is 350 × 150 (in nondimensional space), which ensures free dendritic growth. The tip temperature of the dendrites and tip position have been calculated considering, φ = 0.5. For both the cases a nonequilibrium cooling condition was created by assuming a fixed temperature at the boundary. The input parameters for U and Mo are listed in Table I.
IV. RESULTS AND DISCUSSION
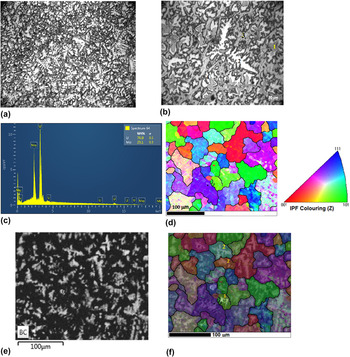
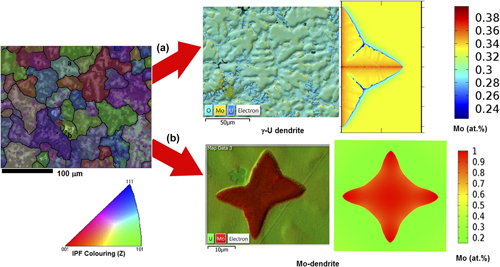
Experimental observations of the U–33 at.% alloy show as-cast dendritic microstructures, which were generated under nonequilibrium conditions. The optical image of the microstructure of the U–33 at.% Mo alloys in the as-cast condition shows two types of dendritic morphologies [Figs. 2(a) and 2(b)]. Few dendrites had an equiaxed morphology, which were identified as (Mo)-dendrites [marked as no. 1 in Fig. 2(b)]. The EDS analysis indicates 83–95 at.% Mo within these dendrites. The surrounding region [no. 4 in Fig. 2(b)] of these Mo dendrites has an Mo content around 42 at.% [Fig. 2(c)], and as one move further, the Mo concentration reduces to 37 at.%. This envelope region is formed due to a peritectic reaction between the liquid phase and ‘Mo’ on the surface of the Mo-dendrites (Liquid (29 at.% Mo) + BCC Mo → γU (42 at.% Mo)). A sluggish diffusion rate in the solid peritectic γ-U phase (42 at.% Mo) on the surface of the ‘Mo’ dendrites thwarts the completion of the peritectic reaction, and a significant amount of Mo dendrites retain in the microstructure. This is the typical feature of the peritectic reaction, where the reaction product itself forms as an envelope and acts as a barrier for the reaction to complete. As per the lever rule, just above the peritectic temperature (1284 °C), the phase fraction of the (Mo)-dendrite does not exceed 7% (wt%) for the U–33 at.% alloy. In the as-cast microstructures of U–33 at.% Mo, area fraction of (Mo)dendrites is measured, and it is ∼5% (wt%). After a peritectic reaction, further nonequilibrium cooling results in precipitation of γ-U dendrites [no. 2 in Fig. 2(b)] having a composition 34–40 at.% Mo. The majority of these dendrites has an elongated morphology, along with secondary branching. XRD analysis of the as-cast alloy confirms the presence of the γ-(U) phase. Reference Chakraborty, Choudhuri, Banerjee, Agarwal, Khan and Kumar3 After evolution of the ‘Mo’ and γ-U phase containing higher ‘Mo’ than 33 at.% Mo, the remaining liquid phase was depleted with the ‘Mo’ content. Hence, further cooling of the depleted liquid results in formation of residual γ-U [no. 3 in Fig. 2(b)], having 24–27 at.% Mo. Reference Chakraborty, Choudhuri, Banerjee, Agarwal, Khan and Kumar3
(a) The cast microstructure of U–33 at.% Mo alloy at low magnification showing dendritic morphology, (b) the cast microstructure of the U–33 at.% Mo alloy at a higher magnification showing two different dendritic morphologies. (c) The EDS profile of the enveloping region marked by 4 in (b), (d) the inverse pole figure map (IPF-Z) of the as-cast U–33 at.% Mo. (The color code represents orientation of grains along the z direction), (e) the band contrast map of as-cast U–33 at.% Mo showing the dendritic pattern, and (f) the IPF-Z map superimposed with the band contrast and EDS count of as-cast U–33 at.% Mo showing the dendritic pattern along with microsegregation. The Mo-dendrite is the brightest (indicated by no. 1), other dendrites are γ-(U) dendrites (indicated by no. 2).

For a detailed analysis of the as-cast microstructure, the EBSD analysis was carried out. The EBSD inverse pole figure normal to the sample surface (IPF-Z) in the cubic stereographic projection of the as-cast U–33 at.% Mo sample shows crystallographic orientations of different grains [Fig. 2(d)]. The presence of different orientations [Fig. 2(d)] indicates the absence of any preferred orientation. The band contrast image shows the dendritic morphology [Fig. 2(e)]. When the IPF-Z map of the microstructure is superimposed with the band contrast, the superimposed map shows the dendritic microsegregation pattern inside the grains along with orientations. Both types of dendrites [γ-(U) and (Mo)] are clearly revealed in bright contrast, when the EDS count of Mo (Lα line) is superimposed on IPF-Z with the band contrast [Fig. 2(f)]. The Mo-dendrite is the brightest [Fig. 2(f), no. 1], other dendrites are the γ-(U) dendrites [Fig. 2(f), no. 2]. As the phase fraction of γ-(U) is high for 33 at.% U alloys, therefore, the γ-(U) dendrites are observed in most of the grains. The γ-(U) dendrite shows a brighter contrast at the center of the grain, where the Mo concentration is around 39–41 at.%, and the darker contrast at the peripheral region of the grain has a lower concentration of Mo (24–27 at.%). Similarly, the Mo (brightest contrast) (83–95 at.%) dendrite is surrounded by a peritectic reaction product having a lower Mo concentration (42 at.%) (darker contrast) which was revealed in the superimposed IPF-Z band contrast image and the EDS Mo count. In the present article, both (Mo) and γ-(U) dendrites were simulated through the phase field simulation method for understanding the growth mechanism and microsegregation within the grains.
A. (Mo)-dendrite microstructure characterization and PFM simulation
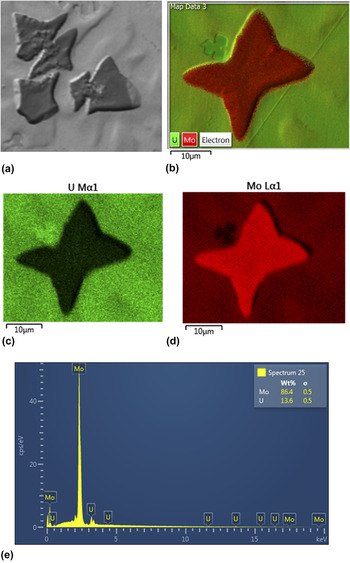
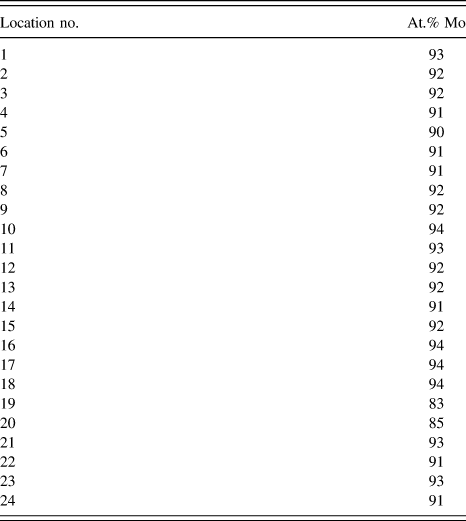
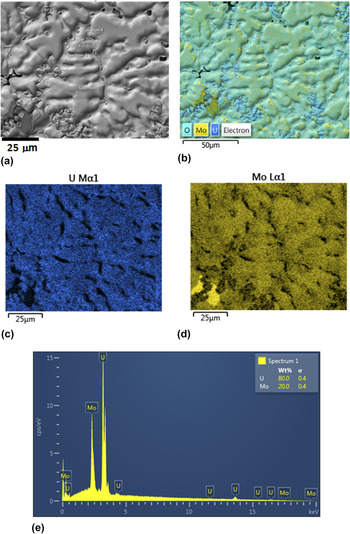
The high-magnification SEM back scattered image of the equiaxed (Mo)-dendrites is given in Fig. 3(a). As per the phase diagram of U–Mo, these dendrites are the first solid phases formed during cooling from the liquid melt. These (Mo)-dendrites have fourfold symmetry, and the size of each dendritic arm is ∼5–10 μm, with no secondary branches. An elemental X-ray map superimposed on the back scattered electron (BSE) image shows the presence of Mo and U [Figs. 3(b)–3(d)], which indicates a higher concentration of molybdenum in the (Mo)-dendrites compared to the melt (33 at.% Mo). The EDS analysis [Fig. 3(e)] shows that the Mo concentration in the (Mo)-dendrites is 83–95 at.% (Table II).
(a) SEM image of the (Mo)-dendrite, (b) The EDS-layered image having the BSE image along with an elemental X-ray map of U and Mo, (c) & (d) the elemental X-ray mapping image of U and Mo, respectively, (e) representative EDS profile taken on the (Mo)-dendrite.

EDS analysis of (Mo)-dendrite.

To understand this evolution of Mo micro-segregation pattern in the (Mo)-dendrite PFM simulation were done in a simulation box of 350 × 150. The growth of dendritic structure has been simulated from an equilibrated Mo-rich nucleus drawn at the left side of the simulation box in axis-symmetric model. The rest of the simulation box is filled with U–33 at.% Mo melt. The equilibrated (Mo)-nucleus grows under the driving force of concentration and thermal gradient. The simulation was carried out with two different assumptions on the diffusivity of uranium and molybdenum in liquid and solid phases: (i) case 1: diffusivities of Mo and U in the solid phase (10−9 m2/s) and in the liquid phase (10−8 m2/s) were assumed to be comparable and (ii) case 2: diffusivities of Mo and U in the solid phase were 2.3 × 10⁻¹⁷ m2/s and 3.7 × 10⁻¹³ m2/s, respectively, and in thte liquid phase both were 10−8 m2/s.
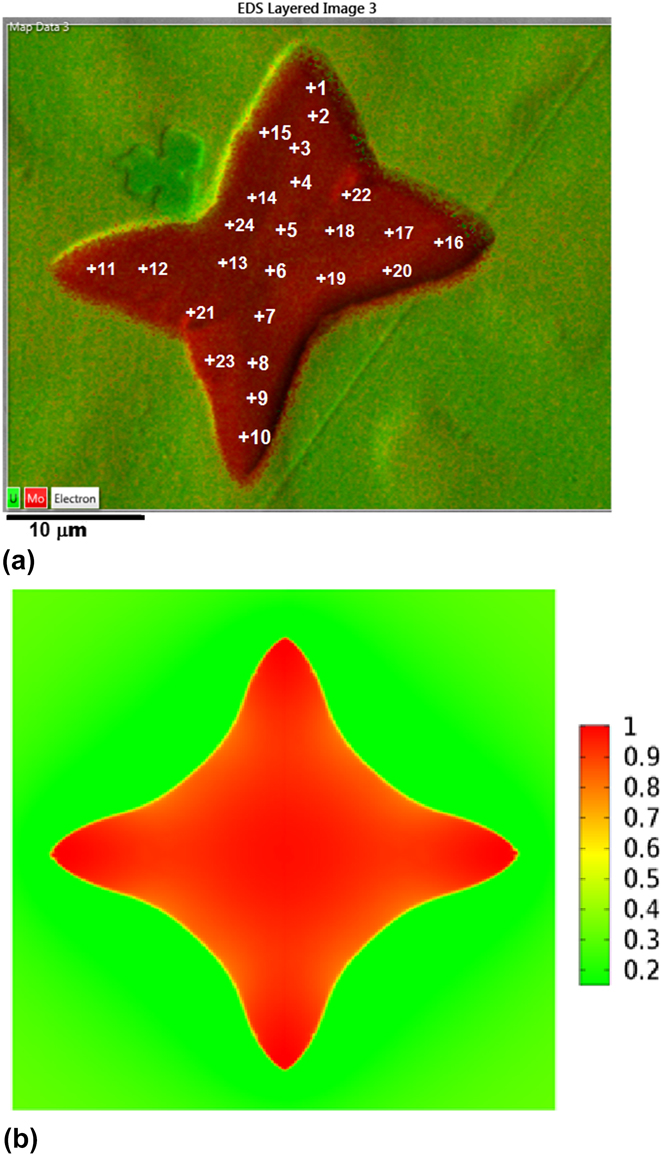
The experimental superimposed elemental image of the (Mo)-dendrite obtained in SEM is shown in Fig. 4(a). Detailed EDS analysis of the (Mo)-dendrite shows that the Mo concentration at the midrib of the dendrite is in the range of 90–94 at.%, and in the periphery, it is in the range of 83–87 at.%. The simulated microstructure of the (Mo)-dendrite with the comparable diffusivity of U/Mo in solid
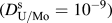 $\hbox( {D_{{\rm{U/Mo}}}^{\rm{s}} = {{10}^{ - 9}}} \hbox)$
and liquid
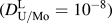 $\hbox( {D_{{\rm{U/Mo}}}^{\rm{L}} = {{10}^{ - 8}}} \hbox)$
is shown in Fig. 4(b) (case 1). The concentration at the midrib is in the range of 90–98 at.%, and at the periphery, it is in the range of 81–85 at.%. For case-2, the midrib of the simulated microstructure of the (Mo)-dendrite with a significant difference in solid and liquid diffusivity (
 $D_{\rm{U}}^{\rm{s}} = 3.7 \times {10^{ - 13}}$
,
 $D_{{\rm{Mo}}}^{\rm{s}} = 2.3 \times {10^{ - 17}}$
,
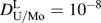 $D_{{\rm{U/Mo}}}^{\rm{L}} = {10^{ - 8}}$
), has the concentration of ∼94 at.% Mo, and the Mo concentration at some of the peripheral regions was as low as ∼70 at.% Mo. It was found that the calculated concentration of Mo in the midrib region, based on assumptions of case-1 and case-2, matches the experimental observation. However, concentration at the periphery is in close agreement with the calculations carried out with the assumptions of case-1. The calculated concentration of Mo in the peripheral region is much lower for case-2 than that of the experimental value. The reason may be that a much lower diffusivity of U and Mo was assumed in the solid phase than in the liquid phase, which leads to a higher microsegregation of Mo observed in case-2. This wider composition variation may be more relevant for cases where the diffusivity values of uranium (
 $D_{{\rm{Mo}}}^{\rm{U}}$
= 3.7 × 10⁻¹³ m2/s, five order less than liquid phase) and molybdenum (
 $D_{{\rm{Mo}}}^{{\rm{Mo}}}$
= 2.3 × 10⁻¹⁷ m2/s, nine order less than liquid phase) are low. These experimental diffusivity values were determined by the diffusion annealing method, in isothermal conditions, at high temperatures (Table I). In these experiments, the single solid phase diffusivity has been measured. However, during solidification, the presence of the mushy zone which has a two phase microstructure gives more diffusion paths to the components than those of the single phase.
(a) Elemental X-ray map superimposed with SEM BSE image of the (Mo)-dendrite with at.% Mo concentrations measured by EDS (Mo concentrations at different locations are given in Table II) and (b) the concentration map (mole fraction of Mo) of the simulated Mo dendrite assuming D U/Mo = 10−9 and D L = 10−8 m2/s (100 nondimensional time step) at undercooling 20 K.

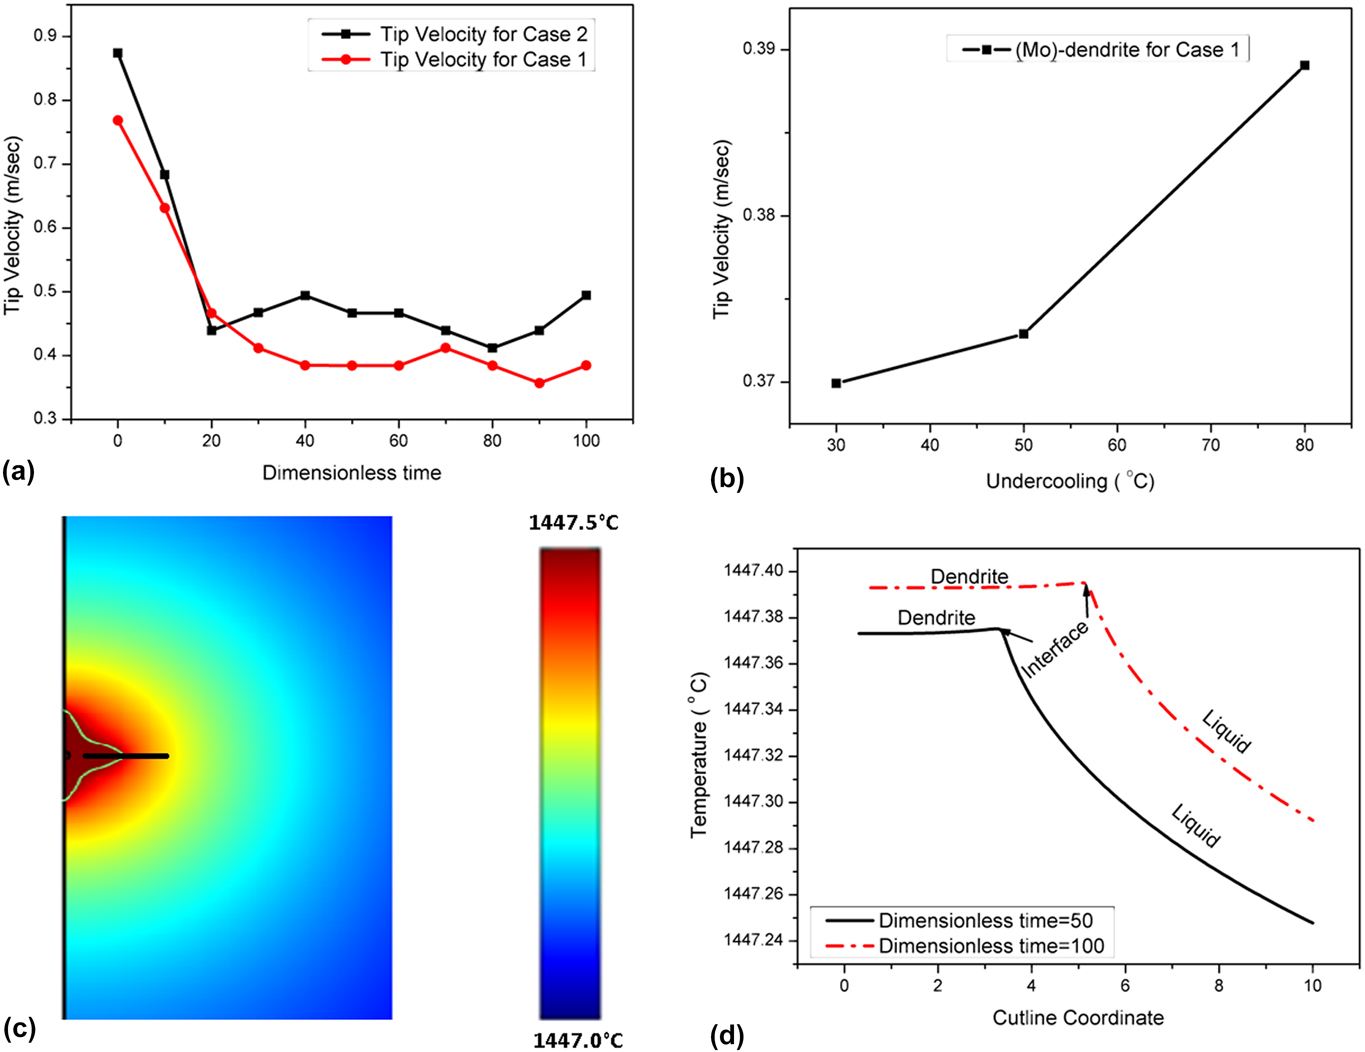
In case of the (Mo)-dendrites, variation of the tip velocity with dimensionless time has been plotted in Fig. 5(a). The plot shows that for the initial period, the tip velocity is higher. Then, it starts decreasing quickly, and afterward, it drop offs very slowly. The calculated tip velocity is ∼0.37–0.5 m/s, which is slow enough to maintain local equilibrium at the interface. The evolution of the (Mo)-dendrite has been simulated at different undercoolings, in the range of 5–60 °C. The change in the tip velocity with undercooling has been plotted in Fig. 5(b). It has been found that the tip velocity increases with undercooling. According to the transition-state-theory, in case of low undercooling (<100 °C), the tip velocity (V n) of the dendrite is proportional to the undercooling (ΔT) and the kinetic attachment coefficient (β). Therefore, the tip velocity should increase with increase in undercooling as observed from our simulation. Whereas, the tip temperature is the interplay between the released latent heat during solidification and heat diffusion in the cooler melt. The temperature profile through the cutline of a dendrite [Fig. 5(c)] has been plotted at different times of the crystal growth [Fig. 5(d)]. The cutline is aligned with the midrib of the solid dendrite. It starts from the solid dendrite to some distance into the melt [Fig. 5(c)]. Throughout the simulation, the temperature is kept fixed at the outer boundary (melt). Due to the release of latent heat at the interface during crystal growth, the liquid just ahead of the solid liquid interface is at a higher temperature compared to the bulk molten metal. As a result, a negative temperature gradient is created from the liquid just ahead of the solid–liquid interface to the bulk molten metal. The dendritic tip moves toward the cooler melt, which provides adequate driving force for dendritic growth. The plot [Fig. 5(d)] shows that with time, the melt temperature across the cut line is increasing. This increase in temperature is also very insignificant during solidification. In the present calculations, the melt boundary is assumed to be far away from this solid–liquid interface region, thus its temperature is not affected by heat diffusion.
(a) Tip-velocity of (Mo)-dendrite at different nondimensional time, (b) plot of the tip velocity versus undercooling for the (Mo)-dendrite showing a higher tip velocity at higher undercooling, (c) the cutline drawn through the temperature field of the Mo dendrite (the scale bar depicts the temperature in (°C), and (d) plot of the temperature profile through the cut line of a (Mo)-dendrite at different nondimensional times of crystal growth.

B. γ-(U)-dendrite microstructure characterization and PFM simulation
The majority of dendrites seen in Figs. 2(a) and 2(b) are γ-(U)-dendrites, which are formed below the peritectic temperature and have secondary branches. As the alloy was made from 33 at.% Mo melt, therefore, the uranium-rich melt is expected to have more crystals of the γ-(U) phase. With decrease in the cooling rate, the fraction of this phase is expected to increase. For the as-cast alloys, it is approximately 95% of the bulk. The SEM image and elemental X-ray maps with the superimposed BSE image are given in Figs. 6(a)–6(d), respectively. The EDS analysis [Fig. 6(e)] shows that in γ-(U)-dendrites, the Mo concentration at the midrib of the dendrite is in the range of 39–41 at.%. The matrix surrounding the dendrites has the Mo concentration in the range of 24–27 at.%. Some fine precipitates of the uranium-rich phase are also seen in Fig. 6(b), corresponding to the formation of a small amount of uranium oxides.
(a) SEM image of the γ-dendrite, (b) the elemental X-ray image super imposed with the BSE image of the γ-dendrite, (c) the elemental X-ray map of U shows high U enrichment in the surrounding matrix, (d) the elemental X-ray map of Mo shows high Mo enrichment at the center of the dendritic arm in the γ-dendrite, and (e) the representative EDS profile taken on the γ-dendrite.

The simulation was also carried out to study the evolution of γ-(U)-dendrites at different undercoolings, in the range of 5–60 °C. As the melt and the solid metal are especially good conductors of heat, the variation of temperature will be very small with time and space. The simulation of the γ-(U)-dendrite was carried out with 4 × 10⁻¹³ m2/s and 2 × 10⁻¹¹ m2/s diffusivity of Mo and U in the solid phase, respectively, and 10−9 m2/s diffusivity of U as well as Mo in the liquid phase.
The parametric study was also carried out by assuming equal diffusivity of U/Mo [
 $D_{\rm{U}}^{\rm{L}}$
= 10−9 m2/s,
 $D_{{\rm{Mo}}}^{\rm{L}}$
= 10−9 m2/s,
 $D_{\rm{U}}^{\rm{U}}$
= 10−9 m2/s,
 $D_{{\rm{Mo}}}^{\rm{U}}$
= 10−9 m2/s] in solid and liquid phases, similar to the assumption made for (Mo) dendrites discussed in the previous section. However, the computed concentration profile in the dendrite was found to be very different from the experimental observation. The reason for the validity of lesser diffusion rates in the case of simulation of the γ-(U)-dendrites may be that this phase precipitates at a lower temperature than (Mo). With decrease in temperature of the melt, the rate of cooling decreases and hence the system moves toward equilibrium. Further, the growth of secondary branches reduces the tip velocity of the γ-(U)-dendrites considerably than that of the (Mo)-dendrite.
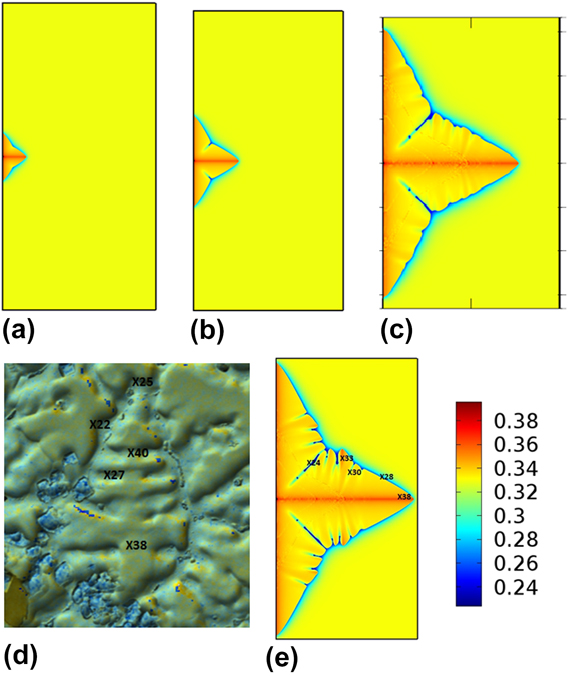
The concentration profile in the simulated γ-(U) dendrite with unequal diffusivities in solid and liquid phases was given in Figs. 7(a)–7(e) at different time intervals and was found to agree with experimental values [Fig. 7(d)]. The 2 to 4 order difference in diffusivity of U and Mo in the solid phase and liquid phases generates the microsegregation pattern. The simulation shows that the γ-(U) dendrite starts growing from the equilibrated nucleus in spherical shape and then under the influence of kinetic and interfacial anisotropy (interfacial energy and thickness), the spherical shape splits into different branches, maintaining a 4-fold symmetric condition. The concentration profile shows that the first solid has a higher Mo concentration, thus the melt gets depleted of Mo. This is expected because according to the phase diagram of the U–Mo system, the solid phase is richer in Mo than the liquid phase for all temperatures, thus the partition coefficient is,
 ${{C_{\rm{S}}^{{\rm{Mo}}}} \over {C_{\rm{L}}^{{\rm{Mo}}}}} > 1$
. During simulation, it was found that after sufficient growth of primary branches, the surface of the dendrite started showing undulation. This, at a later time grew into secondary branches. In Fig. 7(e), the simulated image is compared with elemental X-ray mapped with the overlapped BSE image [Fig. 7(d)]. The γ-(U) dendrite observed in the SEM image has both primary and secondary branches. The EDS analysis shows microsegregation in both primary and secondary branches. A comparison of the SEM micrograph—EDS analysis with the simulated dendrite shows that the structure and concentration profile of experimental results are matching closely with the simulated dendrite. Fig. 7(d) shows that the Mo concentration at the midrib of the primary branches is 40 at.% and at the periphery 27 at.%, in the SEM-EDS image. Fig. 7(e) shows that the simulated dendrite has Mo concentration at the midrib 36–38 at.% and at periphery ∼24 at.%. Another important feature of the dendritic structure is the entrapped liquid metal between advancing dendritic arms, which solidifies later. The entrapped liquid metal solidified with the depleted Mo content. These entrapped liquid regions were also observed in the simulated dendritic structure.
(a)–(c) Evolution of the concentration field of U–Mo γ-(U) dendrites from the prenucleated γ-(U) nucleus under nonisothermal conditions at 100, 200, and 400 nondimensional time step, respectively. The simulation box size was 400 × 200 in the nondimensional space, (d) the concentration of Mo (at.%) measured in EDS at the respective position of γ-dendrites are given, and (e) evolution of the U–Mo γ phase dendrites from the prenucleated gamma nucleus at 500 nondimensional time steps under a nonisothermal condition.
According to the theory of morphological stability, Reference Mullins and Sekerka34 below the critical velocity of marginal stability, the perturbation may grow into a dendrite. This theory assumes local equilibrium at the interface, which is very similar to our assumption. In Fig. 8(a), the tip velocity of the growing dendritic crystal has been plotted with nondimensional time. A higher tip velocity has been found for the initial period. Then, it drops off rapidly and then plateaus out. This trend is similar to the observation made in the case of (Mo)-dendrites, the calculated tip velocity of γ-(U)—dendrites is ∼0.01–0.04 m/s, which is much lower than the tip velocity calculated for the (Mo)-dendrites. In Fig. 8(b), the tip velocity has been plotted with undercooling, which shows that the tip velocity increases with increase in the undercooling.
(a) Tip velocity of (γ-U)-dendrite at different nondimensional times for undercooling at 38 (°C), (b) plot of tip velocity versus under-cooling for (γ-U)-dendrite showing higher tip velocity at higher undercooling, and (c) plot of the temperature profile through the cut line of a γ-(U) dendrite at different nondimensional times of crystal growth (tip of the curves represent the solid–liquid interface at different times).
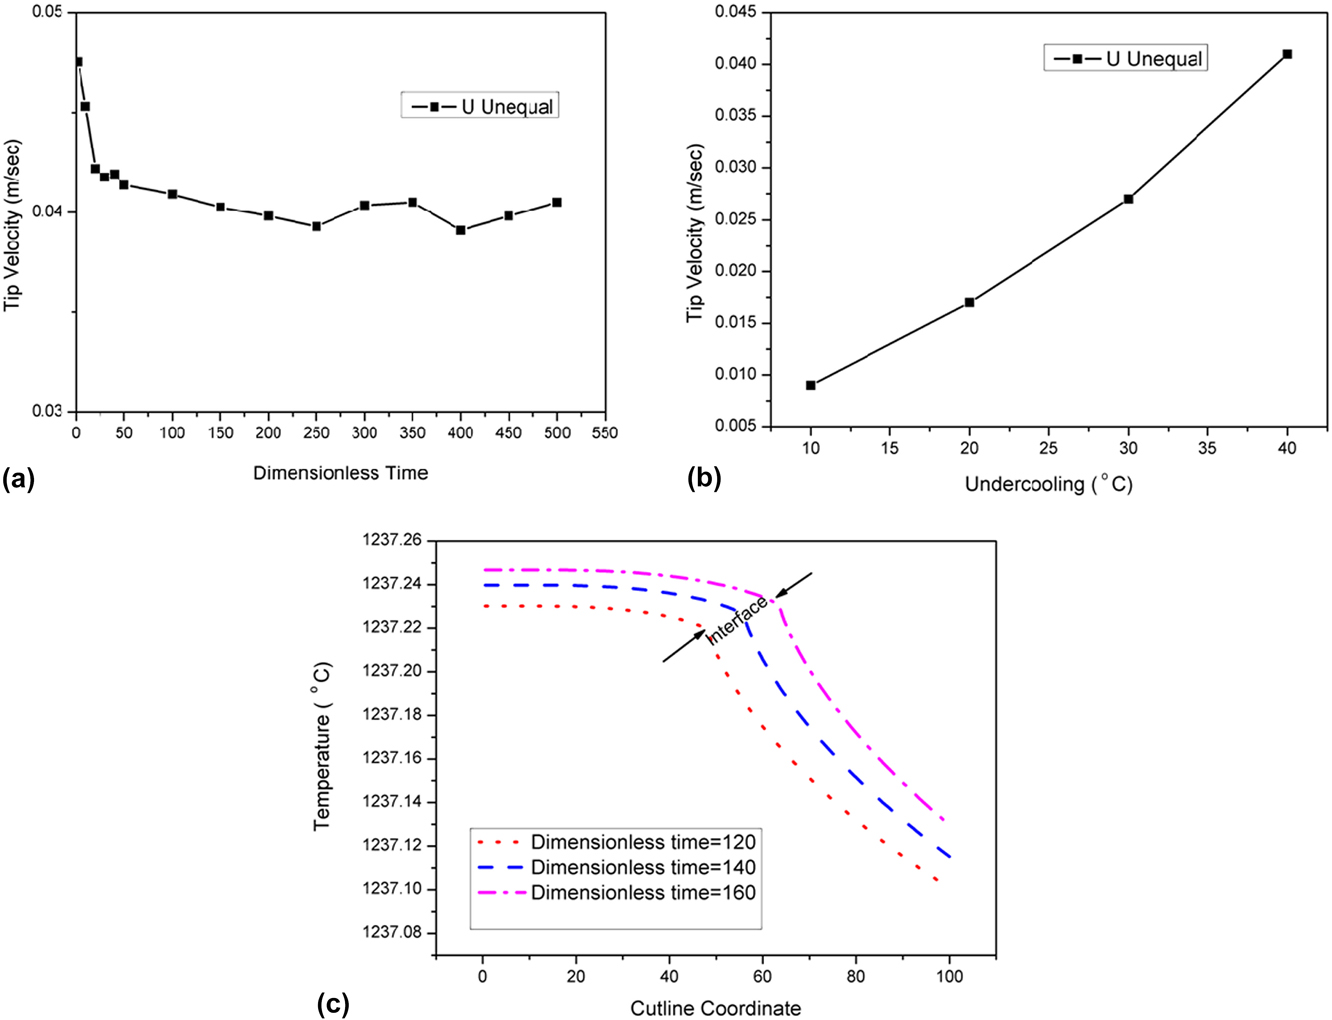
The temperature distribution across the midrib of the dendrite has been plotted in Fig. 8(c). The temperature variation at the tip throughout the dendritic crystal growth simulation is very small (∼0.25 °C). In a particular time instance, the tip temperature is higher than the molten metal due to the release of latent heat, and a negative temperature gradient is formed in the liquid. Two types of temperature distributions have been seen during simulation. Initially, during growth of primary branching, the tip temperature increases monotonically (up to ∼300 dimensionless time step). However, subsequently, secondary branch growth and heat release change the temperature field in and around the tip region. This causes nonmonotonic tip temperature distribution with time.
The main morphological difference between the two types of dendrites is secondary branching. The cast structure formed during arc-melting has a typically average cooling rate of the order of ∼100 °C/s. The undercooling is a major parameter for dendritic growth. The solidification undercooling consists of four different types of undercoolings. These are (i) kinetic undercooling, (ii) curvature undercooling, (iii) thermal undercooling, and (iv) constitutional undercooling. In our model, both types of dendrites are simulated in the similar range of undercooling. In the U–33 at.% Mo alloy system, the transformation temperature of the Mo-dendrite is higher than that of the γ-dendrite. At a higher transformation temperature (in case of Mo dendrite), due to high solute diffusivity in liquid phase, solute atoms get redistributed (causing more uniform distribution of Mo) faster than the γ-dendrite. This leads to a higher local constitutional undercooling for the γ-dendrite than the Mo dendrite. So, only the primary stalk with no secondary branch develops in the Mo dendrite. Whereas, the γ-U dendrite, transforms at a lower transformation temperature, develops into a dendritic structure with secondary branches.
V. SUMMARY AND CONCLUSIONS
The U–Mo metallic fuel is the candidate material for both fast reactors and research reactors. It has thermophysical properties like higher thermal conductivity and higher melting point that makes it a better fuel candidate than U–Zr fuel. During reactor operation, the U–Mo fuel will be in the γ-(U) phase field. This γ-phase has a BCC crystal structure which ensures improved fuel performance during reactor operation. U–33 at.% Mo is an alloy which has a higher melting point (solidus) compared to U–22 at.% Mo and is a candidate alloy for fast reactors. Microstructure characterization of this fuel in the as-cast condition has been carried out. The microstructure of the as-cast U–33 at.% Mo consists of two types of dendrites: the equiaxed Mo-rich B.C.C dendrite and the γ-(U) dendrite with a secondary branch. EBSD analysis indicates that these dendrites have no preferential orientations. SEM-EDS analysis shows considerable degree of microsegregation in both types of dendrites. The evolution of morphology and microsegregation of the γ-(U) and (Mo) dendrite grown from the melt of U–33 at.% Mo has been simulated with the WBM model based on the phase field concept. An adaptive unstructured mesh has been used for the simulation. The important findings of the phase field modeling are listed below:
-
(1) The detailed SEM-EDS analysis of the equiaxed (Mo) dendrite shows a midrib concentration of 90–94 at.%, and at the periphery, it is 83–87 at.%. The PFM simulation of the (Mo)-dendrite shows a similar concentration distribution assuming nearly equal U and Mo diffusivity in the solid and liquid phase. The diffusivity in the liquid phase is one order higher than solid diffusivity. The tip velocity of the (Mo) dendrite has been calculated for the range of undercooling. The tip velocity is found to be in the range of 0.3–0.4 m/s, and it increases with increasing undercooling. The tip temperature of the dendrite rises during the evolution process.
-
(2) The microsegregation of the γ-(U) dendrite has also been simulated at different undercoolings. The simulated concentration profile matched very closely with the experimental value. The simulation shows increasing tip velocity with increasing undercooling. The tip temperature increases monotonically during the growth of primary dendrites. After generation of the secondary branch, the tip temperature vary nonmonotonically with time.