


Introduction
The cryosphere, portions of the Earth’s surface where water is in solid form, showed a widespread shrinkage in the 20th century, the warmest century for the past 2000 years (Reference HoughtonHoughton and others, 2001). The cryosphere is considered as one of the sensitive indicators of climate change, and in China, as one of the largest cryospheric areas on Earth, the cryosphere has been undergoing rapid changes in recent decades. Reviewing these changes will help provide a better understanding of the present and future state of the global cryosphere.
The cryosphere in China is mainly located in the Qinghai–Xizang (Tibetan) Plateau (hereafter QXP), the eastern Tien Shan, the Altai Shan, the east Pamirs and northeast China. The total number of glaciers in China is 46 298, with a total area of 59 406 km2 and an ice volume of 5590 km3. The permafrost and the seasonally frozen ground (SFG) cover an area of 1.49×10⁶ and 5.28×10⁶km2, accounting for 11.5% and 55% of Chinese land territory, respectively. The snow-covered area in China is around 9.0×10⁶ km2, and of this an area over 4.8×10⁶ km2 consists of unstable snow cover (duration <20 days). Stable snow cover (duration >60 days) is mainly located in the QXP, north Xinjiang (including the Tien Shan) and the Inner Mongolia–northeast China (hereafter IM-NEC) regions. The mean snow-cover areas of these three regions are 2.3×10⁶, 0.5×10⁶ and 1.4×10⁶ km2, respectively. Seasonal sea ice forms in the Bohai Sea and in the northern Yellow Sea of China. Sea ice forms in mid- to late November, reaches its maximum area in late January to early February and melts away in late March. River ice forms in most rivers in north China, including the Yellow, Songhuajiang, Nengjiang and Liaohe rivers.
There are few reliable observations available for the cryosphere before 1949, when the People’s Republic of China was established, but since then glaciers and frozen ground over the QXP and Tien Shan have been widely investigated. Since 1951, snow cover has been measured at meteorological station networks governed by the China Meteorological Administration. Sea- and river-ice observations were also started in the 1950s. These observations give an insight into regional climate change over the past half-century. However, most of the data were published in Chinese, and thus unknown to international communities. Presently, the Chinese National Committee of the World Climate Research Program (WCRP)/Climate and Cryo-sphere Project (CliC) (CliC-CNC) is working on synthesizing cryospheric data. Here, we review these results, based mostly on direct observations and partly on remote-sensing methods, which can certainly contribute to an overall assessment of the present and future state of the global cryosphere.
Data and Sources
Data on snow cover
The study area extends over the latitude–longitude domain from approximately 70˚ E to 105˚ E and from 27˚N to 50˚ N. Western China is physiographically divided into two regions: the QXP and northwestern China. The QXP, with an average elevation exceeding 4500 m and an area of >2×10⁶ km2, has been acclaimed as the ‘Roof of the World’. The Himalaya, the world’s highest mountain range, provides a natural screen on the southern frontier of the plateau. Northwestern China is an arid region surrounded by high mountains and large basins, such as the Altai Shan, Tien Shan, Pamirs, Karakoram, the Kunlun Shan and the Tarim and Junggar basins.
The meteorological network of western China consists of more than 200 synoptic stations. It was only after 1956 that the QXP network became dense enough to ensure adequate spatial coverage, except for western Tibet. To minimize the defects of station data, a subset of the network was created in northwestern China and the QXP, respectively. The station selection criteria included availability of the longest time series; few missing records; and without site relocation. The station records were used without further adjustment, and no attempt was made to fill in the few missing data (Reference Balling and IdsoBalling and Idso, 2002). Following strict quality control, the station point records were integrated over the snow-cover years (September to August) and space to derive regional time series. With regard to large-scale area averages, biases and errors associated with specific point data were further minimized to such an extent that a homogeneous and meaningful signal could be extracted. Over the QXP, the station network consisted of 60 primary stations, of which 35 are located in Qinghai Province and 25 in the Xizang (Tibet) Autonomous Region. Snow-cover data from 46 stations in Xinjiang and 64 stations in IM-NEC are used to study the long-term trend.
Data on glaciers
Records of directly measured mass balance are obtained at a few logistically ‘easy’ glaciers: Ürümqi glacier No. 1 (UG1), Tien Shan; Xiao Dongkemadi (XDKMD), Tanggula Shan; Meikuang (MK), east Kunlun Shan; July 1st (Qiyi) glacier, Qilian Shan; and Hailuogou glacier, Gongga Shan. The mass-balance data series differ in length, and are discontinuous except for UG1.
Glacier changes are defined as changes of ice mass and glacier size, including thickness, length and width. Ground monitoring of glacier changes in China for recent decades has been carried out at several sites. Continuous observations are operated only on UG1, which is the only glacier in China that is included in the World Glacier Monitoring Service (WGMS; International Satellite Communication Systems–International Association of Hydrological Sciences) network. Other ground-based observations have been operated sporadically on glaciers covering all of the mountain ranges in western China (Table 1).
Ground–based observations of glacier length in China for the past decades

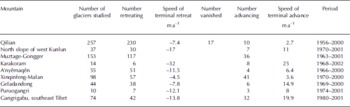
For the statistical estimations of glacial changes over specific regions, studies are based on the 1950–70 topographic map and on Landsat Thematic Mapper (TM)/Enhanced TM Plus (ETM+) and Terra ASTER (Advanced Spaceborne Thermal Emission and Reflection Radiometer) photos taken during 2000–02; glacier changes for the 764 glaciers in western China have been studied (Table 2). The geometrically corrected error of the photos in different areas is usually smaller than two units (30–60m for TM/ETM+, and 30 m for ASTER). The glaciers are not included in the statistics if the length changes are less than the errors.
Statistics of terminal changes of glaciers of western China based on 1950–70 topographic map and Landsat TM/ETM+ and Terra ASTER photos taken during 2000–02
Data on frozen ground
Ground surface temperature is a standardized monitoring parameter at most meteorological stations. It is measured on the ground surface with half of the thermometer buried in the soil and half exposed to the air. Mean cold-season temperatures and mean warm-season temperatures are the average value of monthly temperatures from October to March and from April to September, respectively. SFG depth is defined as the maximum frozen depth in each cold season.
There are 119 meteorological stations in the QTP, of which 7 are located within permafrost regions with elevations higher than 4500m and mean annual air temperatures lower than –2.8˚C. Three of the seven stations are free of permafrost (Maduo, Tuotuohe and Zhongxinzhan) due to the influences of high geothermal flux and/or rivers (Reference Zhou and GuoZhou and Guo, 1982; Reference Guo, Zhou, Guo, Qiu, Cheng and LiGuo, 2000; Reference Guo, Zhou, Qiu, Li, Zhou, Guo, Qiu, Cheng and LiGuo and others, 2000). Based on analysis of both mean daily and ground surface temperatures, there are no SFG thickness monitoring data at 29 of the stations (20 of these are located in the southwestern region of the QXP), either because of lack of SFG or because the ground in this area normally freezes for only a few nights during the winter. Freezing depths have been monitored at 86 stations. These stations are distributed around the fringes of the QXP, while most of the inland areas are underlain by permafrost (Reference Li, Cheng and ZhouLi and others, 1996). The data used in this study are available from 1967 to 1997 at 50 stations over the QXP after some minor adjustments and estimations for missing data. SFG data in Xinjiang and the Hexi Corridor of Gansu Province are also derived from routine meteorological stations. Among the stations selected for SFG studies are 10 in north Xinjiang, 9 in south Xinjiang and 17 in the Hexi Corridor.
Sea- and river-ice data
Observation stations surrounding the Bohai Sea were set up in the 1950s. The observing handbook of offshore sea ice was produced in 1959, and routine observations maintained since then. Since 1969, three ice-breaking vessels have been built for sea-ice observation, and ground-based radar detection for sea-ice monitoring was established in the 1970s. From 1973, air photos and satellite images of sea ice were used. Currently the sea-ice observations in the Bohai Sea and the northern Yellow Sea include (1) ground stations, (2) remote sensing, including air photos and satellite images, and (3) icebreaker observations.
River ice was observed at the national hydrological observation network governed by the Ministry of Water Resources of China (MWR). River-ice parameters such as the duration of river ice, freeze-up and break-up dates as well as ice thickness were monitored at these stations. Here we apply data from the Inner Mongolia section of the Yellow River, the Haarbin section of the Songhuajiang river and the Fulaerji section of the Nengjiang river to identify river-ice changes during the past several decades in China.
Observed Changes of Cryospheric Components
Changes in glaciers
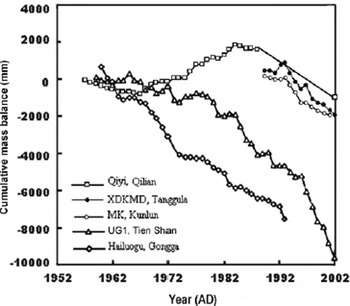
Mass-balance studies have been operated on several relatively easily accessible glaciers such as UG1, XDKMD, MK, Qiyi and Hailuogou (Fig. 1). Between 1959 and 2002 the cumulative mass loss of UG1 equals a lowering of the glacier surface of up to 10.6 m. This loss of mass has accelerated since 1995. For instance, the cumulative loss of mass between 1995/96 and 2001 accounts for 42% of the total loss since 1959. The mass balance at XDKMD has been negative since 1993, and has continued to display an accelerated loss of mass since then. Mass balance at MK displays a parallel trend to that of XDKMD. Mass balance at Qiyi from 1974/75 to 1977/78 was averaged to be 256 mm; from 1984/85 to 1987/88 it was 4 mm, while in 2001/02 and 2002/03 it was –861 and –360 mm, respectively. It is calculated that the rate of mass loss was 25.2 mma–1 between 1976 and 1986, and –35.4mma–1 between 1986 and 2002. Hailuogou glacier, located at the east margin of the Tibetan Plateau, has displayed a continuously negative mass balance since 1960.
Changes of mass balance of five glaciers in west China in recent decades.
For the past few decades, terminal changes of China’s glaciers have been directly measured at several sites considered to be logistically and morphologically ‘easy’. Terminal changes of UG1 have been observed since 1959 based on a long-term monitoring program. Changes of other glaciers were based on field investigations by various scientists in different years (Table 1; Fig. 2).
Changes of glacier terminus (length) based on ground investigations: glaciers that underwent small terminal retreats (a), large terminal retreats (b) and terminal advances (c). Note that the y-axis unit in (a) is 100 m, while in (b) and (c) it is 500 m.
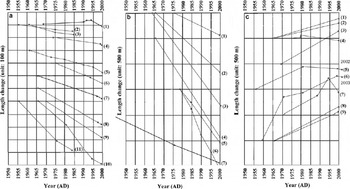
Sporadic field investigations in the past few decades show that changes of glacier lengths vary in different areas. The breadth of these changes varies because of different climatic conditions, glacier sizes and facings. Relatively small changes were found in the Qilian Shan and in the central QXP and in some large glaciers in the Himalaya. We define these changes of <500m between the 1950s and around 2000 as a small retreat (Fig. 2a).
Larger retreats are occurring on glaciers in the margins of the QXP, the Pamirs and in the western Tian Shan. Between the 1950s and 2000, these glaciers retreated >500m (Fig. 2b).
Although retreat is the overwhelming trend, some glaciers in the central and southeastern QXP are still advancing (Fig. 2c). This is probably due to the response of the glaciers to the present cooling of the local climate (Reference Shi, Liu, Shangguan, Li and YeShi and others, 2006), or due to enhanced transport of moisture to high altitudes (Reference HewittHewitt, 2005; Reference LiuLiu and others, 2006).
Glacier changes for 764 glaciers in western China were studied (Table 2) using digital photos from Landsat TM/ETM+ and Terra ASTER. The changes have varied remarkably in different regions. In total, about 80.8% of the studied glaciers are retreating or have vanished, while 19.2% are advancing (Fig. 3). For each region (mountain range), the number of advancing glaciers is much less than that of retreating glaciers. The percentage of advancing glaciers on the margin of the QXP (e.g. Qilian, A’nyêmaqên and Qomolangma) is higher than in the interior. Because of the resolution limits of the photos, changes of some small glaciers and some stable glaciers cannot be determined; this should be considered when assessing the overall changes of glaciers.
Percentages of retreating glaciers among a total of 764 glaciers in China during the past five decades.

Based on the above observations and the typical glacier monitoring, Reference Yao, Wang, Liu, Pu, Shen and LuYao and others (2004) estimated a shrinkage of 3790 km2 of glacier areas in approximately the past 40 years, which equals a mean glacier thinning rate of around 0.2 ma–1.
Changes in frozen ground
Permafrost
Since 1964, a 35 m deep hole for measuring soil temperature was measured at Fenghuoshan, central QXP. Ground temperatures at different depths were read in 1964, 1984, 1992 and 1996. Stable ground temperatures were observed between 1964 and 1984, but after the mid-1980s turned into a warming trend for the surface soil within 20m (Fig. 4) (Reference ZhangZhang, 2000). According to Reference Zhao, Cheng, Li and ZhengZhao and others (2003), permafrost temperatures over the hinterland of the QXP increased by about 0.2–0.5˚C between the 1970s and the 1990s. Permafrost temperatures were measured at four sites along the northern section of the Qinghai–Xizang highway: Chumaer river, Kekexili, Kunlun Pass and Fenghuoshan (Fig. 5). At these sites, ground temperature at 5 m depth was averaged to have increased up to 0.5˚C over the period 1995–2002 (Reference Wu and LiuWu and Liu, 2004; Reference Zhao, Ping, Daqing, Cheng, Ding and LiuZhao and others, 2004). Permafrost temperatures increased by about 0.2–0.4˚C from 1973 to 2002 at 16–20m depths in the Tien Shan region (Reference Qiu, Zhou, Guo, Zhou, Guo, Qiu, Cheng and LiQiu and others, 2000; Reference Zhao, Ping, Daqing, Cheng, Ding and LiuZhao and others, 2004). Permafrost surface temperatures increased by about 0.7–1.5˚C over the period 1978–91 from the valley bottom to the north-facing slopes in the Da Hinggan Ling in northeastern China (Reference Zhou, Wang, Gao and ChengZhou and others, 1996). Permafrost temperature at the depth of the zero annual temperature variation increased by about 2.1 ˚C on the valley bottom, 0.7˚C on the north-facing slopes and 0.8˚C on the south-facing slopes. The active layer increased by about 40 cm at Jiagedaqi over permafrost, from an average of 240 cm in the 1960s to an average of 280cm in the 1990s (Reference Liu, Hayakawa, Lu, Dong and YuanLiu and others, 2003). In the south-facing slope areas where no permafrost exists, soil temperatures at the lower limits of the SFG increased by about 2.4˚C (Reference Zhou, Wang, Gao and ChengZhou and others, 1996).
Ground-temperature changes in a hole at Fenghuoshan.

Ground temperature variation at 5m depth below natural surface along Qinghai–Xizang highway since 1995.

Seasonally frozen ground
We discuss SFG changes over three major regions: the QXP, northwest China (including Xinjiang and the Hexi Corridor of Gansu Province) and northeast China (Fig. 6).
Changes in maximum frozen depths of the seasonally frozen ground over the QXP, Hexi Corridor and Xinjiang.

Over the QXP, the SFG thickness decreased over a range 0.05–0.22m from 1967 through 1997 (Reference Zhao, Ping, Daqing, Cheng, Ding and LiuZhao and others, 2004). The driving force for the decrease was the significant warming in cold seasons, while changes in snow-cover depth played a minor role. The duration of SFG shortened by >20 days from 1967 through 1997, mainly due to the earlier onset of thaw in spring rather than the late onset of freeze in autumn.
The average and maximum SFG depths and the duration of the frost period at 10cm depth in Xinjiang during the period 1961–2002 are analyzed by Q. Reference Wang, Li, Wei and WangWang and others (2005). The results show that the average and maximum depths of the freezing front and the duration of the frost period are decreasing due to warmer climate in Xinjiang in recent decades. Such changes have become more significant since 1986, after an obvious shift of local climate towards a warmer, wetter regime. Significant decrease of the maximum depths reached by the freezing front occurred in the mid-1980s, both in south and north Xinjiang.
Data on the upper and lower limits of SFG, as well as on the duration of the frost period, collected from 17 meteorological stations in the Hexi Corridor in the period 1958–2003 show a rapid decrease in the depth reached by the freezing front in the mid-1980s. This coincides with an increase in winter temperature over the same period. The minimum air temperature in winter controls the maximum depth reached by the freezing front and the duration of the frost period (Reference GuoGuo and others, 2005).
In northeast China, there are few SFG studies, but since an obvious trend of increased air temperatures has been observed for the past 50 years, it is clear there has been a reduction of SFG. Observations show a rapid increase of winter air temperature in northeast China in the past five decades (Reference Sun, Ren, Zhao and YangSun and others, 2005), which is harmful to the preservation of SFG.
Changes in snow cover
Using scanning multichannel microwave radiometer (SMMR) data, covering 2500 cells of a 0.5˚×0.5˚ latitude–longitude grid between 1978 and 1987, Reference LiLi (1999) showed the spatial pattern of average snow depth (cm) during the winter snow maxima (January and February) in west China. The spatial distribution of snow cover is very uneven geographically. Snow depths vary remarkably in altitude, especially between large mountains and basins in northwestern China. The highest snow depth is seen in the Altai Shan, followed by the Tien Shan, Pamirs, Karakoram and Kunlun Shan. Snow cover is also noted in the Elgis and Ili valleys. In contrast, snow cover is rare in the Tarim basin, Lop Nur and Badain Jaran desert. In the Junggar basin, snow is usually light, and frequently of short duration. Long distances to moisture sources, and the blocking effect of the mountains, keep the basins very dry. Snow cover, at about 59% in winter, is far from a pervasive feature over the QXP. Heavy snow cover is present only in the peripheries, including the Himalaya, Pamirs, Nyain-qêntanglha and eastern Tanggula Shan. In the vast interior (e.g. Qaidam basin and Yarlung Zangbo valley), snow cover is rare, and in the northern QXP it is light and of short duration.
Annual variations of snow cover in the three major snow-cover regions (Xinjiang, QXP and IM-NEC) were studied based on station observations (Fig. 7). For the Xinjiang and IM-NEC regions, the results of ground observation coincide with those derived from SMMR–Special Sensor Microwave/Imager (SSM/I) (Reference Li and ShiLi, 2000; Konig and others, 2001), but for the QXP there are biases because of insufficient station data over the plateau.
Interannual variability of snow cover over China during the past 50 years: (a) Xinjiang, (b) QXP and (c) IM-NEC region.

Figure 7a shows a time series of the annual and spring ablation season (March and April), number of days with snow cover, and annual cumulative daily snow-cover depth over northwest China from 1951 through 1997. It demonstrates that long-term variability of snow cover is normally characterized by random oscillation. Snow cover fluctuated around the mean, alternating between heavy and light snow cover. Neither abrupt changes nor continuation of snow minima from the late 1980s and early disappearance of spring snow cover were found. From the end of the 1980s, however, a prolonged decrease in snow cover was seen, but not as great as the three previous snow-deficit periods. In the 1960s and early 1970s, measured snow cover was lower than at any other time in the second half of the 20th century.
Over the QXP, long-term variability of snow cover is characterized by large interannual variabilities superimposed on a continuous increasing trend. Furthermore, the annual amplitude of snow-cover variability has increased significantly since the 1980s (Fig. 7b). Both extremely heavy and light snow-cover years occurred more frequently. The anomalies did not appear to be outside the range of natural variability.
In the IM-NEC region, there are several scattered areas with deep snow cover where large interannual variabilities in snow depth were observed. These areas include the Da Hinggan, the Xiao Hinggan and Xilinguole. There are also large seasonal variations in snow depth. The deepest snow cover appears in mid-winter, when the largest interannual snow depth variations also occur. The overall trend in the IM-NEC regions shows a very slight decrease (0.1ma–1) in snow depth (Fig. 7c).
The annual snow-cover variations depend both on the amount of winter snowfall and on the winter temperatures. Reference Li and ShiLi (2000) established relationships between snow cover and winter air temperatures and precipitation, respectively for the Xinijing, QXP and IM-NEC regions. They are:
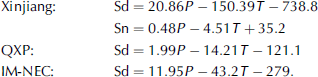
Sd and Sn are the annual daily cumulative snow depth data (cm) and annual number of snow-cover days, respectively, P is the amount of winter snowfall (mm) and T is the mean air temperature during the snow-cover season.
The interannual snow-cover variations based on the above functions coincide well with the observed results, with an error range within ±10%. However, these functions cannot properly reproduce long-term changes in snow cover, probably due to the large errors in measuring solid precipitation.
Changes in sea ice
The Bohai Sea and the northern part of the Yellow Sea are located on the south edge of the Northern Hemisphere sea ice (37˚05'–40˚55' N, 117˚30'–125˚30' E). Since the early 1950s, sea-ice coverage and thickness over the oceans were monitored for assessment and prediction of harbor disasters. Sea-ice disasters are classified into five grades according to the sea-ice cover and thickness (Reference Zhang, Yu, Tang, Preller and WuZhang, 1993). Heavy sea-ice disasters occurred in 1956/57 and the winter of 1968/69, and less heavy disasters in the winters of 1967/68 and 1976/77.
During the past five decades, the Bohai Sea ice cover has shown a declining trend, while there is no obvious trend over the north Yellow Sea area. For the whole area, however, a general decline in sea-ice coverage has been shown since late 1960s (Fig. 8).
Changes in sea-ice area over the Bohai Sea (a), north Yellow Sea (b) and the two regions combined (c).

Reference Zhang, Yu, Tang, Preller and WuZhang (1993) detected the relationships between sea-ice cover and climate, showing that the cycles of solar activities and El Niño events correlate to the anomalous sea-ice conditions. The maxima and minima of solar activities, and the intensity and timing of the El Niño events, play a very important role in the occurrence of severe ice conditions.
Changes in river ice
We discuss the changes in river ice over two key areas – Inner Mongolia and northeast China – where river-ice data are available. River ice of the Inner Mongolia section of the Yellow River has been observed at the Sanhuhekou Shizuishan, Baotou, Zhaojunfeng and Toudaogui hydrological stations. River ice of the Songhuajiang river has been observed at the Haarbin hydrological station, and of the Nengjian river at Fulaerji station.
Changes in river ice can be described as changes in freeze-up and break-up dates, length of frost period as well as ice thickness.
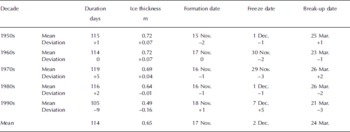
Over the Inner Mongolia section of the Yellow River, freeze-up dates are 5 days later in the 1990s than the 1950s–90 s average, and the break-up dates in the 1990s are 3 days earlier than average. The frost period duration and the maximum ice thickness in the 1990s are 9 days shorter and 0.16m thinner, respectively, than average (Table 3; Fig. 9).
River-ice changes in north China since the 1950s: (a) freeze date, (b) break-up date, (c) river ice duration and (d) maximum ice thickness.

At Haarbin, the freeze-up date is 1 day later, and the break-up date 1 day earlier, in the 1990s than the 1950s–90s average. The frost period duration and the maximum ice thickness in the 1990s are respectively 4 days shorter and 0.21 m thinner than average.
At Fulaerji, the freeze-up date is 6 days later, and the break-up date 2.5 days earlier, in the 1990s than the 1950s–90s average. The frost period duration and the maximum ice thickness in the 1990s are respectively 10 days shorter and 0.06m thinner than average.
In three study areas, the frost period and the maximum ice thickness have decreased during the period since the late 1970s, when global and regional climate warming is most prominent. During the period 1959–2002, annual mean air temperature increased by 0.48˚Ca–1, and winter air temperature increased by 0.72˚Ca–1 over northeast China (Reference Sun and YuanSun and Yuan, 2005), where the Songhuajiang and Nengjiang rivers are located.
Decadal characteristics of river ice in Ningxia–Inner Mongolian section of Yellow River for the past five decades
Summary
In the past century, global warming has affected the climate in China. The annual mean air temperature in China for the past century coincides with that of the Northern Hemisphere (Reference Wang, Li, Wei and WangS. Wang and others, 2005). The global temperature has increased by 0.6 ±0.2˚C since 1860 (Reference HoughtonHoughton and others, 2001), while temperature in China increased by 0.58˚C. The warmest years have occurred since 1983 on a global scale, and the most obvious warming occurs in the winter. Since 1985, there have been 20 warm winters in China (Reference Wang, Li, Wei and WangS. Wang and others, 2005), contributing heavily to the decay of the cryosphere (Fig. 10).
Spatial distribution of changes of cryospheric components in China for the past approximately five decades.

Glaciers in various areas of west China have experienced different change in recent decades. Although in most areas glaciers are either retreating or have vanished (80.8%), some glaciers are still advancing (19.2%). It is essential to study the mechanism of the advancing glaciers in order to predict the behavior of glaciers over the QXP and other high Asian mountains.
Snow cover in western China did not experience a continual decrease during the great warming periods of the 1980s and 1990s. It is interesting to note that no correlation was identified between temperature and precipitation in the snow-cover season. The long-term variability of western China snow cover is characterized by a large interannual variation superimposed on a small increasing trend.
Frozen ground, including permafrost, is decaying both in the QXP and in northeast China. The most significant changes occurred in the regions with thickest SFG, i.e. the inland QXP, then the northeastern and northwestern QXP.
The duration of shortened SFG varied in different regions. Significant changes also occurred in the inland and northeastern regions of the QTP. The cold-season air temperature is the main factor controlling SFG change. The warming trends of ground surface temperatures are more significant than air temperature.
The sea-ice coverage over the Bohai and Yellow Seas has deceased since the 1980s. River-ice duration and ice thickness are also decreasing in northern China.
Acknowledgements
This study is supported by the Ministry of Science and Technology of China (MoST) (2007CB411500; 2005DFA20930), the Climate Project of the China Meteorological Administration, and the Hundred Talents Project of the Chinese Academy of Sciences. We thank V. Lytle and T. Villinger from the CliC International Project Office, R. Barry and an anonymous reviewer for help with our English.



